| Param | Original file | Final file |
|---|---|---|
| Filename | modeM0/AS1A14_009T01_9000006534_55350cztM0_level2.fits | modeM0/AS1A14_009T01_9000006534_55350cztM0_level2_quad_clean.evt |
| Size (bytes) | 586,952,640 | 119,724,480 |
| Size | 559.8 MB | 114.2 MB |
| Events in quadrant A | 3,988,558 | 795,371 |
| Events in quadrant B | 4,214,637 | 855,543 |
| Events in quadrant C | 4,845,592 | 757,894 |
| Events in quadrant D | 8,009,559 | 618,011 |
| Mode SS | |||
|---|---|---|---|
| Quadrant | BADHDUFLAG | Total packets | Discarded packets |
| A | 0 | 174 | 0 |
| B | 0 | 174 | 0 |
| C | 0 | 174 | 0 |
| D | 0 | 174 | 0 |
| Mode M0 | |||
|---|---|---|---|
| Quadrant | BADHDUFLAG | Total packets | Discarded packets |
| A | 0 | 18574 | 0 |
| B | 0 | 18954 | 0 |
| C | 0 | 20903 | 0 |
| D | 0 | 29894 | 0 |
| Quadrant | Total seconds | Saturated seconds | Saturation percentage |
|---|---|---|---|
| A | 8611 | 44 | 0.510974% |
| B | 8610 | 75 | 0.871080% |
| C | 8610 | 229 | 2.659698% |
| D | 8611 | 1278 | 14.841482% |
Noise dominated data is calculated using 1-second bins in cleaned event files. If a bin has >2000 counts, and if more than 50% of those come from <1% of pixels, then it is considered to be noise-dominated and hence unusable.
| Quadrant | # 1 sec bins | Bins with >0 counts | Bins with >2000 counts | High rate bins dominated by noise | Noise dominated (total time) | Noise dominated (detector-on time) | Marked lightcurve |
|---|---|---|---|---|---|---|---|
| A | 8611 | 8611 | 31 | 31 | 0.36% | 0.36% | 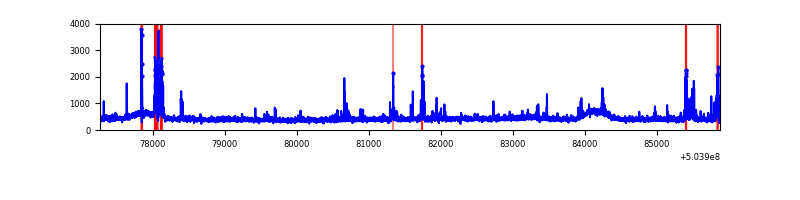 |
| B | 8610 | 8610 | 26 | 26 | 0.30% | 0.30% | 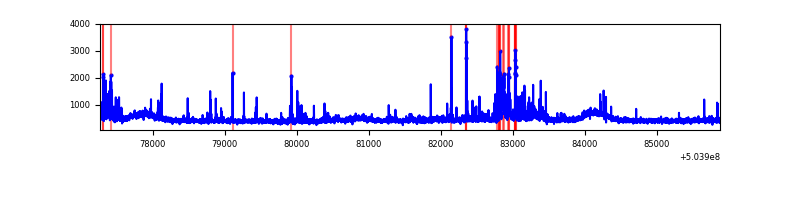 |
| C | 8610 | 8610 | 193 | 193 | 2.24% | 2.24% | 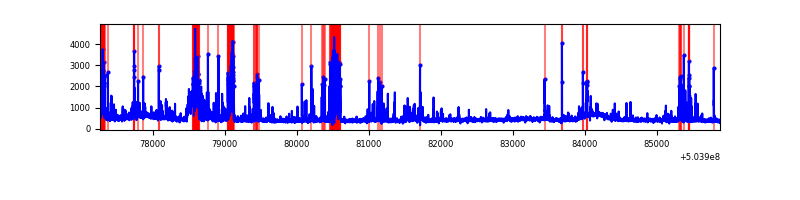 |
| D | 8611 | 8611 | 1137 | 1137 | 13.20% | 13.20% | 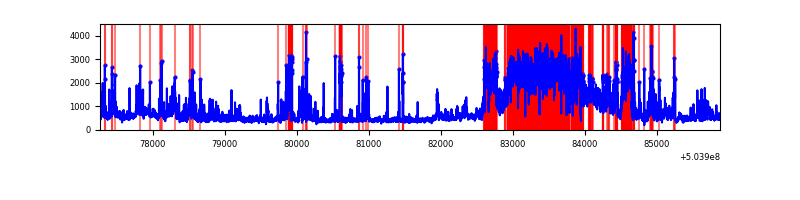 |
Top three noisy pixels from each quadrant. If the there are fewer than three noisy pixels in the level2.evt file, extra rows are filled as -1
| Pixel properties | Quadrant properties | ||||||
|---|---|---|---|---|---|---|---|
| Quadrant | DetID | PixID | Counts | Sigma | Mean | Median | Sigma |
| A | 3 | 45 | 114136 | 502.37 | 916 | 891 | 225.4 |
| A | 0 | 8 | 110534 | 486.39 | 916 | 891 | 225.4 |
| A | 12 | 3 | 50112 | 218.35 | 916 | 891 | 225.4 |
| B | 5 | 185 | 206089 | 1037.03 | 911 | 874 | 197.9 |
| B | 0 | 199 | 139440 | 700.23 | 911 | 874 | 197.9 |
| B | 10 | 247 | 124546 | 624.96 | 911 | 874 | 197.9 |
| C | 9 | 38 | 513329 | 2101.06 | 895 | 886 | 243.9 |
| C | 13 | 3 | 480955 | 1968.33 | 895 | 886 | 243.9 |
| C | 12 | 249 | 122604 | 499.05 | 895 | 886 | 243.9 |
| D | 11 | 129 | 4207690 | 17575.43 | 848 | 810 | 239.4 |
| D | 5 | 38 | 107529 | 445.85 | 848 | 810 | 239.4 |
| D | 15 | 42 | 76355 | 315.61 | 848 | 810 | 239.4 |
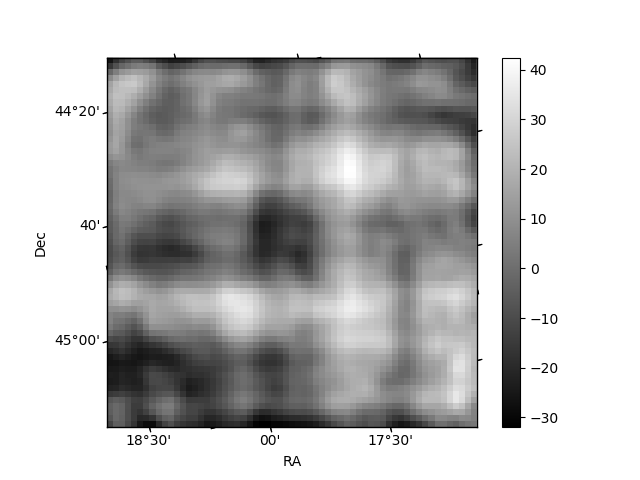
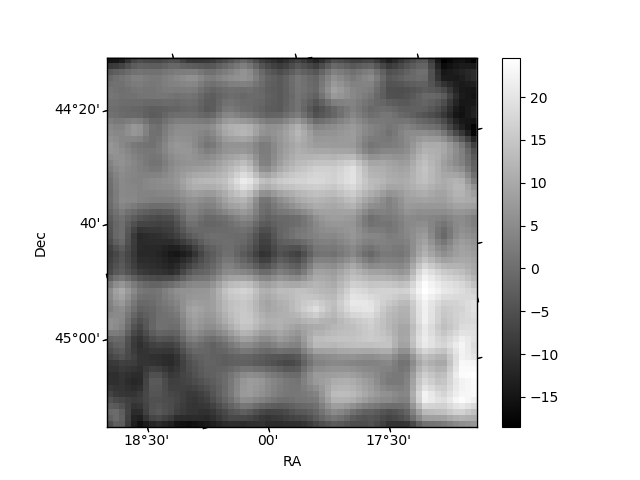
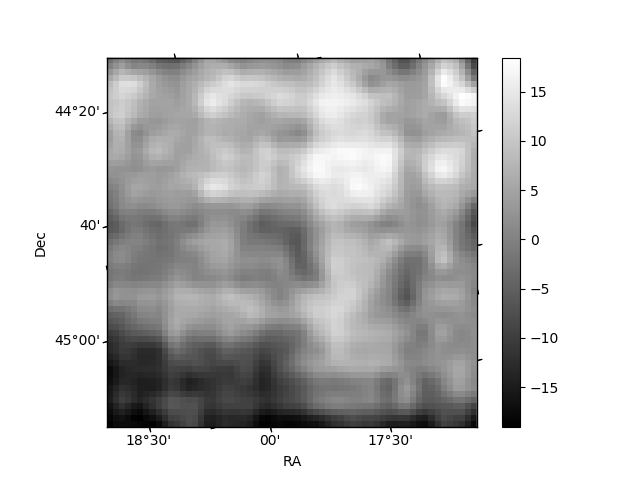
Histogram calculated using DETX and DETY for each event in the final _common_clean file
| Quadrant A | 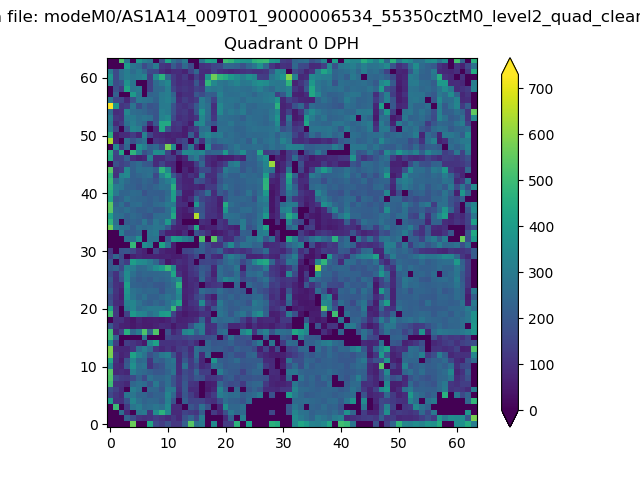 |
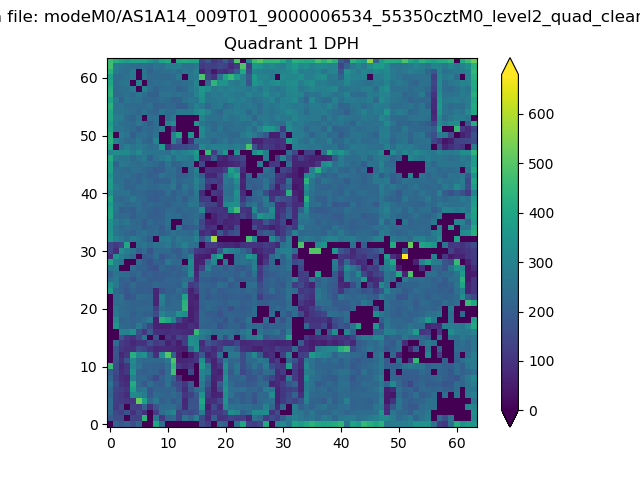 |
Quadrant B |
|---|---|---|---|
| Quadrant D | 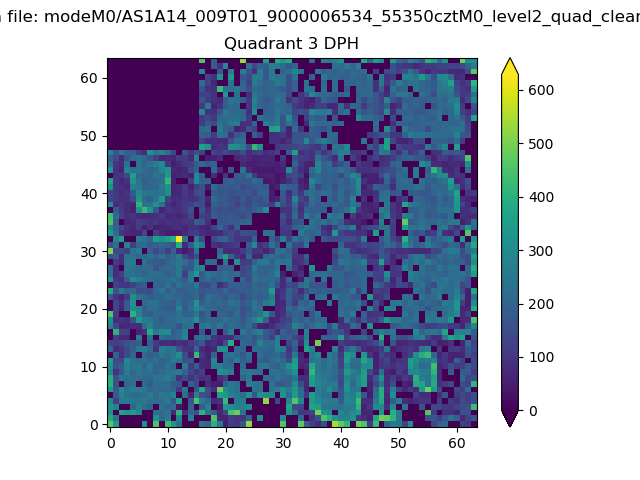 |
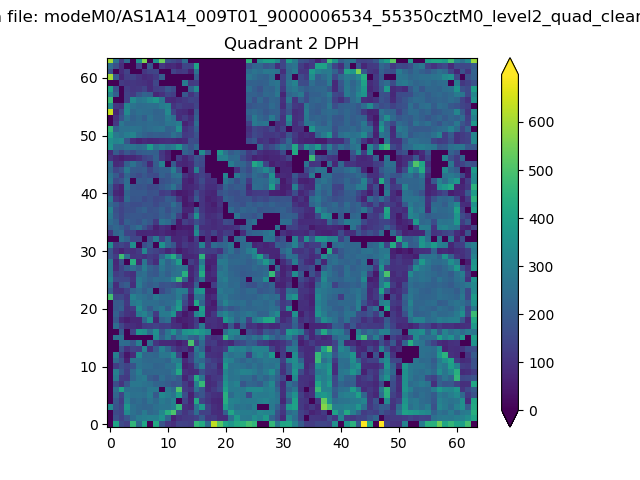 |
Quadrant C |
| Plot type | Count rate plots | Images |
|---|---|---|
| Comparison with Poisson distribution Blue bars denote a histogram of data divided into 1 sec bins. Red curve is a Poisson curve with rate = median count rate of data. |
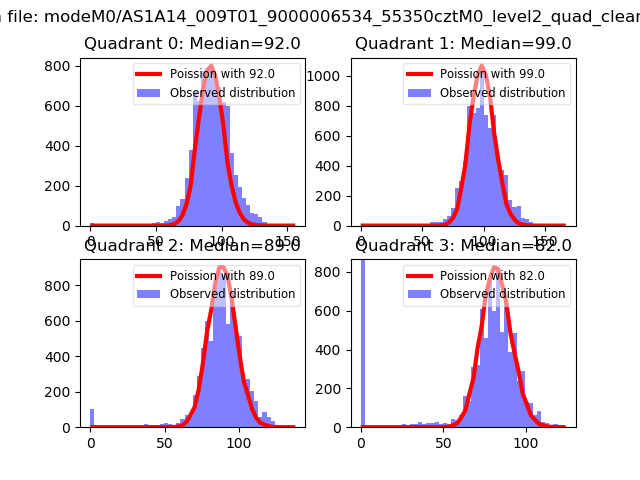 |
 |
| Quadrant-wise count rates Data is divided into 100 sec bins |
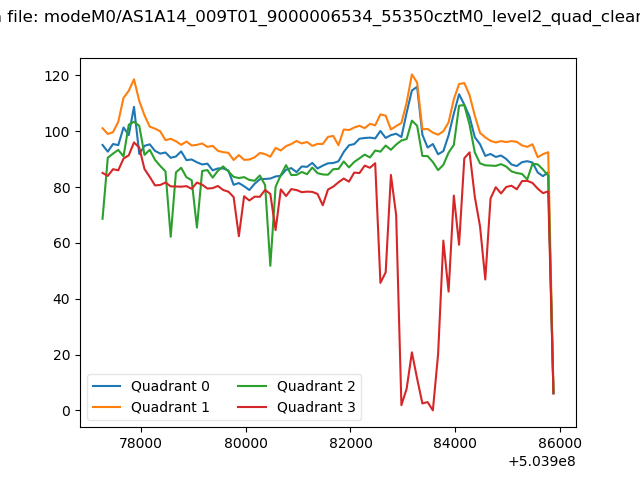 |
|
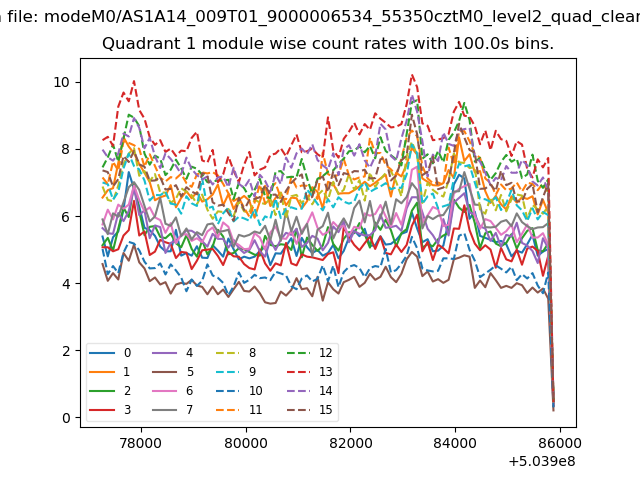
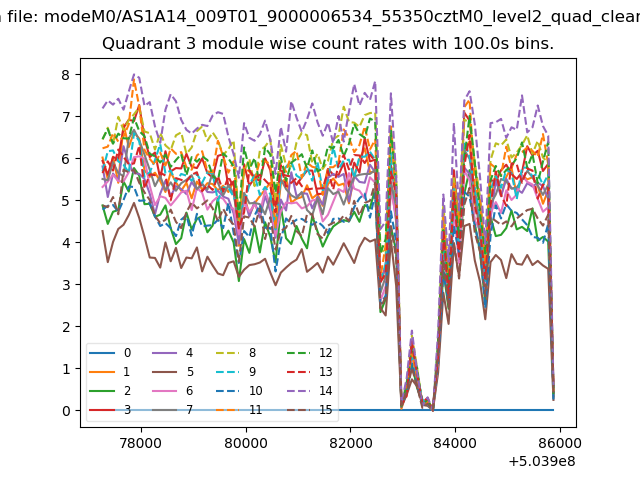
| Module-wise count rates for Quadrant A Data is divided into 100 sec bins |
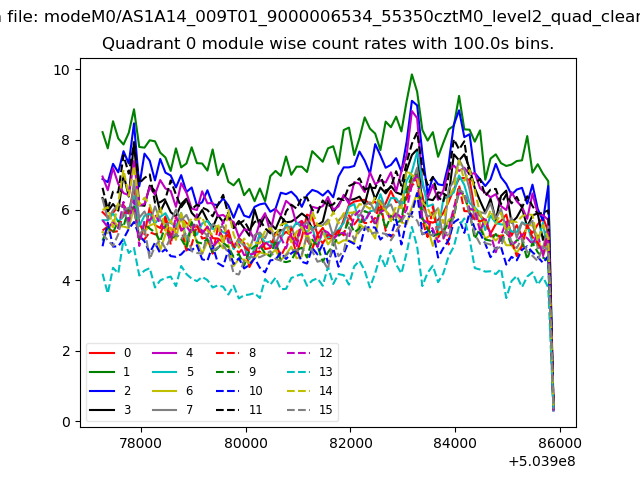 |
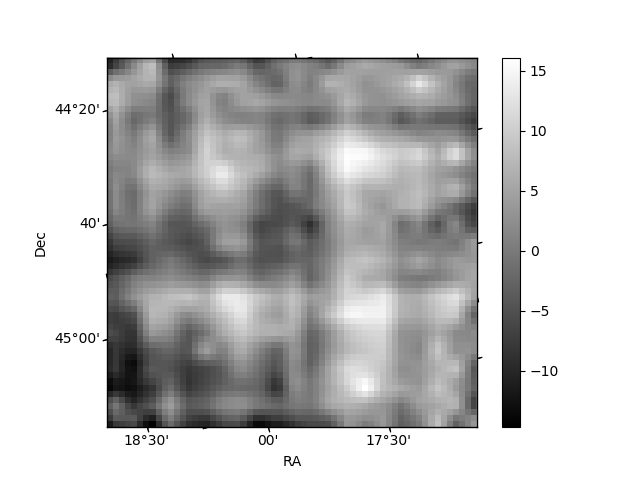 |
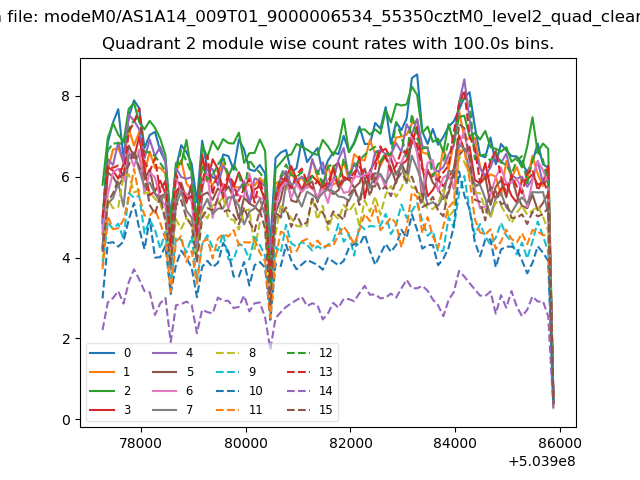
| Module-wise count rates for Quadrant B Data is divided into 100 sec bins |
 |
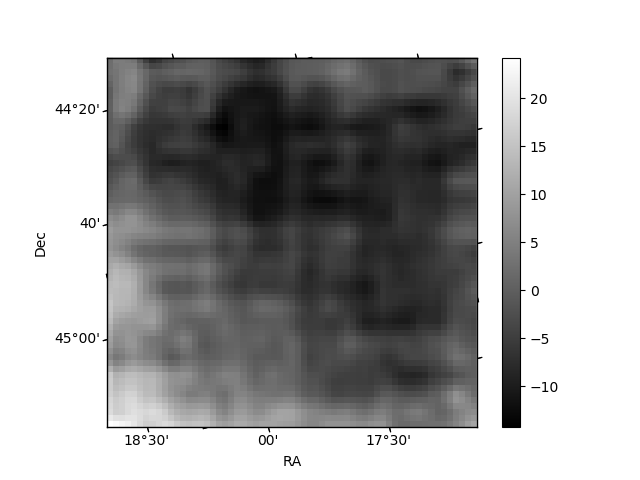 |
| Module-wise count rates for Quadrant C Data is divided into 100 sec bins |
 |
 |
| Module-wise count rates for Quadrant D Data is divided into 100 sec bins |
 |
 |
| Parameter | Plot |
|---|---|
| CZT HV Monitor | 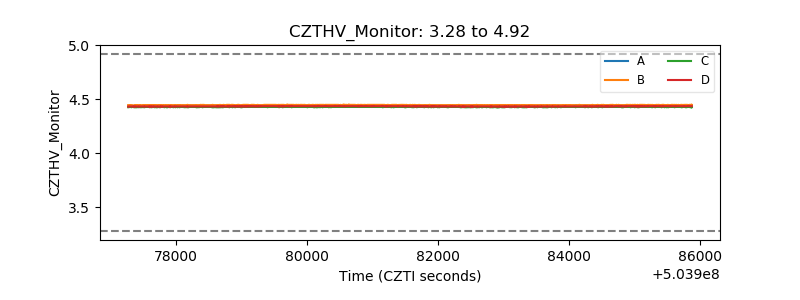 |
| D_VDD | 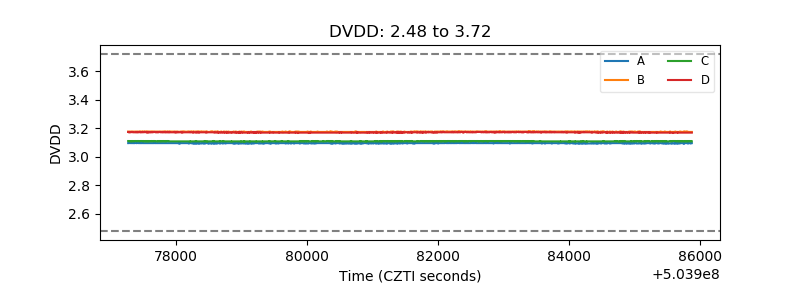 |
| Temperature 1 | 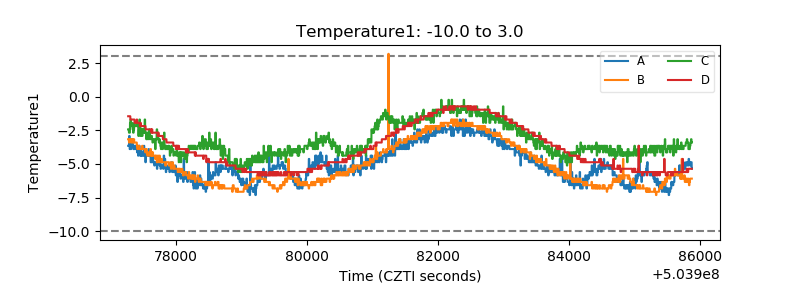 |
| Veto HV Monitor | 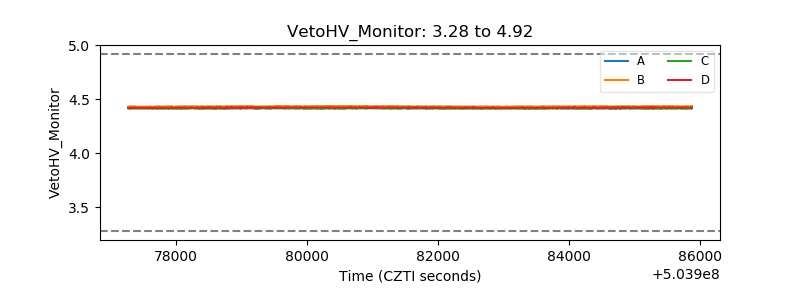 |
| Veto LLD | 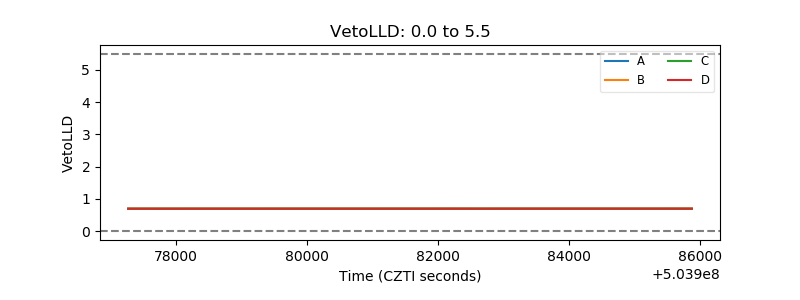 |
| Alpha Counter | 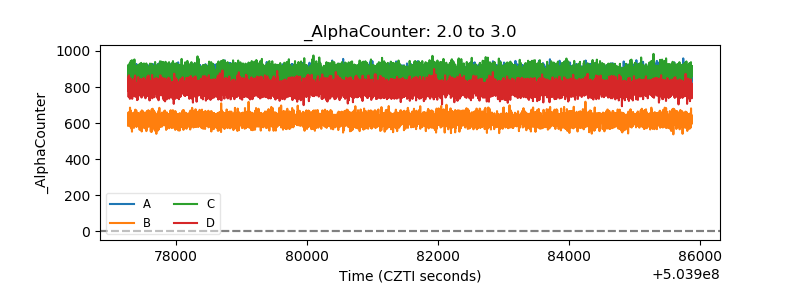 |
| _CPM_Rate | 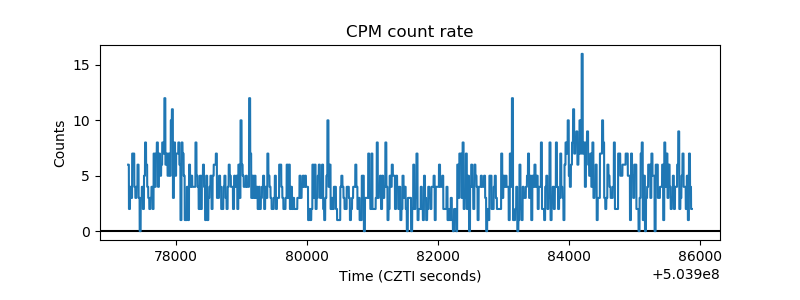 |
| CZT Counter | 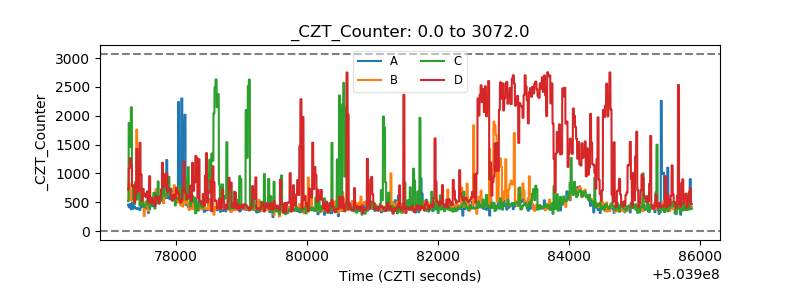 |
| +2.5 Volts monitor | 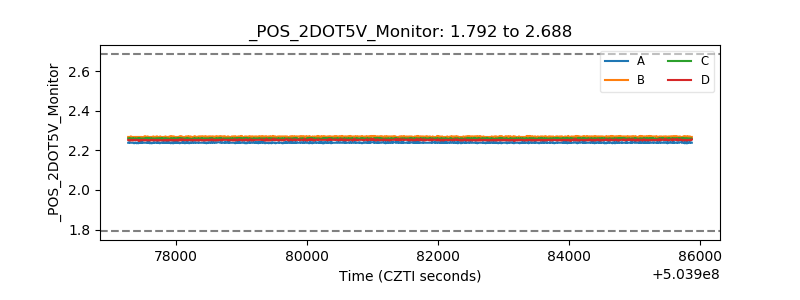 |
| +5 Volts monitor | 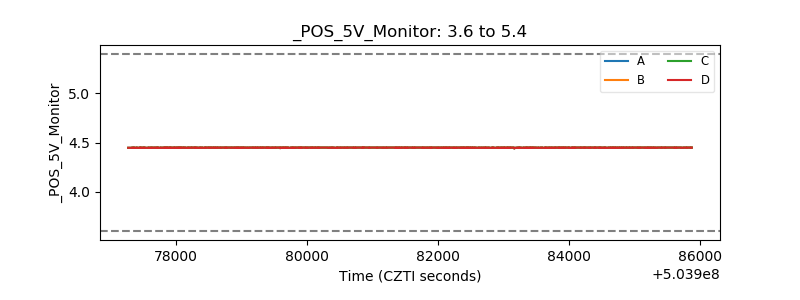 |
| _ROLL_ROT | 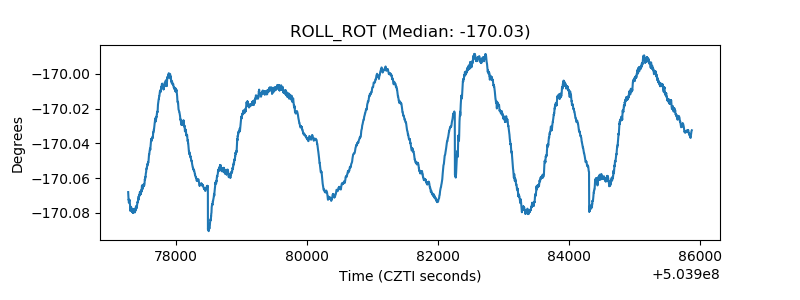 |
| _Roll_DEC | 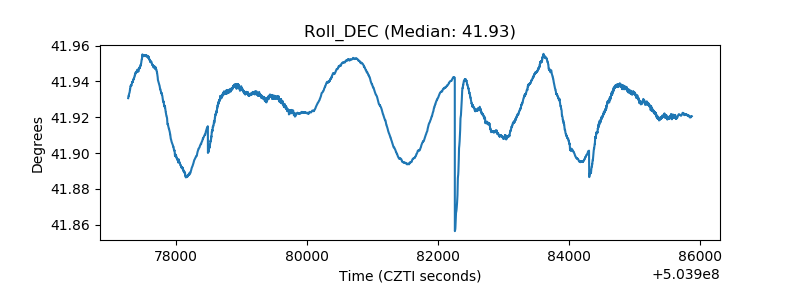 |
| _Roll_RA | 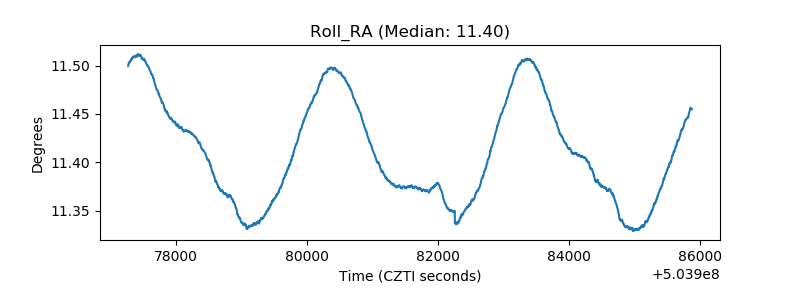 |
| Veto Counter | 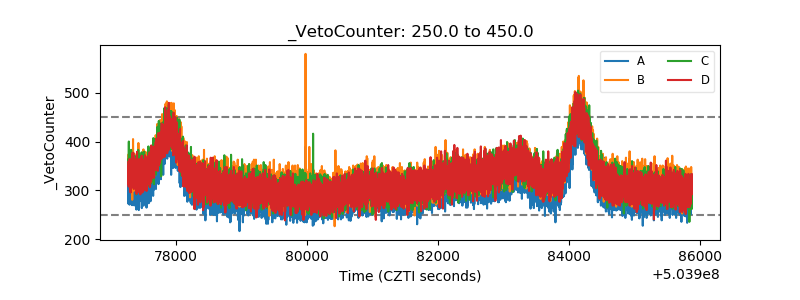 |