| Param | Original file | Final file |
|---|---|---|
| Filename | modeM0/AS1A14_009T01_9000006534_55353cztM0_level2.fits | modeM0/AS1A14_009T01_9000006534_55353cztM0_level2_quad_clean.evt |
| Size (bytes) | 1,211,702,400 | 272,640,960 |
| Size | 1.1 GB | 260.0 MB |
| Events in quadrant A | 9,107,529 | 1,772,885 |
| Events in quadrant B | 10,179,298 | 1,841,302 |
| Events in quadrant C | 9,546,175 | 1,729,698 |
| Events in quadrant D | 14,494,943 | 1,554,859 |
| Mode SS | |||
|---|---|---|---|
| Quadrant | BADHDUFLAG | Total packets | Discarded packets |
| A | 0 | 398 | 0 |
| B | 0 | 398 | 0 |
| C | 0 | 398 | 0 |
| D | 0 | 398 | 0 |
| Mode M0 | |||
|---|---|---|---|
| Quadrant | BADHDUFLAG | Total packets | Discarded packets |
| A | 0 | 42044 | 3 |
| B | 0 | 44460 | 3 |
| C | 0 | 43172 | 3 |
| D | 0 | 57048 | 4 |
| Mode M9 | |||
|---|---|---|---|
| Quadrant | BADHDUFLAG | Total packets | Discarded packets |
| A | 0 | 15 | 0 |
| B | 0 | 15 | 0 |
| C | 0 | 15 | 0 |
| D | 0 | 15 | 0 |
| Quadrant | Total seconds | Saturated seconds | Saturation percentage |
|---|---|---|---|
| A | 19688 | 290 | 1.472978% |
| B | 19689 | 798 | 4.053025% |
| C | 19689 | 274 | 1.391640% |
| D | 19688 | 1221 | 6.201747% |
Noise dominated data is calculated using 1-second bins in cleaned event files. If a bin has >2000 counts, and if more than 50% of those come from <1% of pixels, then it is considered to be noise-dominated and hence unusable.
| Quadrant | # 1 sec bins | Bins with >0 counts | Bins with >2000 counts | High rate bins dominated by noise | Noise dominated (total time) | Noise dominated (detector-on time) | Marked lightcurve |
|---|---|---|---|---|---|---|---|
| A | 21023 | 19691 | 49 | 49 | 0.23% | 0.25% | 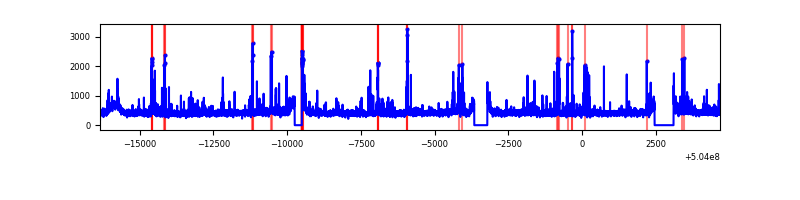 |
| B | 21024 | 19692 | 246 | 246 | 1.17% | 1.25% | 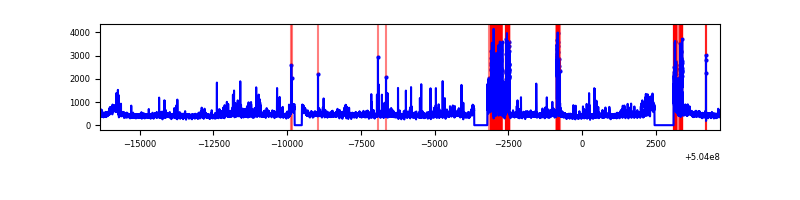 |
| C | 21024 | 19692 | 91 | 91 | 0.43% | 0.46% | 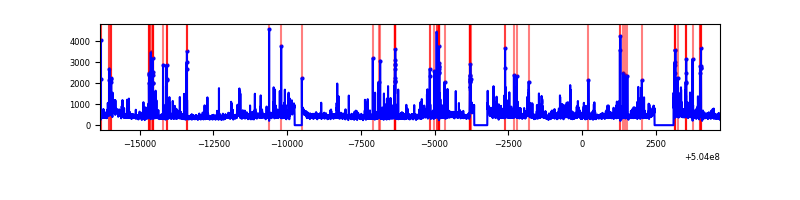 |
| D | 21023 | 19691 | 965 | 965 | 4.59% | 4.90% | 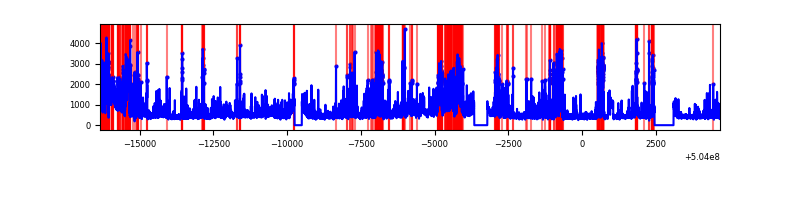 |
Top three noisy pixels from each quadrant. If the there are fewer than three noisy pixels in the level2.evt file, extra rows are filled as -1
| Pixel properties | Quadrant properties | ||||||
|---|---|---|---|---|---|---|---|
| Quadrant | DetID | PixID | Counts | Sigma | Mean | Median | Sigma |
| A | 3 | 78 | 278335 | 542.24 | 2089 | 2037 | 509.6 |
| A | 3 | 45 | 168221 | 326.14 | 2089 | 2037 | 509.6 |
| A | 12 | 3 | 127763 | 246.74 | 2089 | 2037 | 509.6 |
| B | 5 | 185 | 760703 | 1739.43 | 2045 | 1964 | 436.2 |
| B | 5 | 172 | 505759 | 1154.96 | 2045 | 1964 | 436.2 |
| B | 9 | 254 | 375235 | 855.73 | 2045 | 1964 | 436.2 |
| C | 13 | 3 | 322293 | 573.69 | 2048 | 2029 | 558.2 |
| C | 12 | 249 | 310392 | 552.38 | 2048 | 2029 | 558.2 |
| C | 9 | 38 | 247495 | 439.71 | 2048 | 2029 | 558.2 |
| D | 11 | 129 | 5552261 | 9951.09 | 1999 | 1914 | 557.8 |
| D | 5 | 38 | 184698 | 327.71 | 1999 | 1914 | 557.8 |
| D | 5 | 173 | 158989 | 281.62 | 1999 | 1914 | 557.8 |
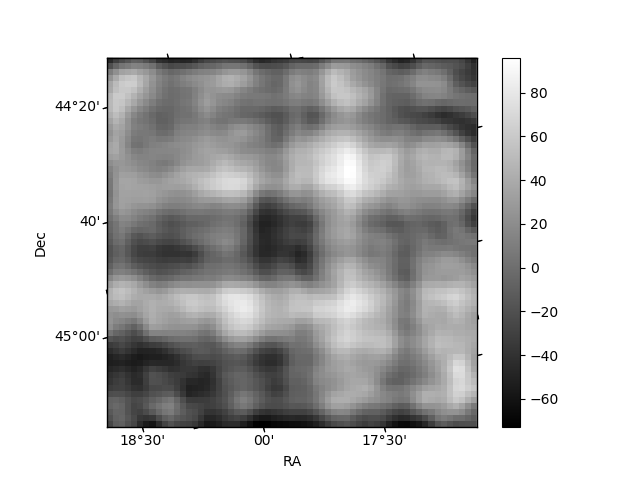
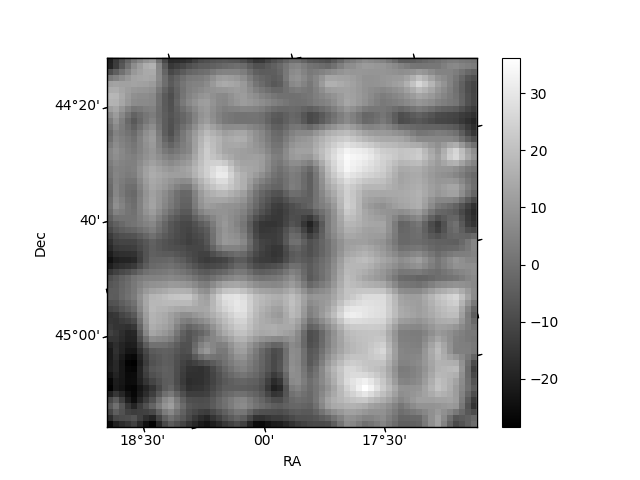
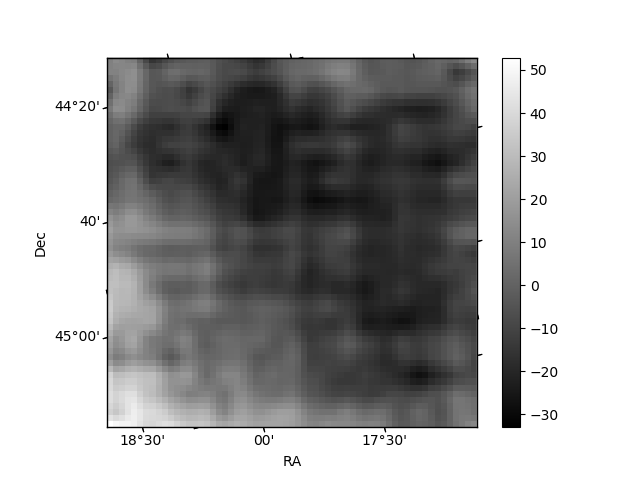
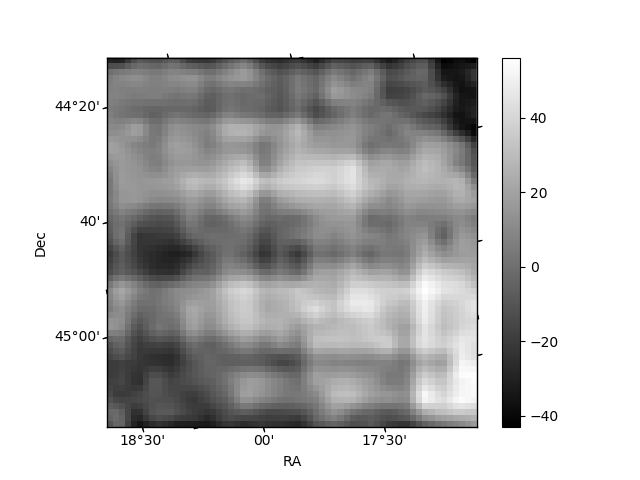
Histogram calculated using DETX and DETY for each event in the final _common_clean file
| Quadrant A | 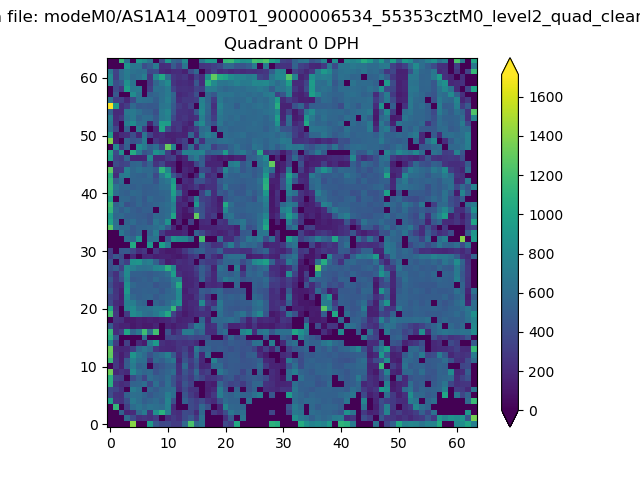 |
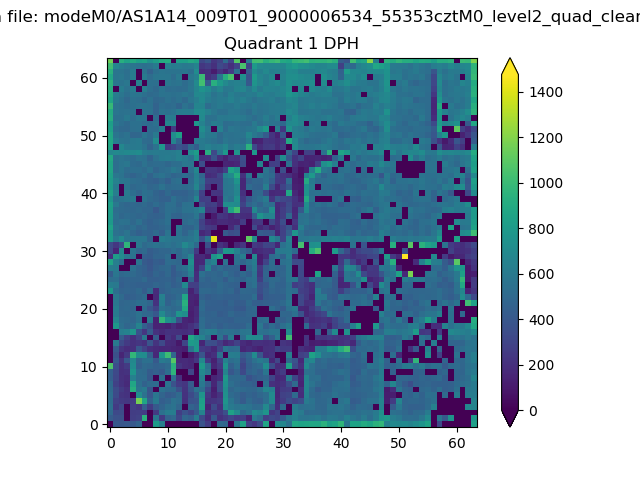 |
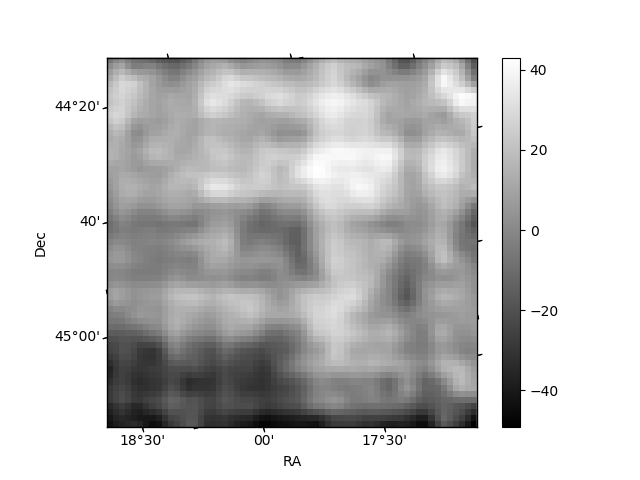
Quadrant B |
|---|---|---|---|
| Quadrant D | 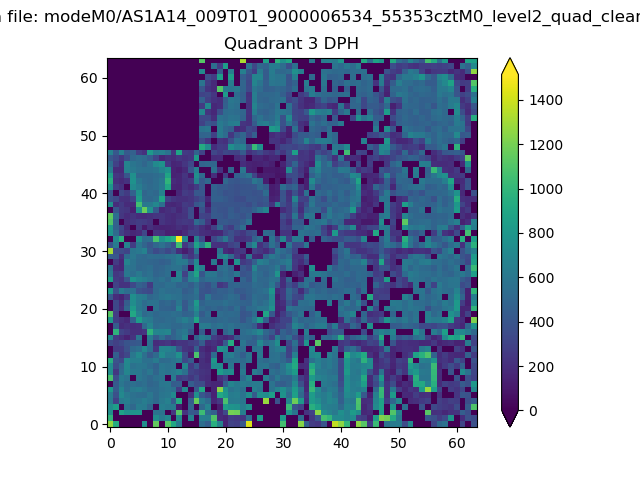 |
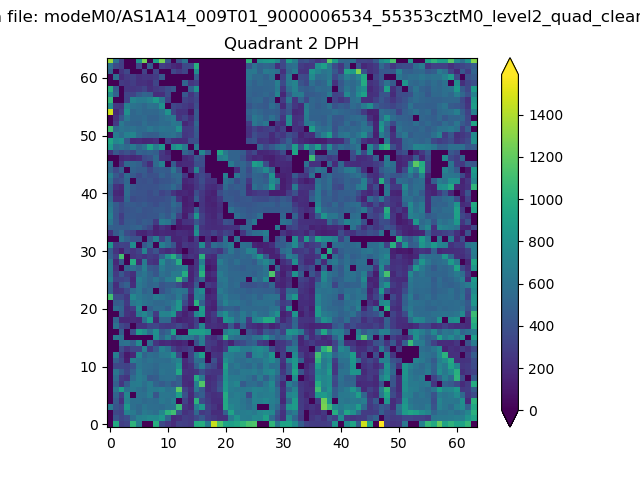 |
Quadrant C |
| Plot type | Count rate plots | Images |
|---|---|---|
| Comparison with Poisson distribution Blue bars denote a histogram of data divided into 1 sec bins. Red curve is a Poisson curve with rate = median count rate of data. |
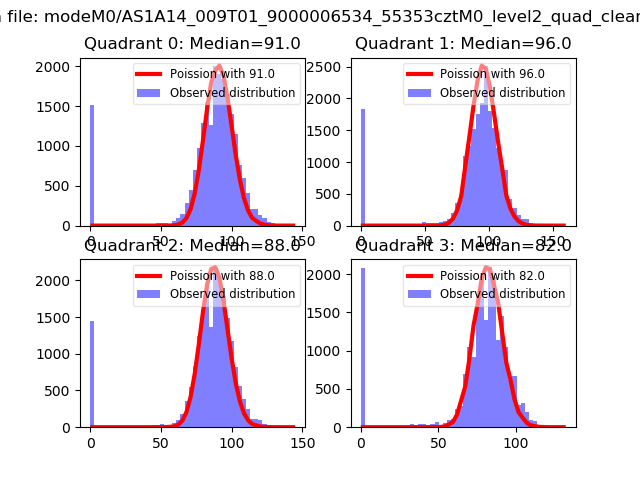 |
 |
| Quadrant-wise count rates Data is divided into 100 sec bins |
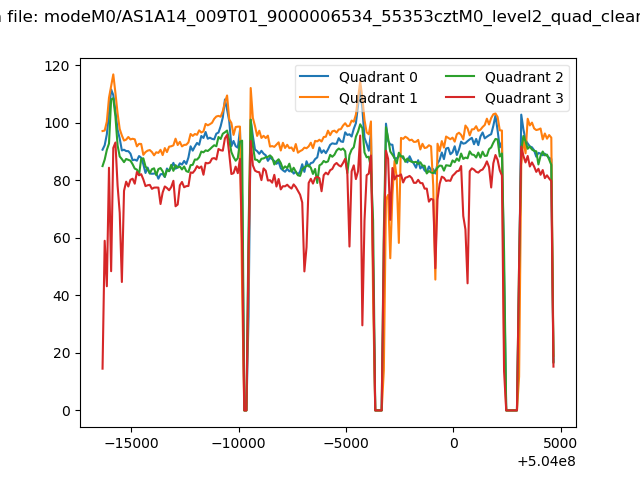 |
|
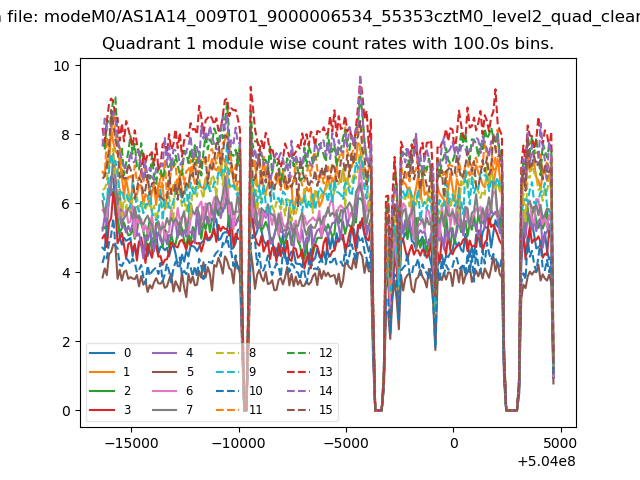
| Module-wise count rates for Quadrant A Data is divided into 100 sec bins |
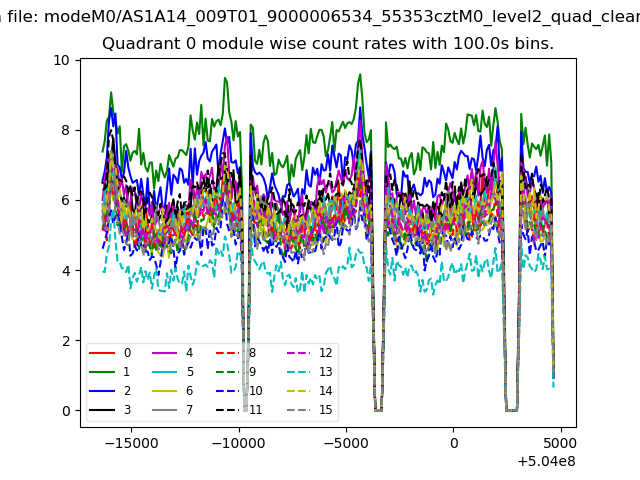 |
 |
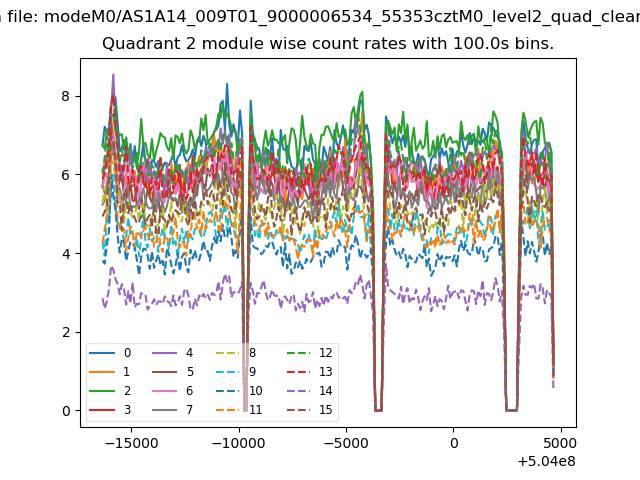
| Module-wise count rates for Quadrant B Data is divided into 100 sec bins |
 |
 |
| Module-wise count rates for Quadrant C Data is divided into 100 sec bins |
 |
 |
| Module-wise count rates for Quadrant D Data is divided into 100 sec bins |
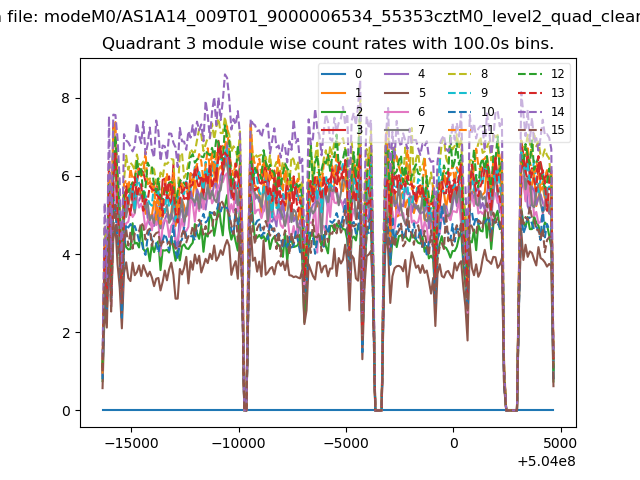 |
 |
| Parameter | Plot |
|---|---|
| CZT HV Monitor |  |
| D_VDD | 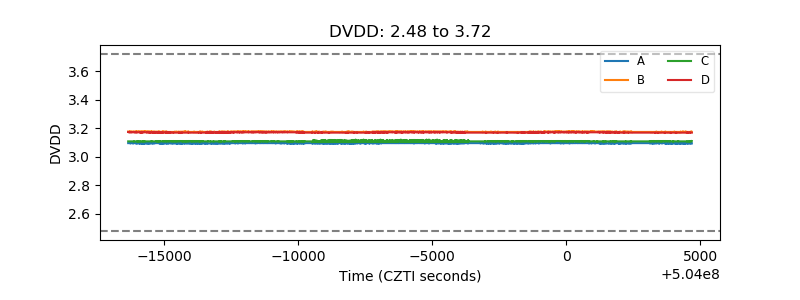 |
| Temperature 1 | 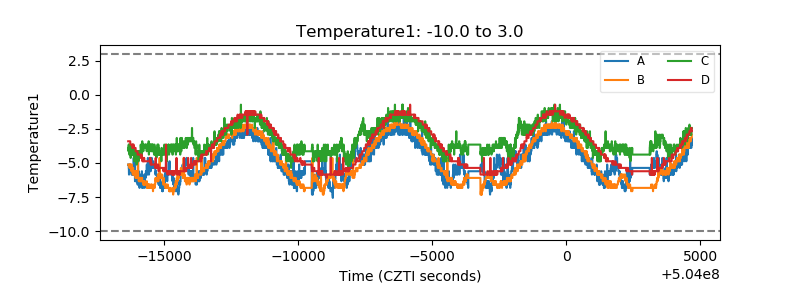 |
| Veto HV Monitor | 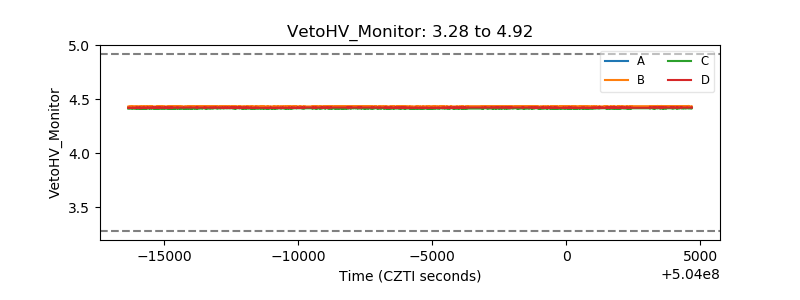 |
| Veto LLD | 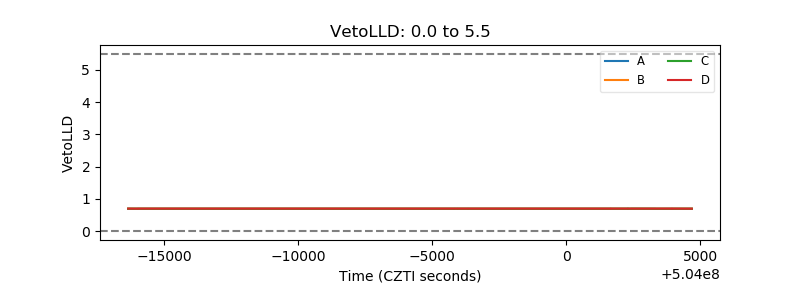 |
| Alpha Counter | 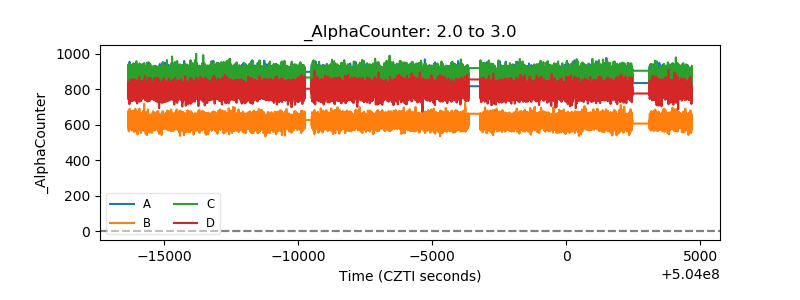 |
| _CPM_Rate | 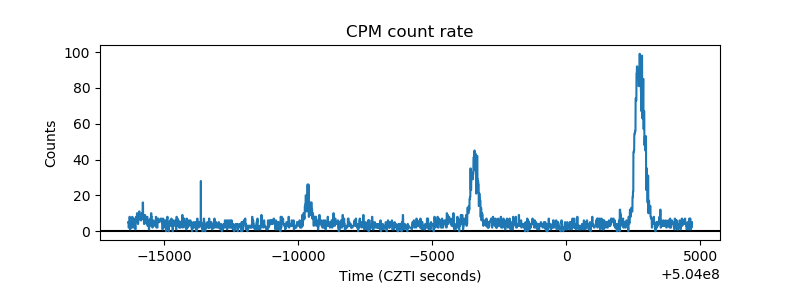 |
| CZT Counter | 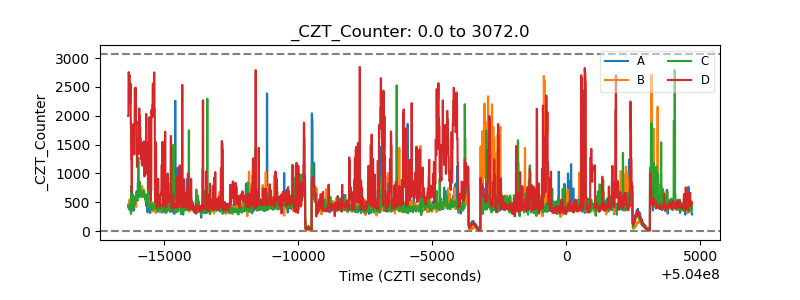 |
| +2.5 Volts monitor | 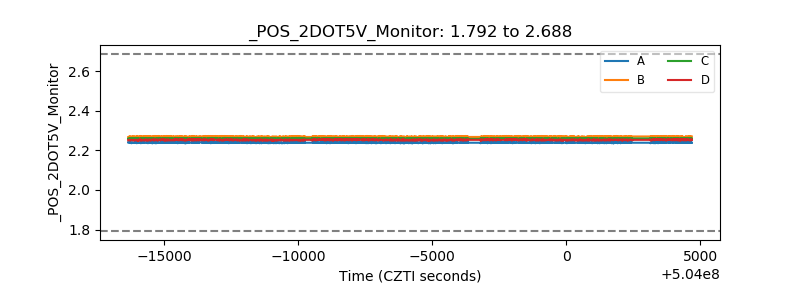 |
| +5 Volts monitor | 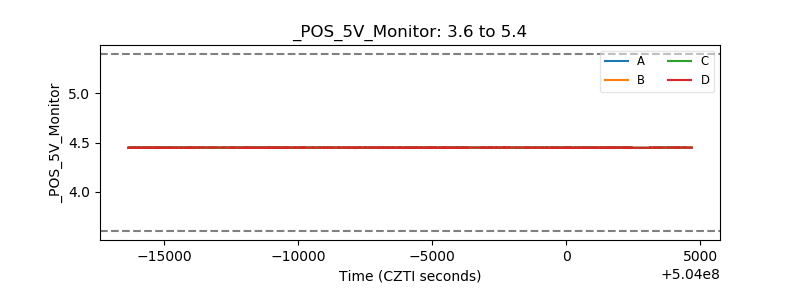 |
| _ROLL_ROT | 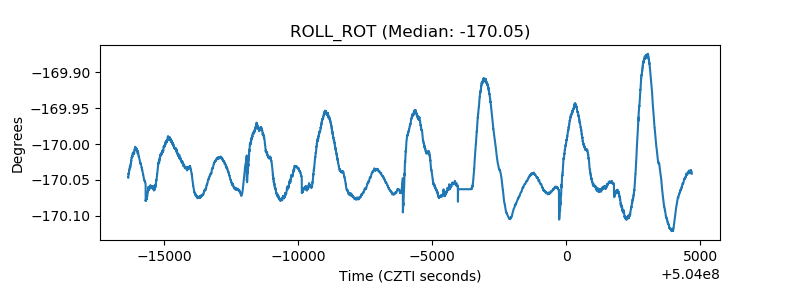 |
| _Roll_DEC | 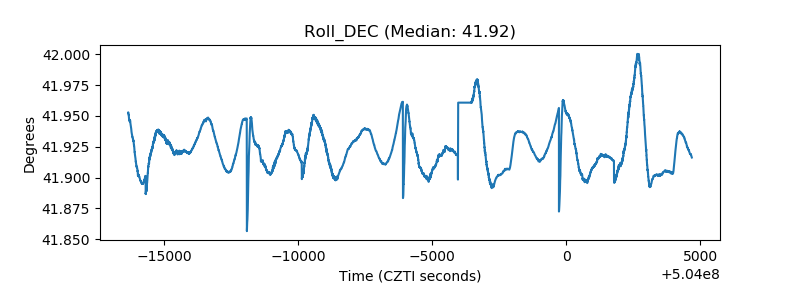 |
| _Roll_RA | 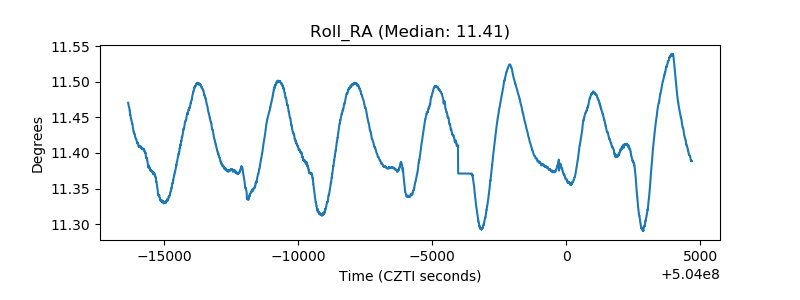 |
| Veto Counter | 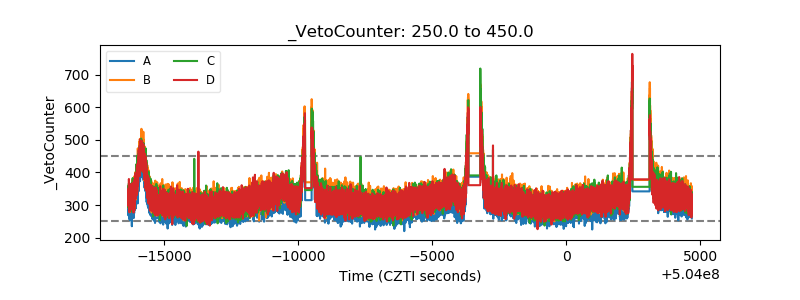 |