| Param | Original file | Final file |
|---|---|---|
| Filename | modeM0/AS1A14_009T01_9000006534_55356cztM0_level2.fits | modeM0/AS1A14_009T01_9000006534_55356cztM0_level2_quad_clean.evt |
| Size (bytes) | 374,227,200 | 98,066,880 |
| Size | 356.9 MB | 93.5 MB |
| Events in quadrant A | 3,012,774 | 641,253 |
| Events in quadrant B | 3,212,952 | 683,571 |
| Events in quadrant C | 3,389,656 | 610,166 |
| Events in quadrant D | 3,725,905 | 576,923 |
| Mode SS | |||
|---|---|---|---|
| Quadrant | BADHDUFLAG | Total packets | Discarded packets |
| A | 0 | 132 | 0 |
| B | 0 | 132 | 0 |
| C | 0 | 132 | 0 |
| D | 0 | 132 | 0 |
| Mode M0 | |||
|---|---|---|---|
| Quadrant | BADHDUFLAG | Total packets | Discarded packets |
| A | 0 | 13863 | 1 |
| B | 0 | 14167 | 1 |
| C | 0 | 15042 | 1 |
| D | 0 | 15735 | 1 |
| Mode M9 | |||
|---|---|---|---|
| Quadrant | BADHDUFLAG | Total packets | Discarded packets |
| A | 0 | 10 | 0 |
| B | 0 | 10 | 0 |
| C | 0 | 10 | 0 |
| D | 0 | 10 | 0 |
| Quadrant | Total seconds | Saturated seconds | Saturation percentage |
|---|---|---|---|
| A | 6566 | 83 | 1.264088% |
| B | 6567 | 86 | 1.309578% |
| C | 6567 | 101 | 1.537993% |
| D | 6567 | 190 | 2.893254% |
Noise dominated data is calculated using 1-second bins in cleaned event files. If a bin has >2000 counts, and if more than 50% of those come from <1% of pixels, then it is considered to be noise-dominated and hence unusable.
| Quadrant | # 1 sec bins | Bins with >0 counts | Bins with >2000 counts | High rate bins dominated by noise | Noise dominated (total time) | Noise dominated (detector-on time) | Marked lightcurve |
|---|---|---|---|---|---|---|---|
| A | 7526 | 6567 | 1 | 1 | 0.01% | 0.02% | 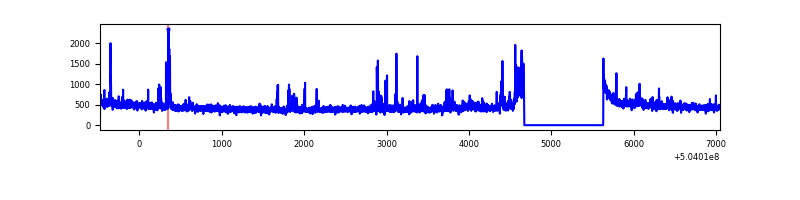 |
| B | 7527 | 6568 | 13 | 13 | 0.17% | 0.20% | 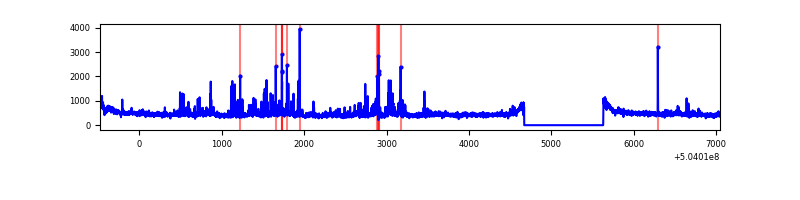 |
| C | 7527 | 6568 | 50 | 50 | 0.66% | 0.76% | 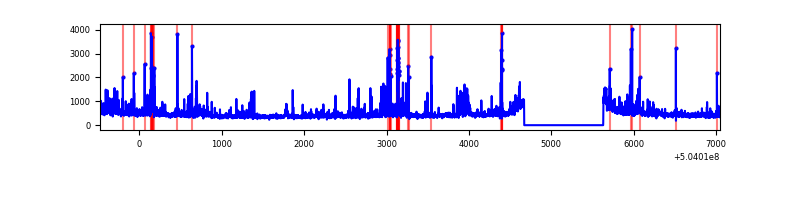 |
| D | 7527 | 6568 | 140 | 140 | 1.86% | 2.13% | 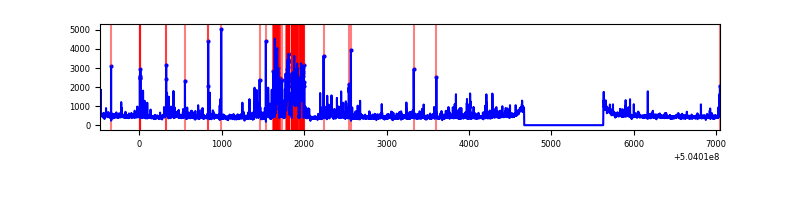 |
Top three noisy pixels from each quadrant. If the there are fewer than three noisy pixels in the level2.evt file, extra rows are filled as -1
| Pixel properties | Quadrant properties | ||||||
|---|---|---|---|---|---|---|---|
| Quadrant | DetID | PixID | Counts | Sigma | Mean | Median | Sigma |
| A | 0 | 8 | 88958 | 502.73 | 712 | 694 | 175.6 |
| A | 3 | 78 | 67370 | 379.77 | 712 | 694 | 175.6 |
| A | 12 | 115 | 23433 | 129.51 | 712 | 694 | 175.6 |
| B | 5 | 185 | 199672 | 1315.39 | 698 | 673 | 151.3 |
| B | 0 | 199 | 108700 | 714.06 | 698 | 673 | 151.3 |
| B | 9 | 254 | 76166 | 499.01 | 698 | 673 | 151.3 |
| C | 13 | 3 | 182003 | 965.53 | 684 | 677 | 187.8 |
| C | 9 | 38 | 160508 | 851.07 | 684 | 677 | 187.8 |
| C | 12 | 250 | 121469 | 643.2 | 684 | 677 | 187.8 |
| D | 10 | 181 | 643662 | 3271.2 | 689 | 659 | 196.6 |
| D | 11 | 129 | 283364 | 1438.23 | 689 | 659 | 196.6 |
| D | 5 | 173 | 52795 | 265.24 | 689 | 659 | 196.6 |
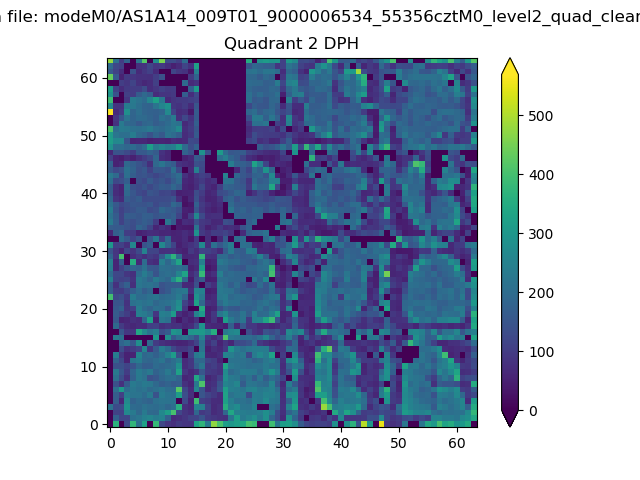
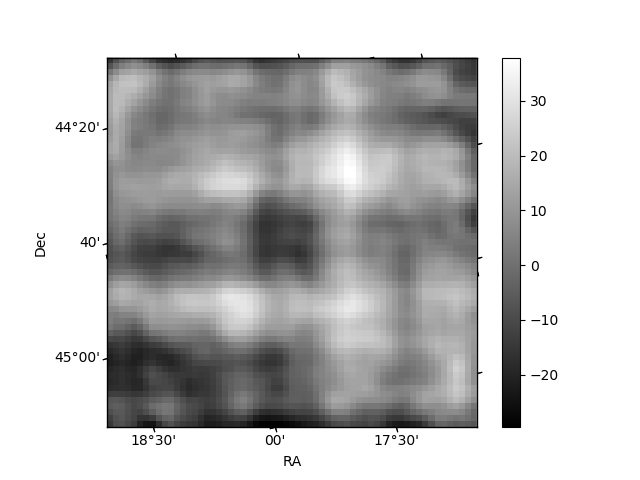
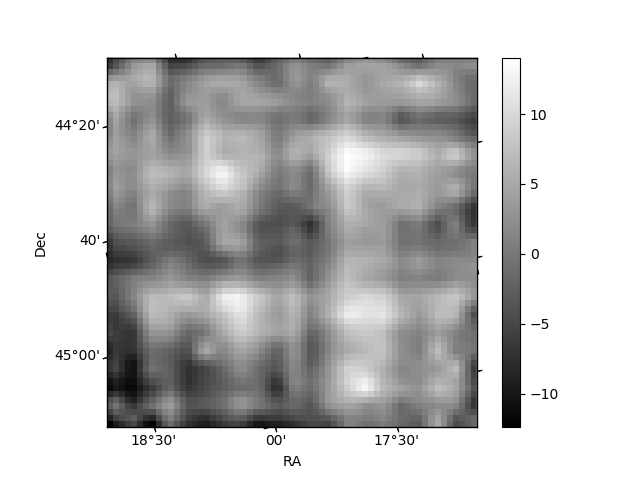
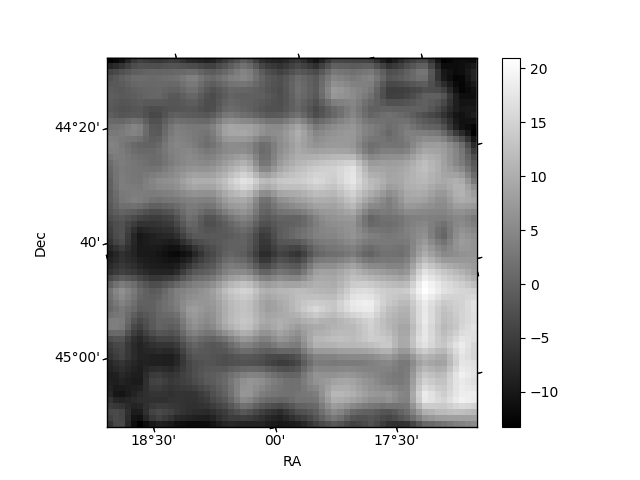
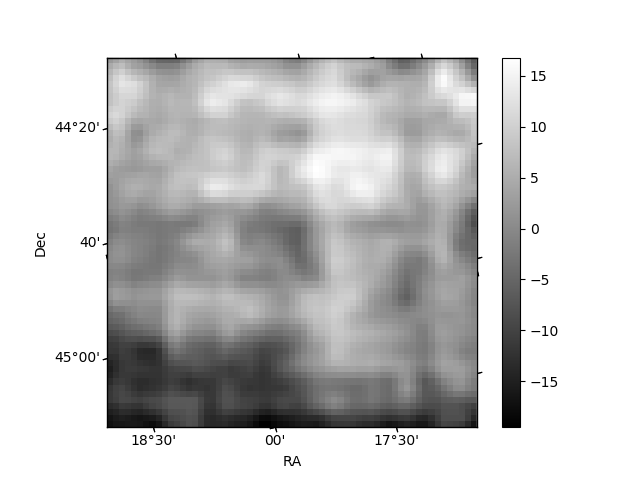
Histogram calculated using DETX and DETY for each event in the final _common_clean file
| Quadrant A | 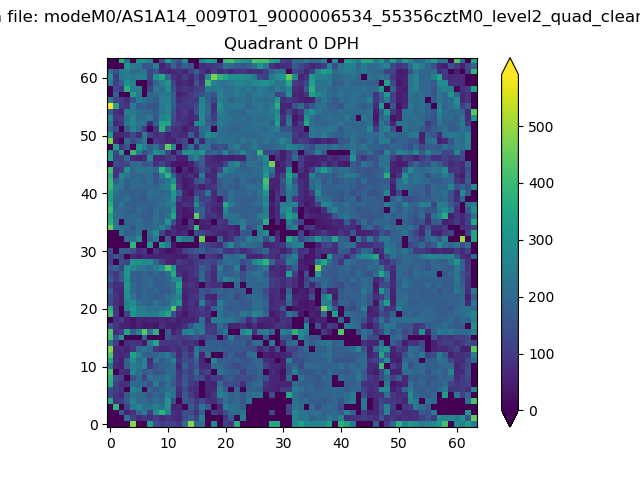 |
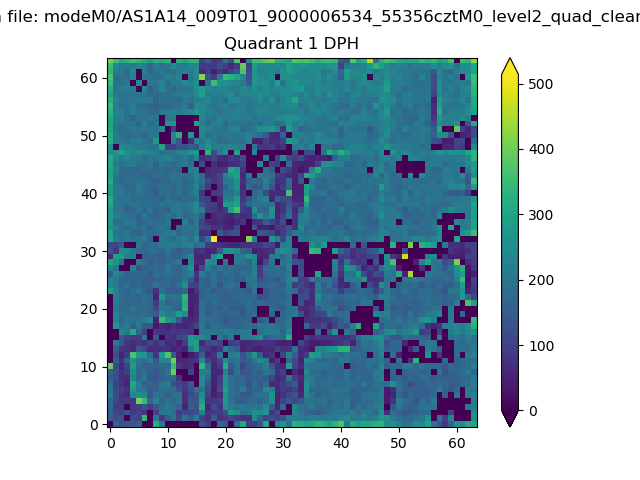 |
Quadrant B |
|---|---|---|---|
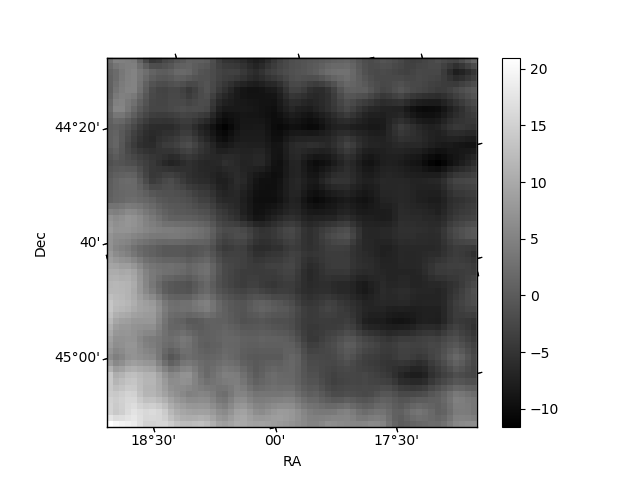
| Quadrant D | 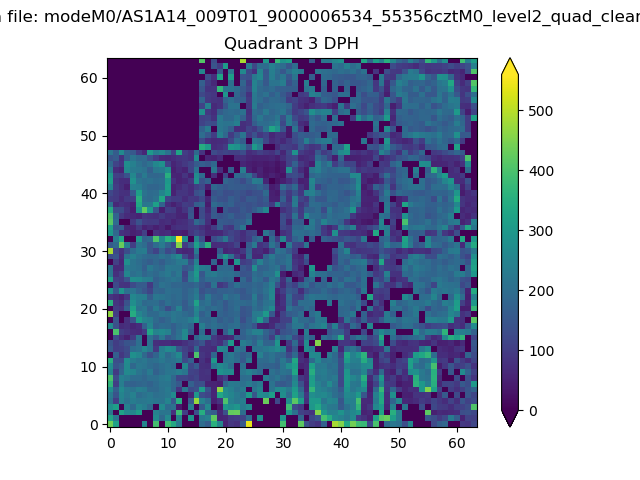 |
 |
Quadrant C |
| Plot type | Count rate plots | Images |
|---|---|---|
| Comparison with Poisson distribution Blue bars denote a histogram of data divided into 1 sec bins. Red curve is a Poisson curve with rate = median count rate of data. |
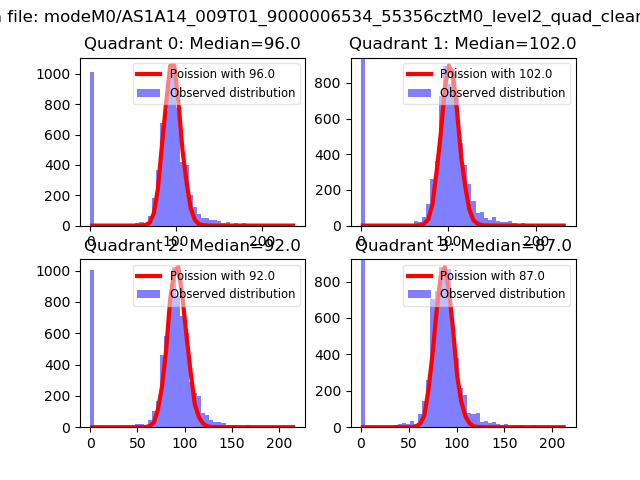 |
 |
| Quadrant-wise count rates Data is divided into 100 sec bins |
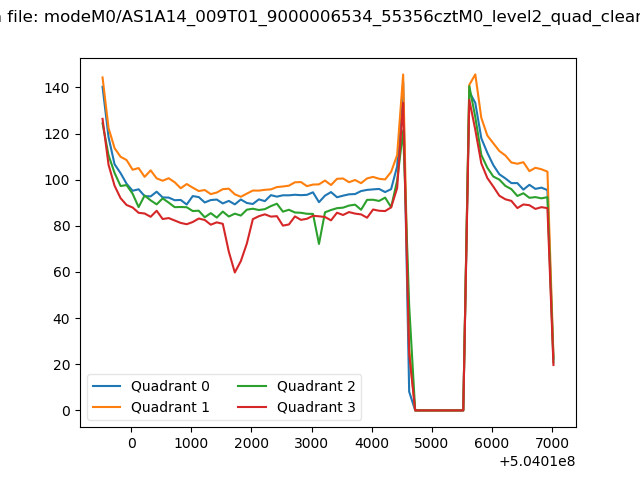 |
|
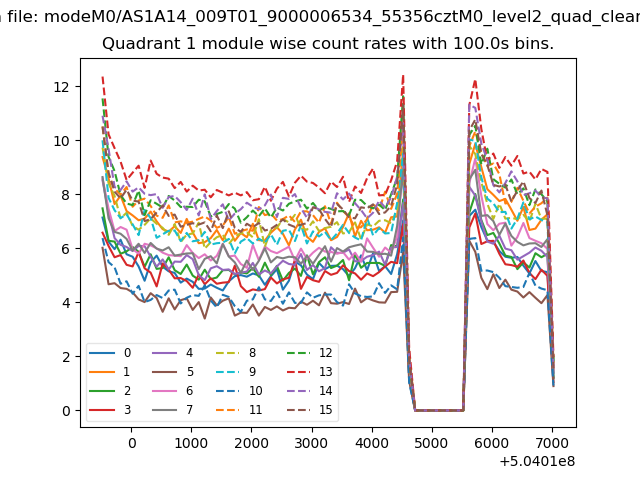
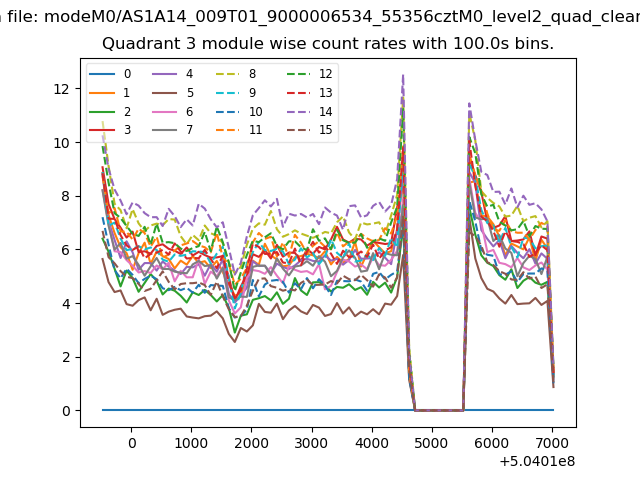
| Module-wise count rates for Quadrant A Data is divided into 100 sec bins |
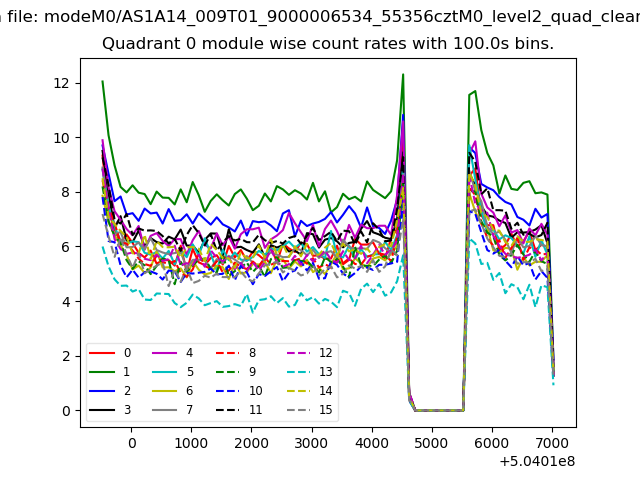 |
 |
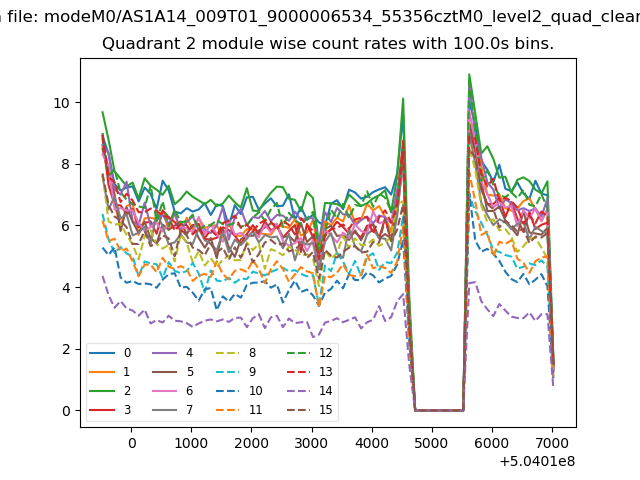
| Module-wise count rates for Quadrant B Data is divided into 100 sec bins |
 |
 |
| Module-wise count rates for Quadrant C Data is divided into 100 sec bins |
 |
 |
| Module-wise count rates for Quadrant D Data is divided into 100 sec bins |
 |
 |
| Parameter | Plot |
|---|---|
| CZT HV Monitor | 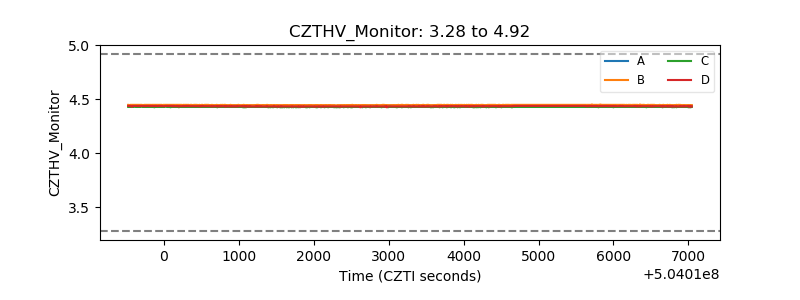 |
| D_VDD | 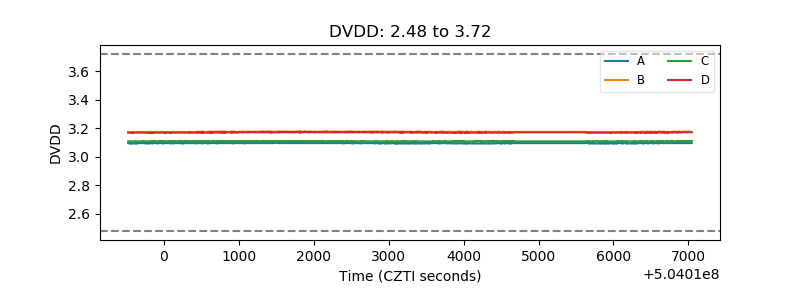 |
| Temperature 1 | 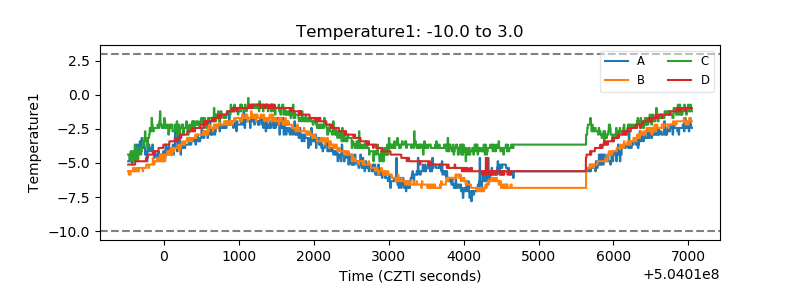 |
| Veto HV Monitor | 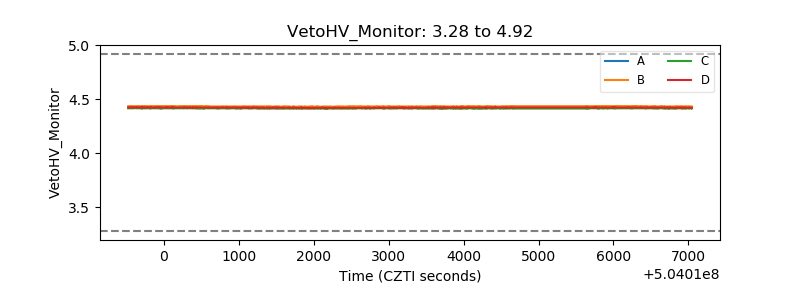 |
| Veto LLD | 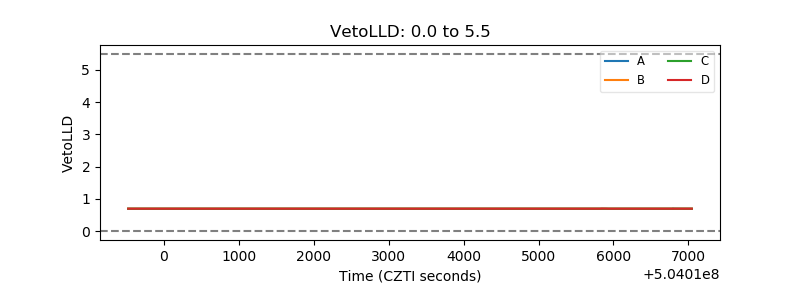 |
| Alpha Counter | 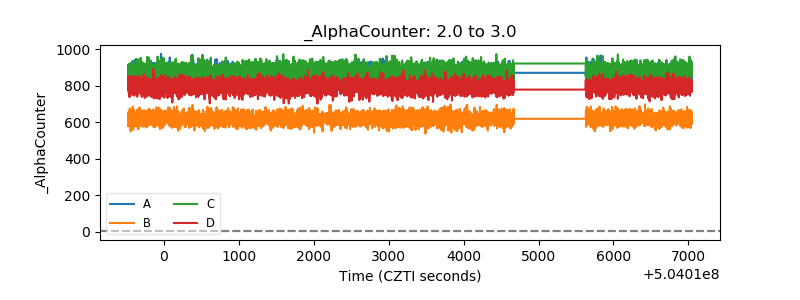 |
| _CPM_Rate | 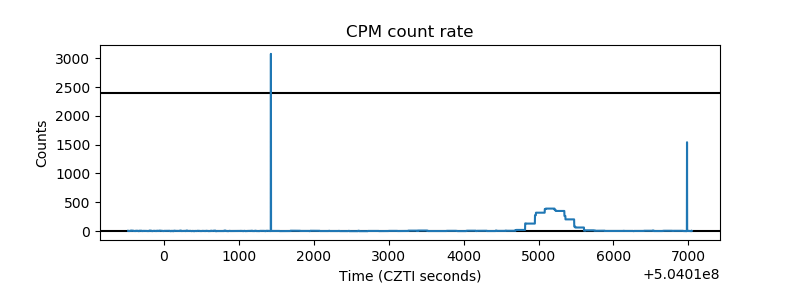 |
| CZT Counter | 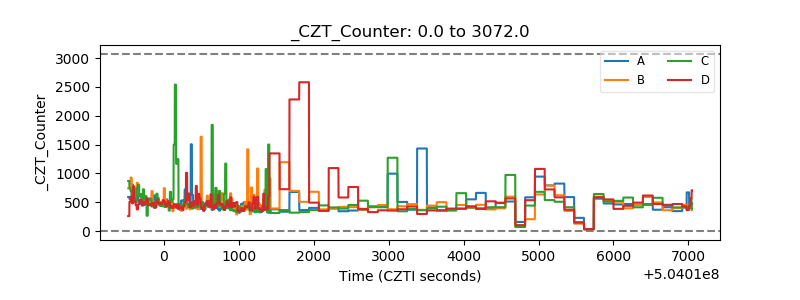 |
| +2.5 Volts monitor |  |
| +5 Volts monitor | 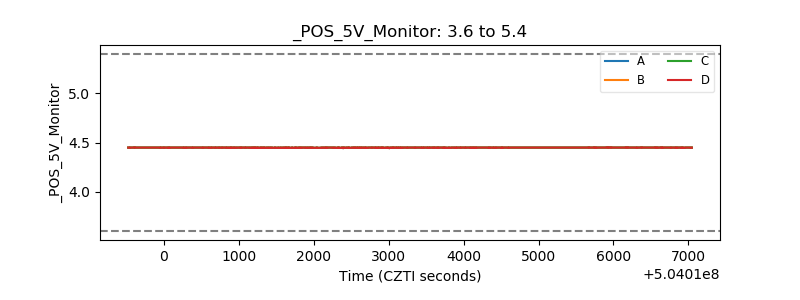 |
| _ROLL_ROT | 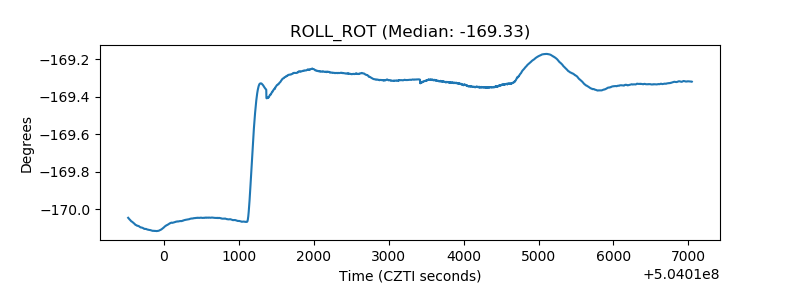 |
| _Roll_DEC | 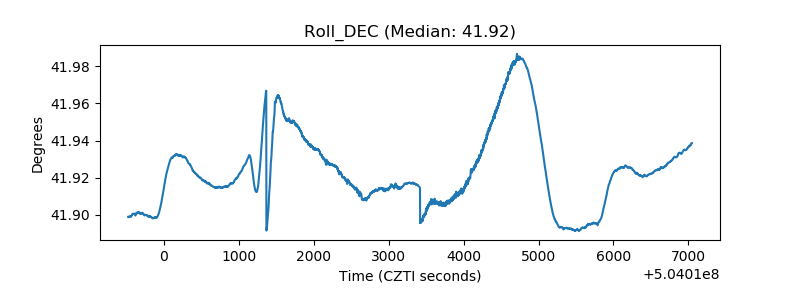 |
| _Roll_RA | 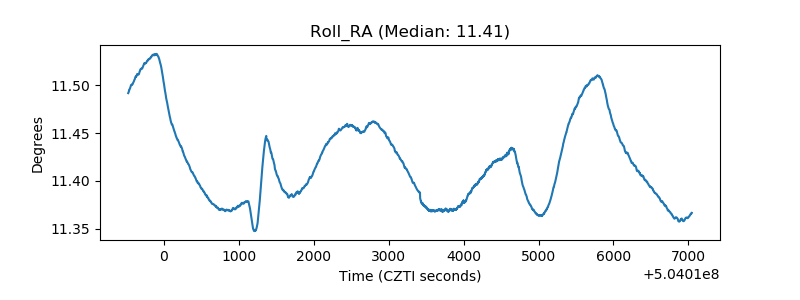 |
| Veto Counter | 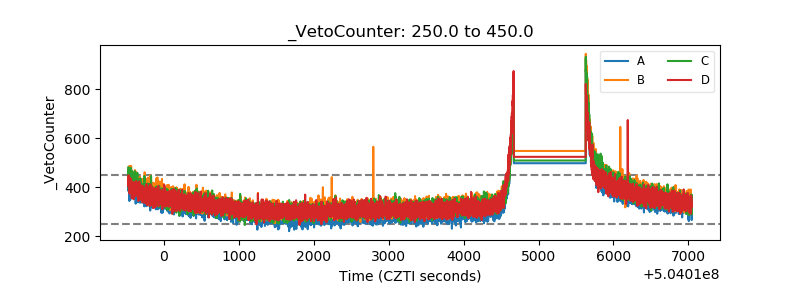 |