| Param | Original file | Final file |
|---|---|---|
| Filename | modeM0/AS1A14_009T01_9000006534_55357cztM0_level2.fits | modeM0/AS1A14_009T01_9000006534_55357cztM0_level2_quad_clean.evt |
| Size (bytes) | 349,776,000 | 92,390,400 |
| Size | 333.6 MB | 88.1 MB |
| Events in quadrant A | 2,774,565 | 607,260 |
| Events in quadrant B | 2,998,868 | 641,556 |
| Events in quadrant C | 2,844,787 | 576,885 |
| Events in quadrant D | 3,847,631 | 540,120 |
| Mode SS | |||
|---|---|---|---|
| Quadrant | BADHDUFLAG | Total packets | Discarded packets |
| A | 0 | 126 | 0 |
| B | 0 | 126 | 0 |
| C | 0 | 126 | 0 |
| D | 0 | 126 | 0 |
| Mode M0 | |||
|---|---|---|---|
| Quadrant | BADHDUFLAG | Total packets | Discarded packets |
| A | 0 | 12835 | 1 |
| B | 0 | 13465 | 1 |
| C | 0 | 13212 | 1 |
| D | 0 | 15758 | 2 |
| Mode M9 | |||
|---|---|---|---|
| Quadrant | BADHDUFLAG | Total packets | Discarded packets |
| A | 0 | 11 | 0 |
| B | 0 | 11 | 0 |
| C | 0 | 11 | 0 |
| D | 0 | 11 | 0 |
| Quadrant | Total seconds | Saturated seconds | Saturation percentage |
|---|---|---|---|
| A | 6183 | 44 | 0.711629% |
| B | 6184 | 99 | 1.600906% |
| C | 6184 | 30 | 0.485123% |
| D | 6183 | 152 | 2.458354% |
Noise dominated data is calculated using 1-second bins in cleaned event files. If a bin has >2000 counts, and if more than 50% of those come from <1% of pixels, then it is considered to be noise-dominated and hence unusable.
| Quadrant | # 1 sec bins | Bins with >0 counts | Bins with >2000 counts | High rate bins dominated by noise | Noise dominated (total time) | Noise dominated (detector-on time) | Marked lightcurve |
|---|---|---|---|---|---|---|---|
| A | 7293 | 6184 | 2 | 2 | 0.03% | 0.03% | 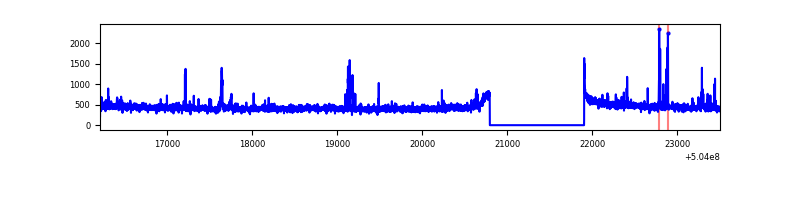 |
| B | 7294 | 6185 | 51 | 51 | 0.70% | 0.82% | 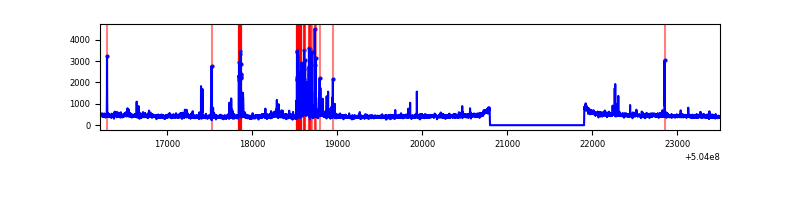 |
| C | 7294 | 6185 | 17 | 17 | 0.23% | 0.27% | 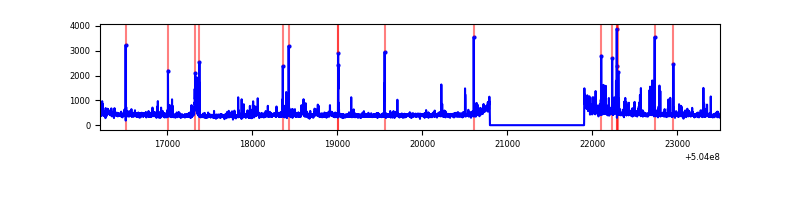 |
| D | 7293 | 6184 | 112 | 112 | 1.54% | 1.81% | 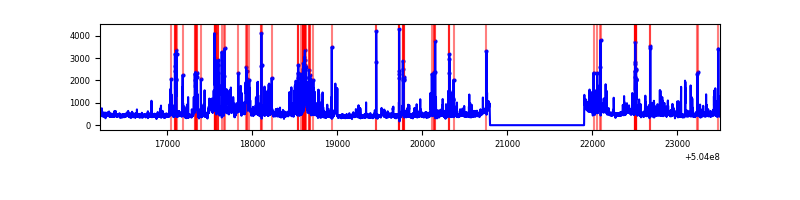 |
Top three noisy pixels from each quadrant. If the there are fewer than three noisy pixels in the level2.evt file, extra rows are filled as -1
| Pixel properties | Quadrant properties | ||||||
|---|---|---|---|---|---|---|---|
| Quadrant | DetID | PixID | Counts | Sigma | Mean | Median | Sigma |
| A | 0 | 8 | 72012 | 436.51 | 659 | 641 | 163.5 |
| A | 3 | 14 | 50045 | 302.16 | 659 | 641 | 163.5 |
| A | 5 | 242 | 30187 | 180.71 | 659 | 641 | 163.5 |
| B | 5 | 185 | 318975 | 2293.14 | 644 | 620 | 138.8 |
| B | 0 | 199 | 61138 | 435.92 | 644 | 620 | 138.8 |
| B | 10 | 247 | 22610 | 158.4 | 644 | 620 | 138.8 |
| C | 13 | 3 | 131052 | 745.02 | 635 | 627 | 175.1 |
| C | 12 | 252 | 64066 | 362.38 | 635 | 627 | 175.1 |
| C | 12 | 249 | 43602 | 245.48 | 635 | 627 | 175.1 |
| D | 11 | 129 | 993982 | 5500.19 | 636 | 610 | 180.6 |
| D | 10 | 181 | 189446 | 1045.56 | 636 | 610 | 180.6 |
| D | 11 | 224 | 70669 | 387.91 | 636 | 610 | 180.6 |
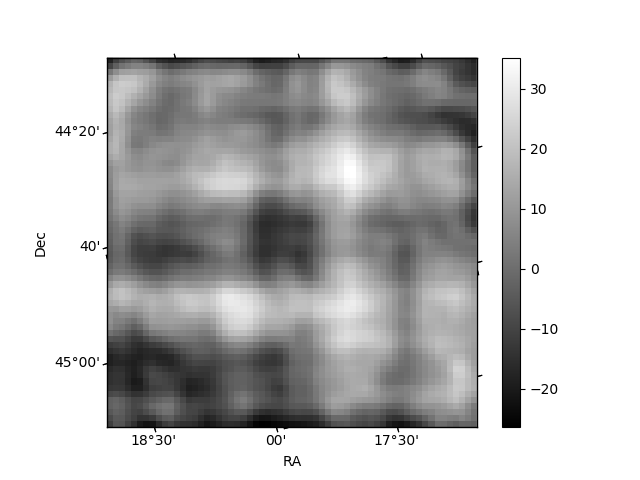
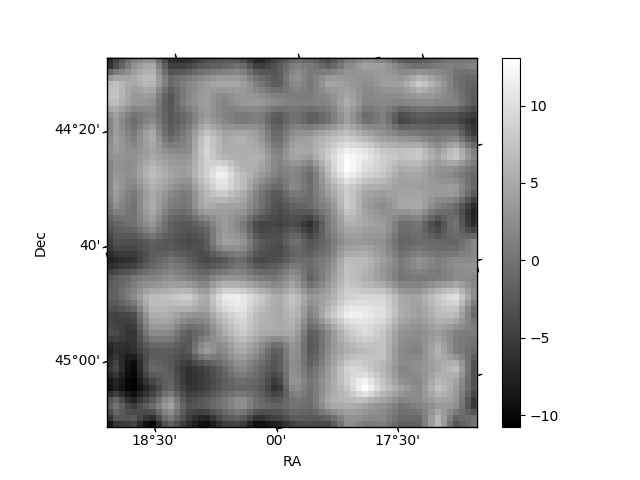
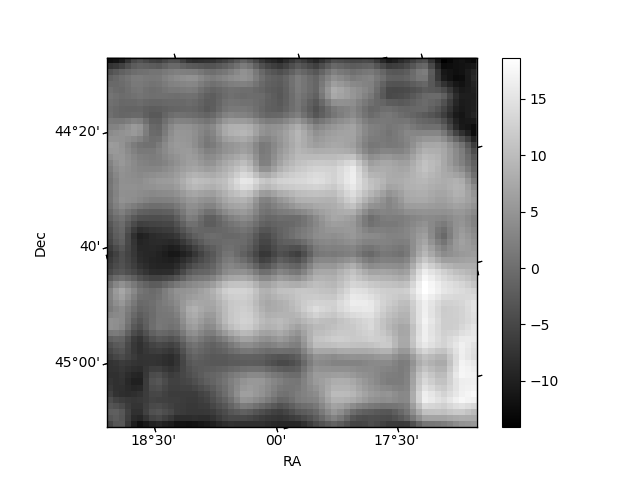
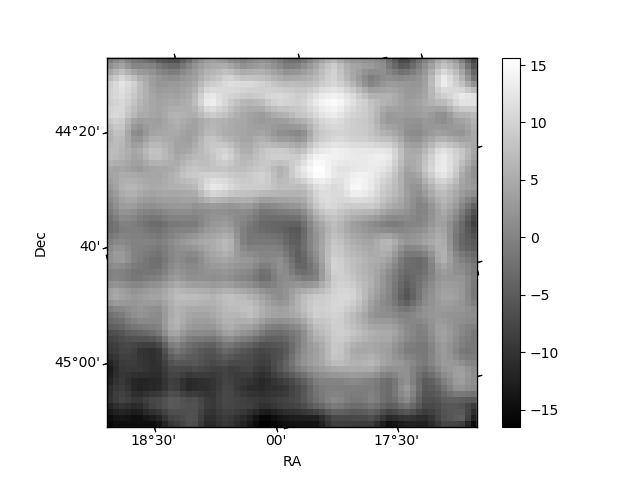
Histogram calculated using DETX and DETY for each event in the final _common_clean file
| Quadrant A | 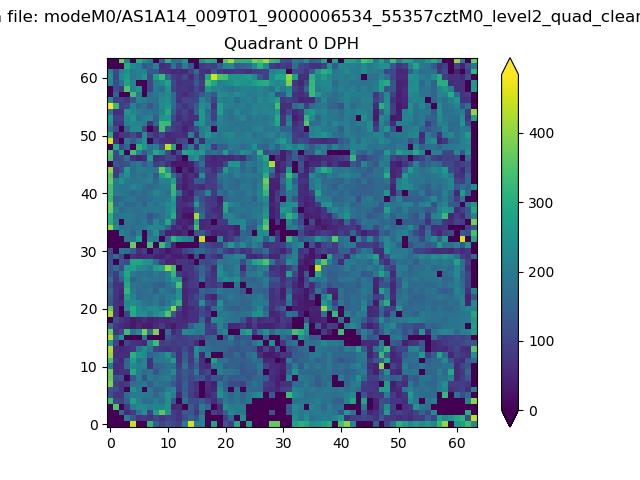 |
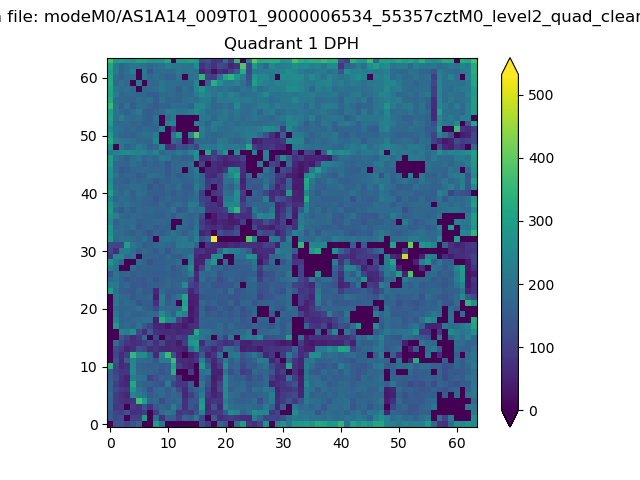 |
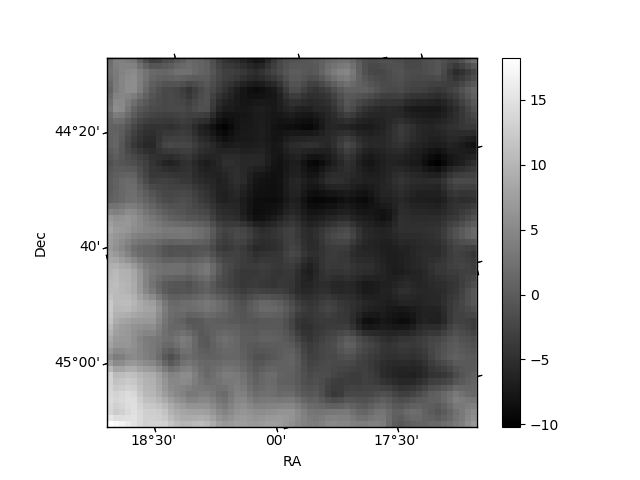
Quadrant B |
|---|---|---|---|
| Quadrant D | 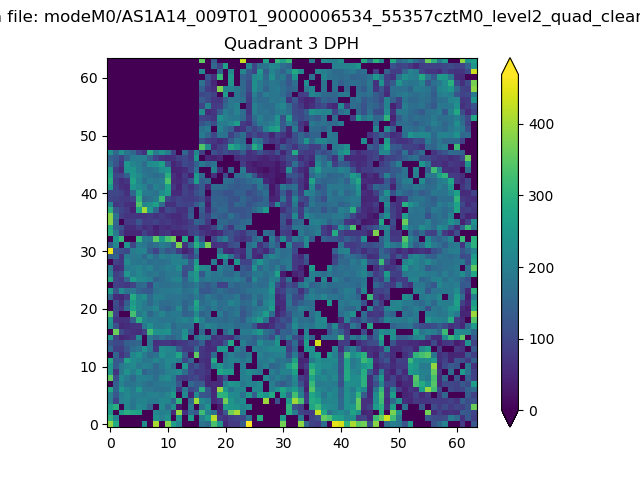 |
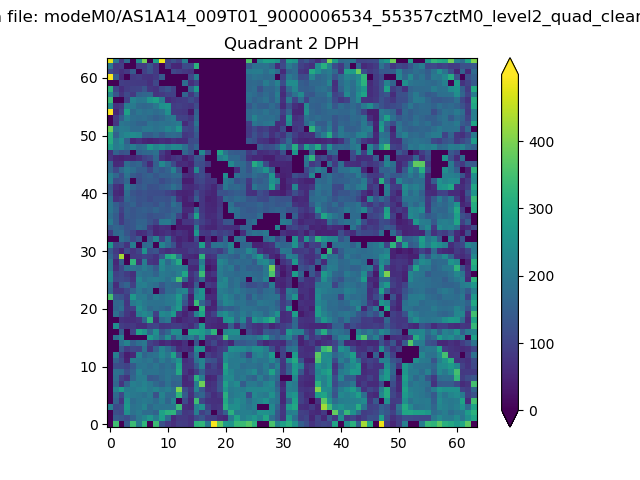 |
Quadrant C |
| Plot type | Count rate plots | Images |
|---|---|---|
| Comparison with Poisson distribution Blue bars denote a histogram of data divided into 1 sec bins. Red curve is a Poisson curve with rate = median count rate of data. |
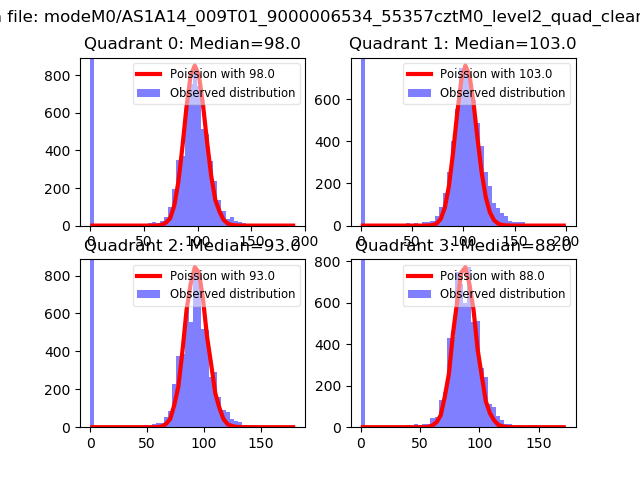 |
 |
| Quadrant-wise count rates Data is divided into 100 sec bins |
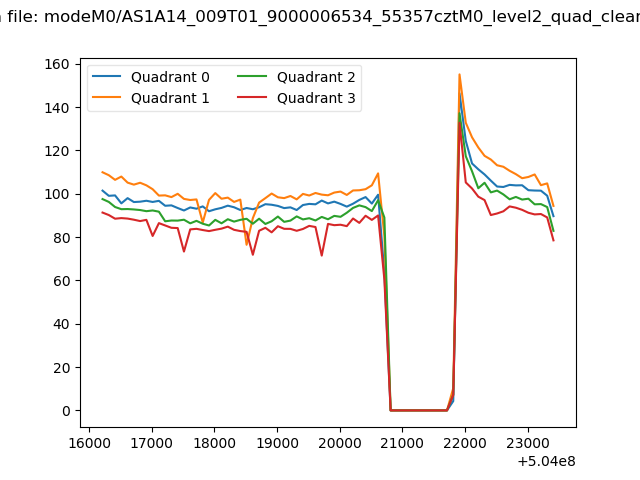 |
|
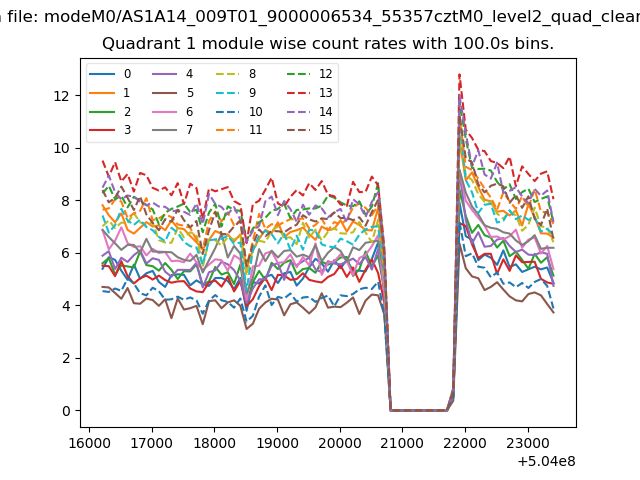
| Module-wise count rates for Quadrant A Data is divided into 100 sec bins |
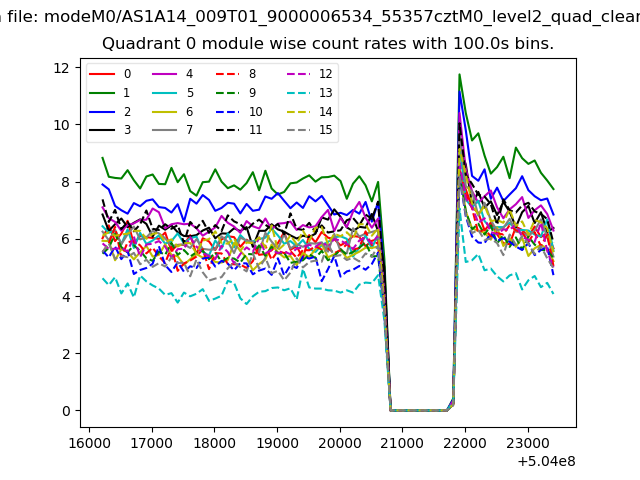 |
 |
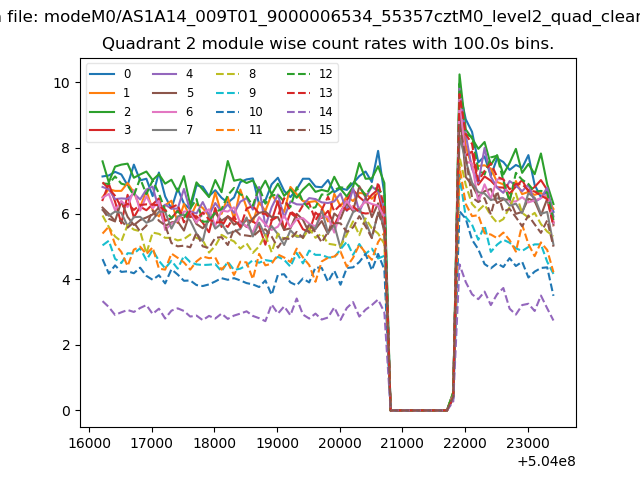
| Module-wise count rates for Quadrant B Data is divided into 100 sec bins |
 |
 |
| Module-wise count rates for Quadrant C Data is divided into 100 sec bins |
 |
 |
| Module-wise count rates for Quadrant D Data is divided into 100 sec bins |
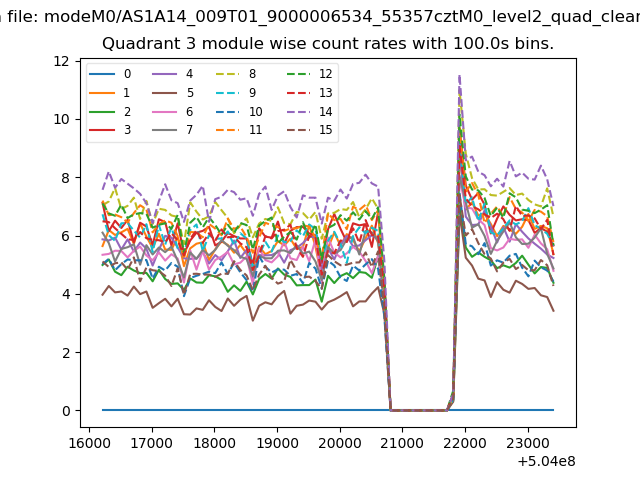 |
 |
| Parameter | Plot |
|---|---|
| CZT HV Monitor | 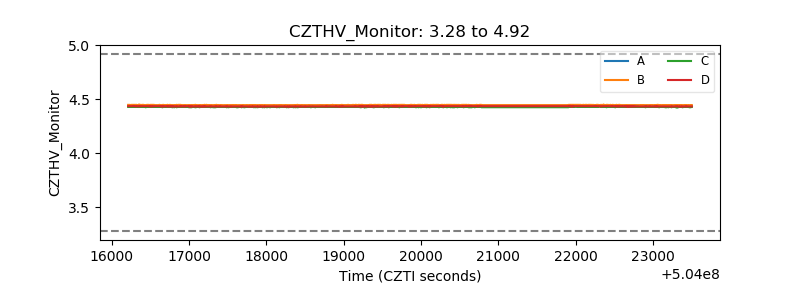 |
| D_VDD | 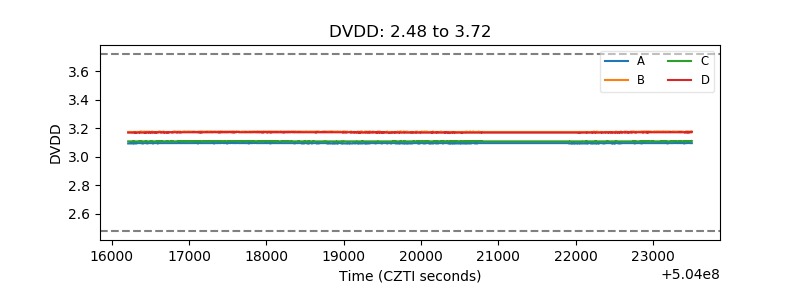 |
| Temperature 1 | 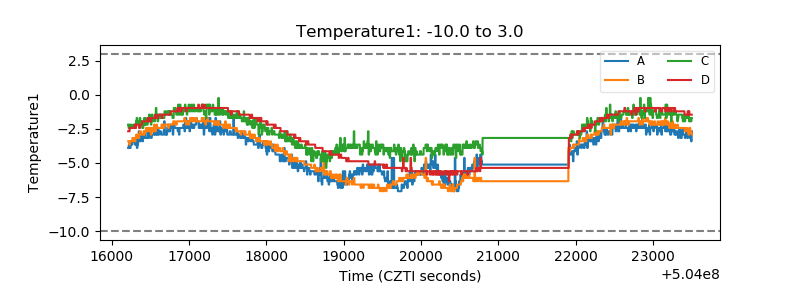 |
| Veto HV Monitor |  |
| Veto LLD | 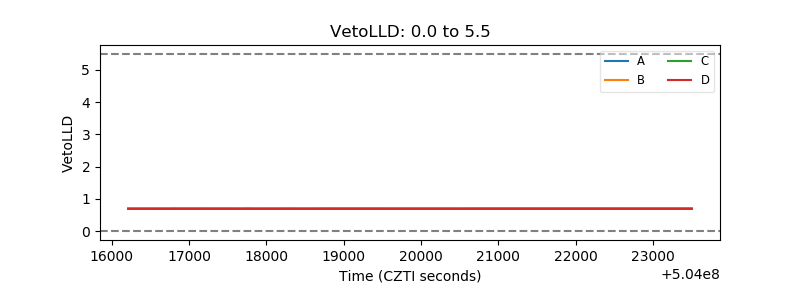 |
| Alpha Counter | 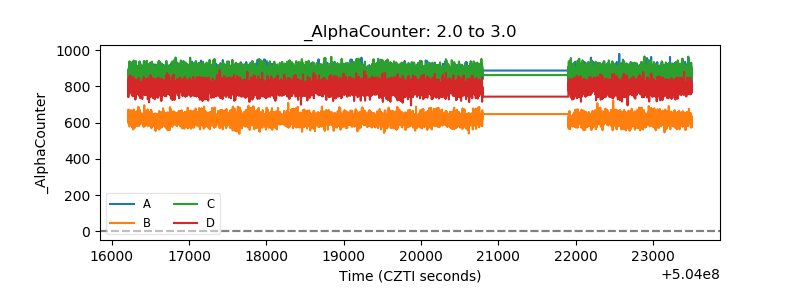 |
| _CPM_Rate | 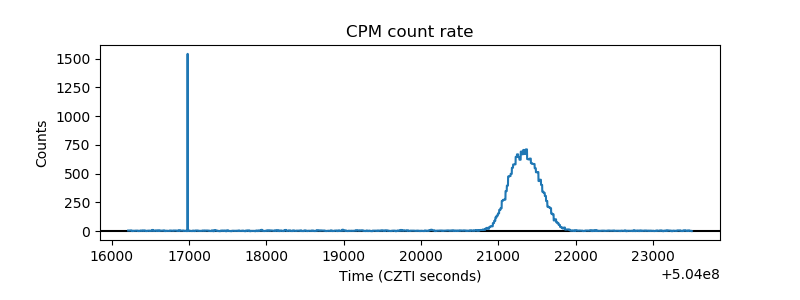 |
| CZT Counter | 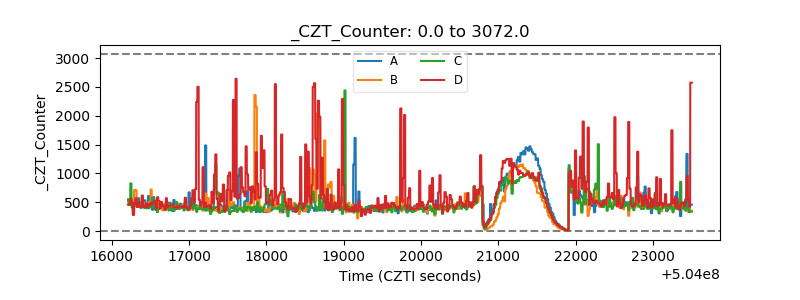 |
| +2.5 Volts monitor | 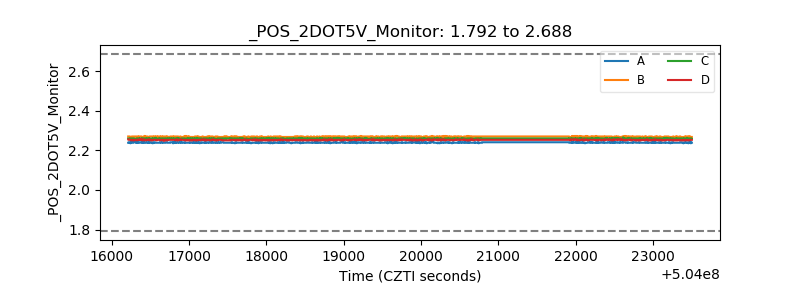 |
| +5 Volts monitor | 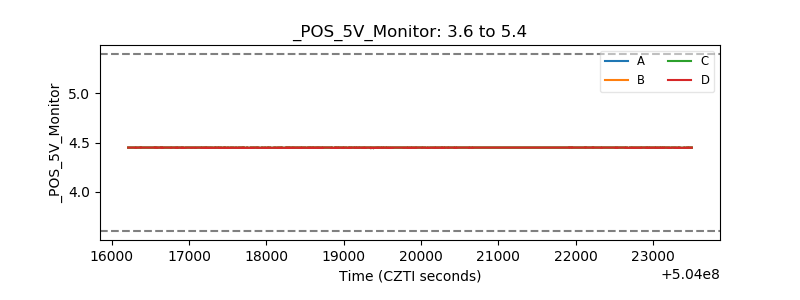 |
| _ROLL_ROT | 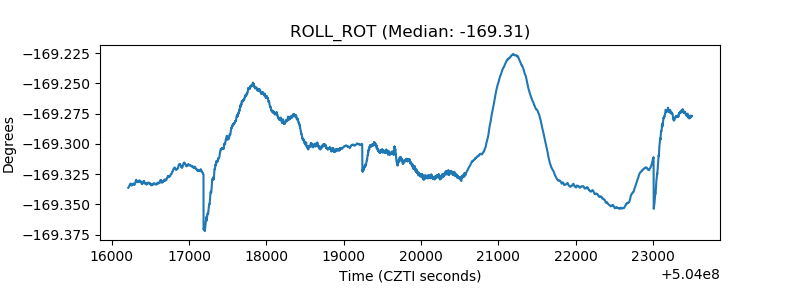 |
| _Roll_DEC | 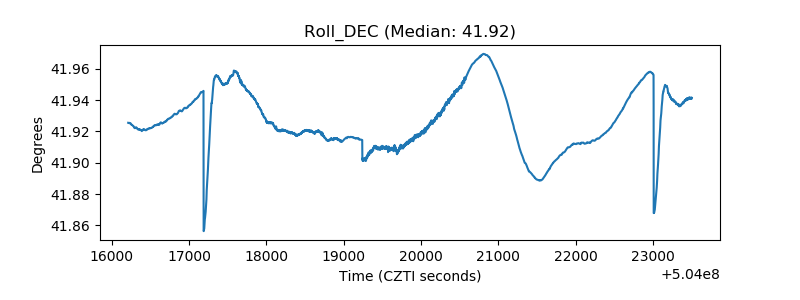 |
| _Roll_RA | 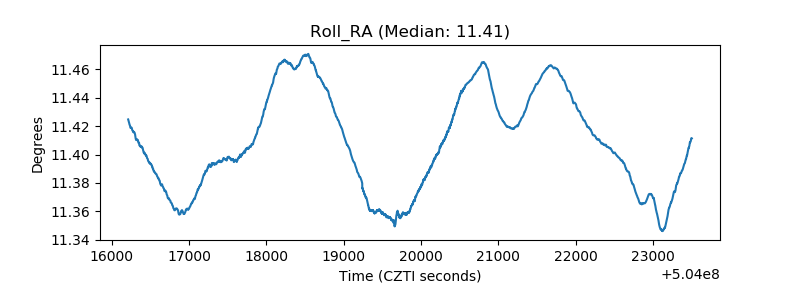 |
| Veto Counter | 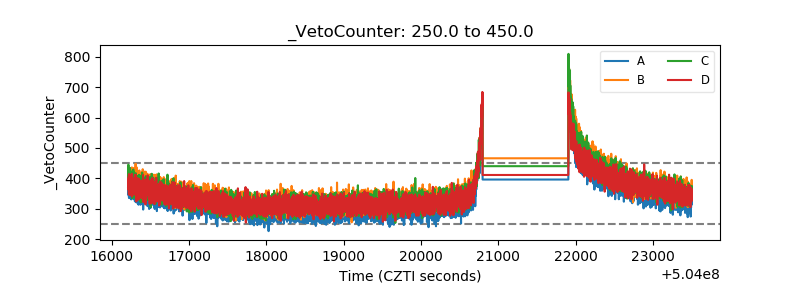 |