| Param | Original file | Final file |
|---|---|---|
| Filename | modeM0/AS1A14_009T01_9000006534_55358cztM0_level2.fits | modeM0/AS1A14_009T01_9000006534_55358cztM0_level2_quad_clean.evt |
| Size (bytes) | 383,656,320 | 101,805,120 |
| Size | 365.9 MB | 97.1 MB |
| Events in quadrant A | 3,108,958 | 668,197 |
| Events in quadrant B | 3,123,517 | 712,198 |
| Events in quadrant C | 3,508,124 | 639,008 |
| Events in quadrant D | 3,948,247 | 604,121 |
| Mode SS | |||
|---|---|---|---|
| Quadrant | BADHDUFLAG | Total packets | Discarded packets |
| A | 0 | 132 | 0 |
| B | 0 | 132 | 0 |
| C | 0 | 132 | 0 |
| D | 0 | 132 | 0 |
| Mode M0 | |||
|---|---|---|---|
| Quadrant | BADHDUFLAG | Total packets | Discarded packets |
| A | 0 | 14055 | 2 |
| B | 0 | 14034 | 2 |
| C | 0 | 15122 | 2 |
| D | 0 | 16311 | 2 |
| Mode M9 | |||
|---|---|---|---|
| Quadrant | BADHDUFLAG | Total packets | Discarded packets |
| A | 0 | 12 | 0 |
| B | 0 | 12 | 0 |
| C | 0 | 13 | 0 |
| D | 0 | 13 | 0 |
| Quadrant | Total seconds | Saturated seconds | Saturation percentage |
|---|---|---|---|
| A | 6593 | 77 | 1.167905% |
| B | 6593 | 68 | 1.031397% |
| C | 6592 | 63 | 0.955704% |
| D | 6592 | 114 | 1.729369% |
Noise dominated data is calculated using 1-second bins in cleaned event files. If a bin has >2000 counts, and if more than 50% of those come from <1% of pixels, then it is considered to be noise-dominated and hence unusable.
| Quadrant | # 1 sec bins | Bins with >0 counts | Bins with >2000 counts | High rate bins dominated by noise | Noise dominated (total time) | Noise dominated (detector-on time) | Marked lightcurve |
|---|---|---|---|---|---|---|---|
| A | 7753 | 6594 | 16 | 16 | 0.21% | 0.24% | 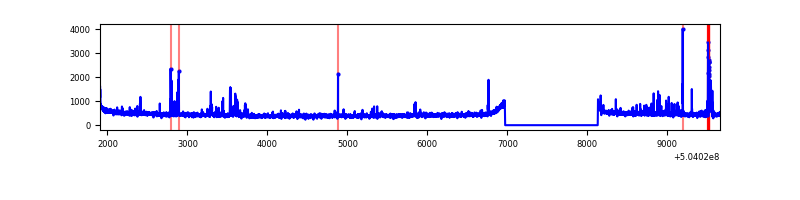 |
| B | 7753 | 6594 | 3 | 3 | 0.04% | 0.05% | 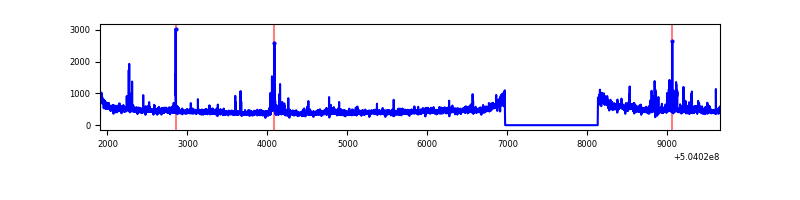 |
| C | 7752 | 6593 | 21 | 21 | 0.27% | 0.32% | 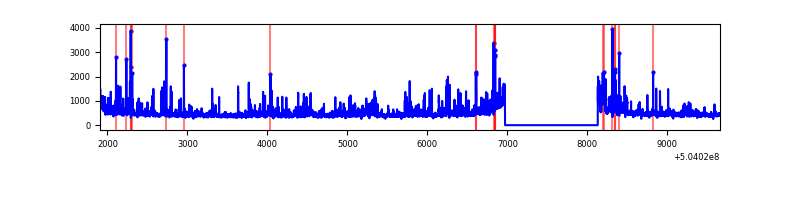 |
| D | 7752 | 6593 | 73 | 73 | 0.94% | 1.11% | 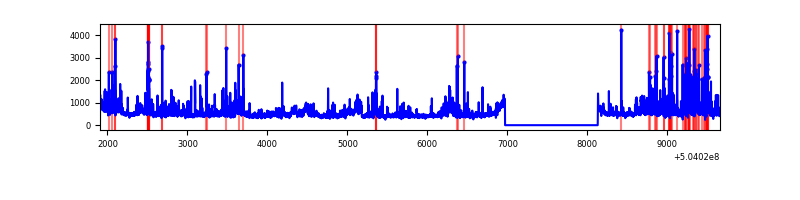 |
Top three noisy pixels from each quadrant. If the there are fewer than three noisy pixels in the level2.evt file, extra rows are filled as -1
| Pixel properties | Quadrant properties | ||||||
|---|---|---|---|---|---|---|---|
| Quadrant | DetID | PixID | Counts | Sigma | Mean | Median | Sigma |
| A | 0 | 8 | 100708 | 560.67 | 725 | 706 | 178.4 |
| A | 4 | 249 | 78252 | 434.77 | 725 | 706 | 178.4 |
| A | 6 | 161 | 31739 | 173.99 | 725 | 706 | 178.4 |
| B | 9 | 254 | 109511 | 710.65 | 712 | 685 | 153.1 |
| B | 0 | 199 | 84371 | 546.48 | 712 | 685 | 153.1 |
| B | 5 | 185 | 63041 | 407.19 | 712 | 685 | 153.1 |
| C | 12 | 252 | 321805 | 1660.3 | 702 | 694 | 193.4 |
| C | 9 | 38 | 147964 | 761.46 | 702 | 694 | 193.4 |
| C | 13 | 3 | 84606 | 433.87 | 702 | 694 | 193.4 |
| D | 11 | 129 | 841951 | 4271.26 | 705 | 673 | 197.0 |
| D | 10 | 181 | 175732 | 888.79 | 705 | 673 | 197.0 |
| D | 5 | 173 | 50815 | 254.58 | 705 | 673 | 197.0 |
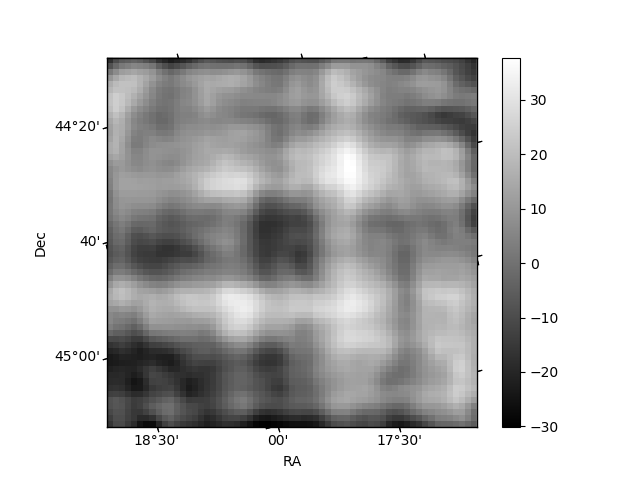
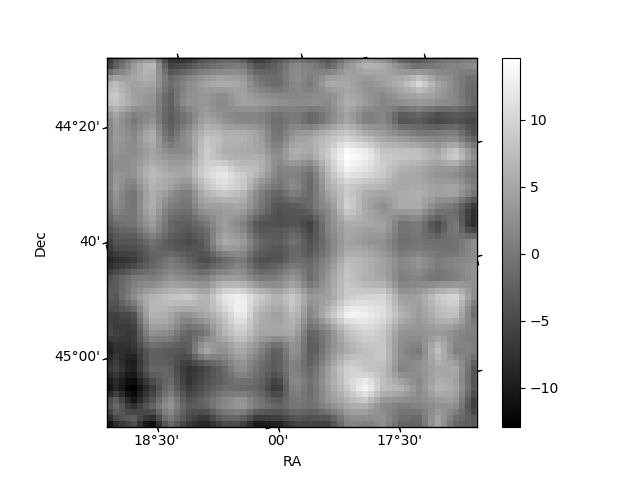
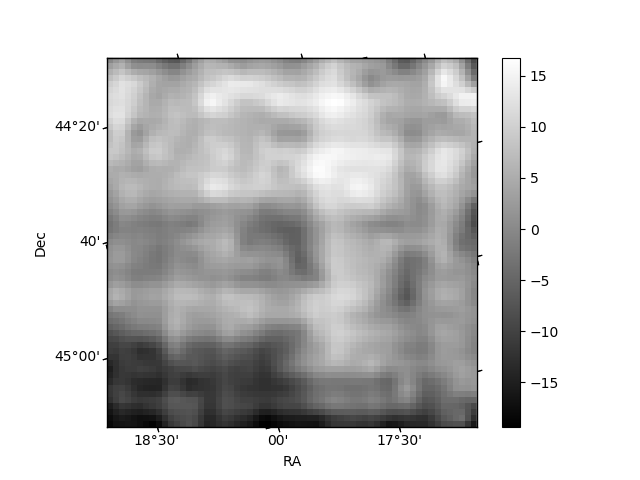
Histogram calculated using DETX and DETY for each event in the final _common_clean file
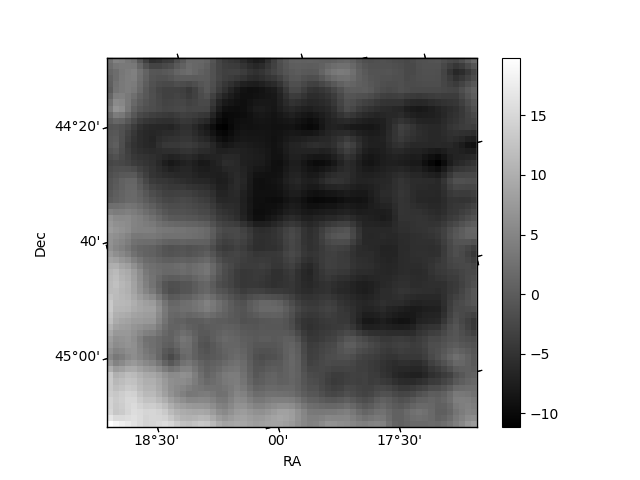
| Quadrant A | 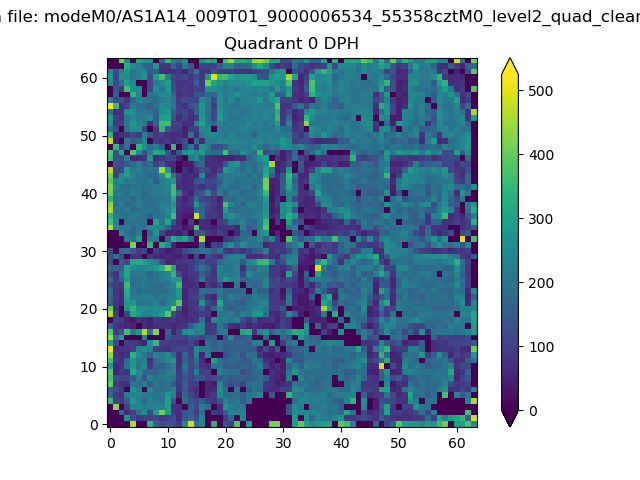 |
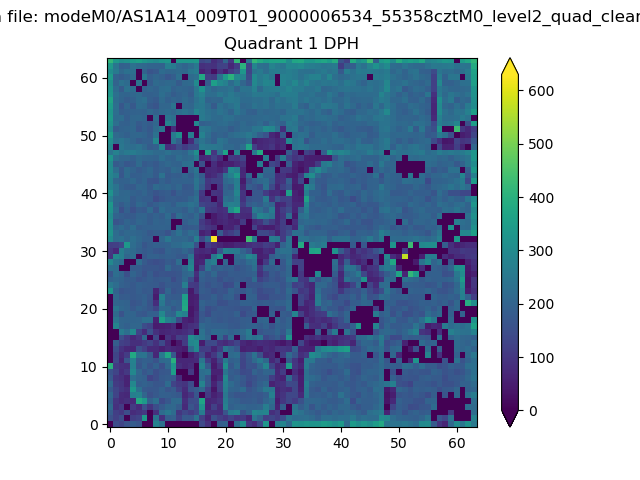 |
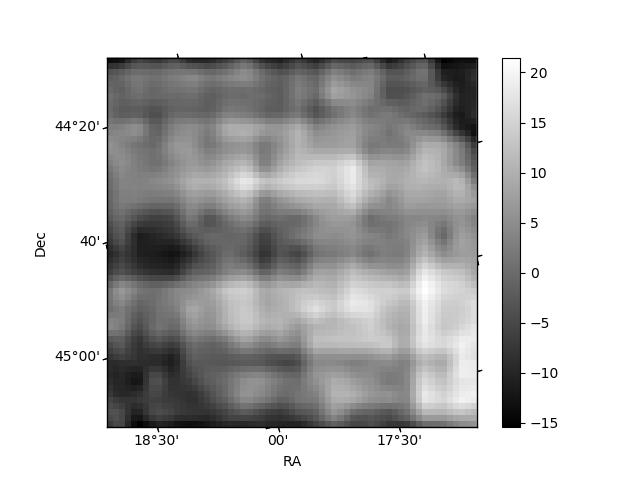
Quadrant B |
|---|---|---|---|
| Quadrant D | 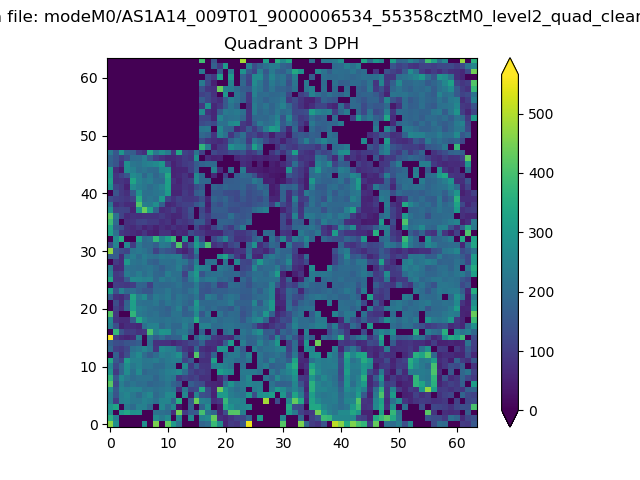 |
 |
Quadrant C |
| Plot type | Count rate plots | Images |
|---|---|---|
| Comparison with Poisson distribution Blue bars denote a histogram of data divided into 1 sec bins. Red curve is a Poisson curve with rate = median count rate of data. |
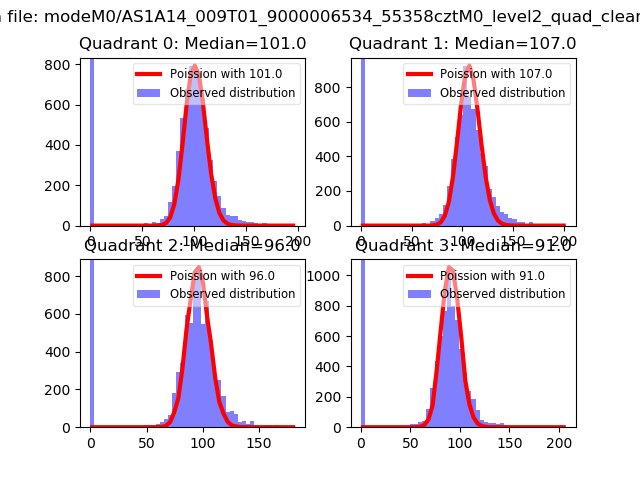 |
 |
| Quadrant-wise count rates Data is divided into 100 sec bins |
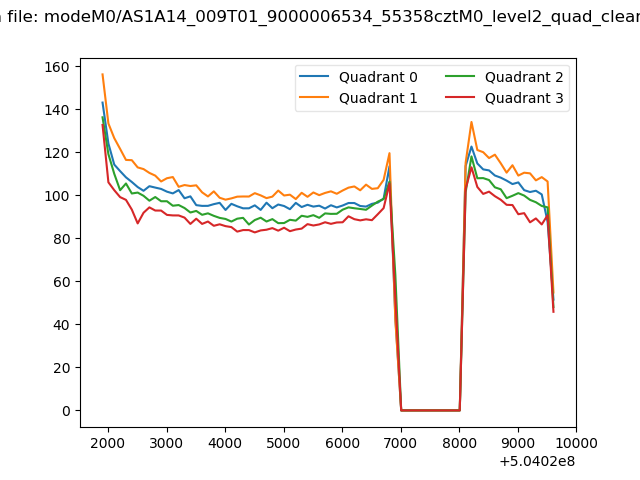 |
|
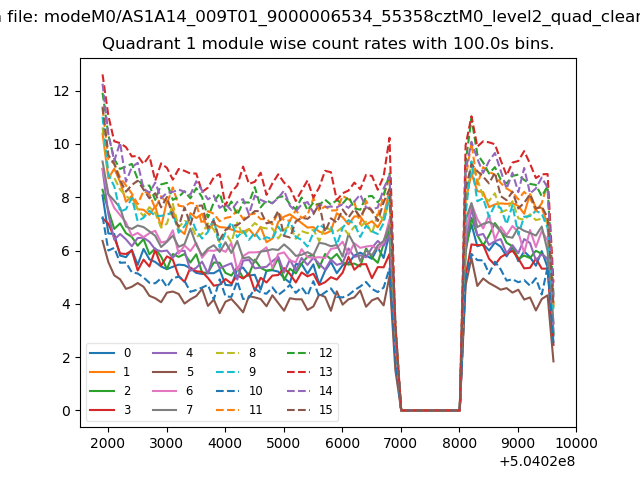
| Module-wise count rates for Quadrant A Data is divided into 100 sec bins |
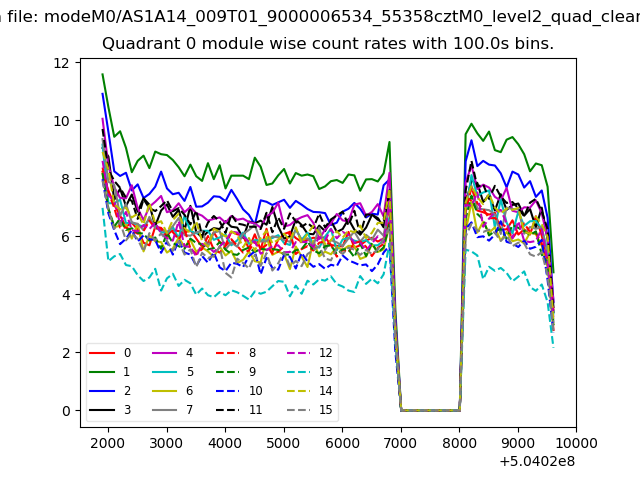 |
 |
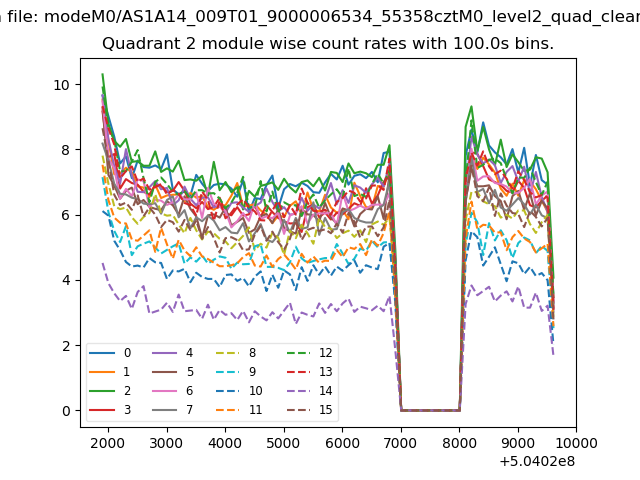
| Module-wise count rates for Quadrant B Data is divided into 100 sec bins |
 |
 |
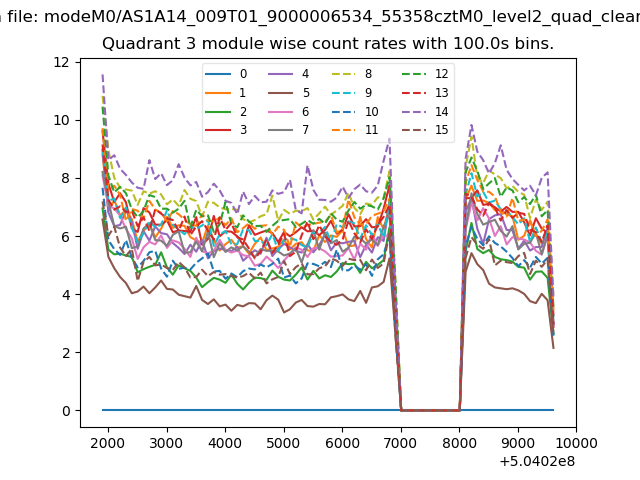
| Module-wise count rates for Quadrant C Data is divided into 100 sec bins |
 |
 |
| Module-wise count rates for Quadrant D Data is divided into 100 sec bins |
 |
 |
| Parameter | Plot |
|---|---|
| CZT HV Monitor | 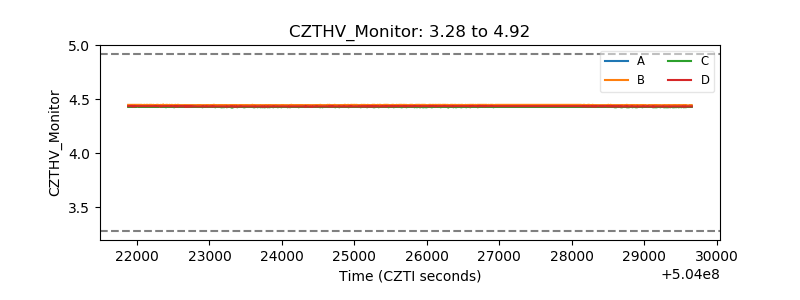 |
| D_VDD | 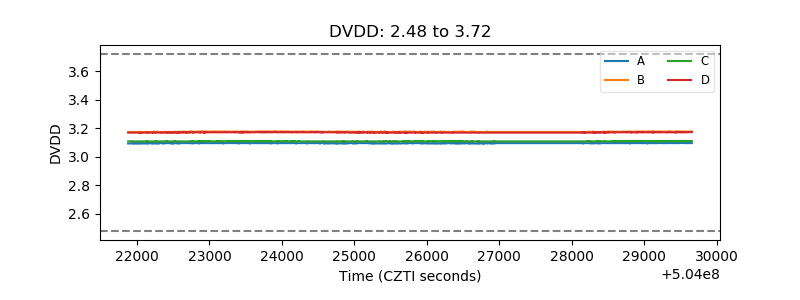 |
| Temperature 1 | 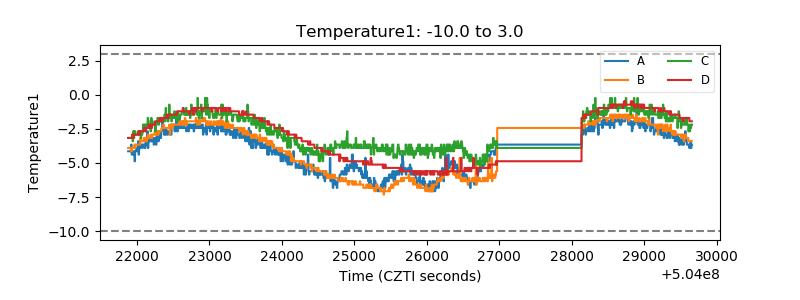 |
| Veto HV Monitor | 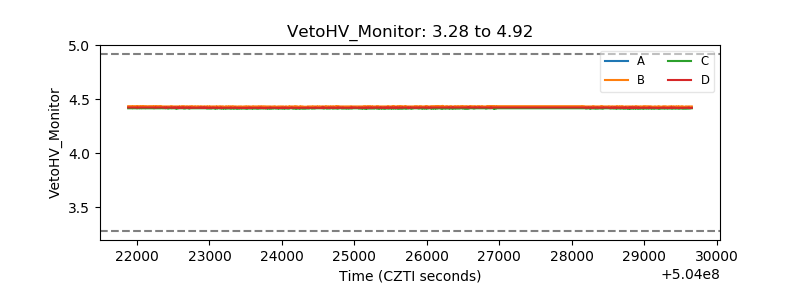 |
| Veto LLD | 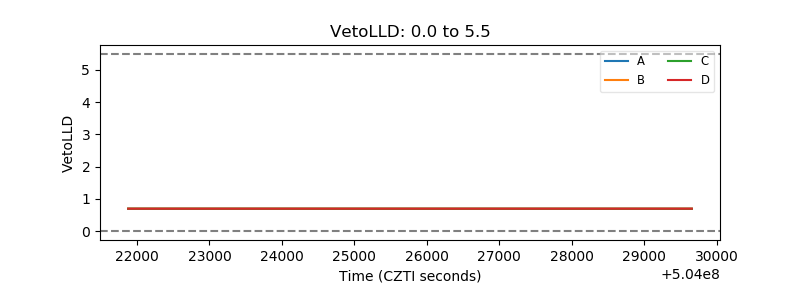 |
| Alpha Counter | 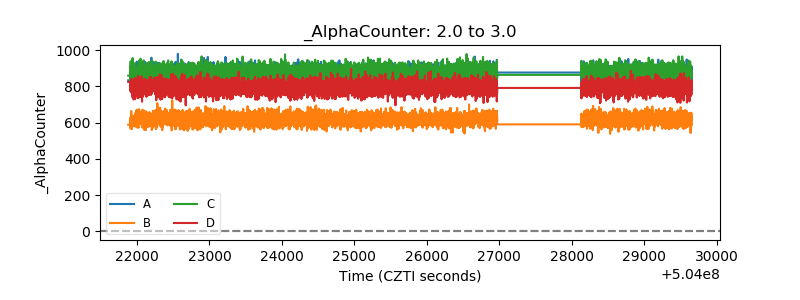 |
| _CPM_Rate | 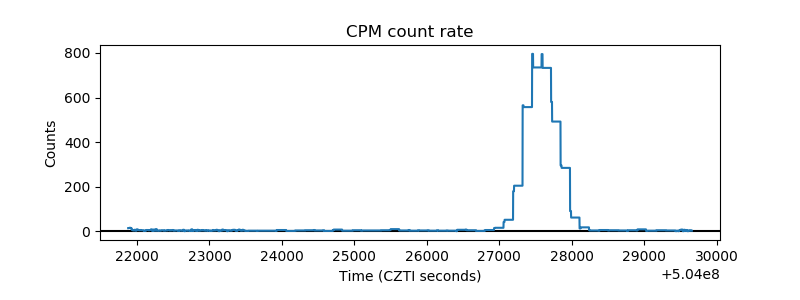 |
| CZT Counter | 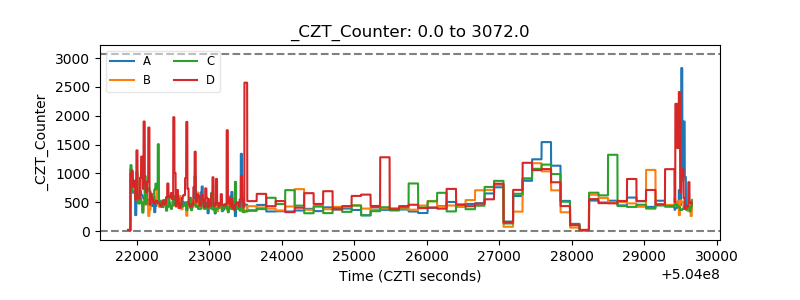 |
| +2.5 Volts monitor |  |
| +5 Volts monitor | 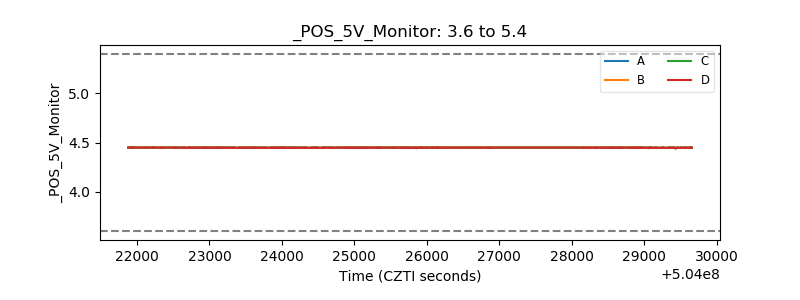 |
| _ROLL_ROT | 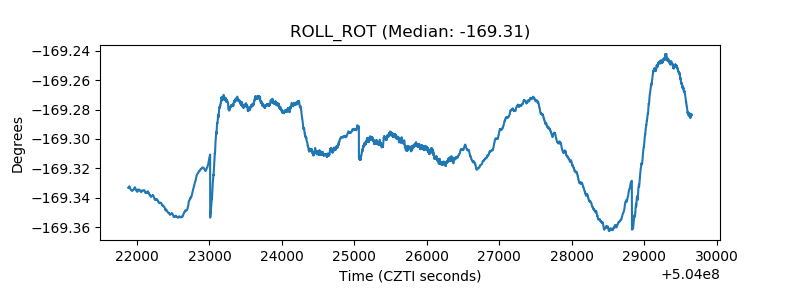 |
| _Roll_DEC | 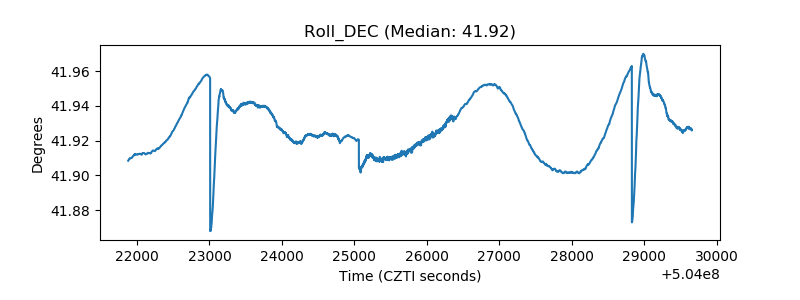 |
| _Roll_RA | 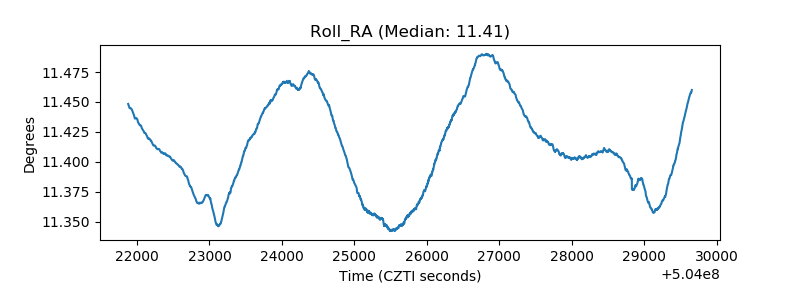 |
| Veto Counter | 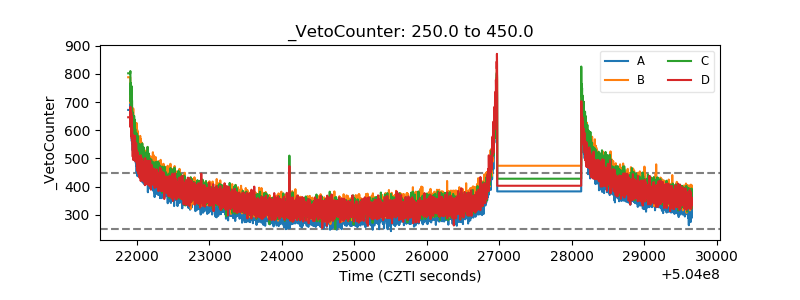 |