| Param | Original file | Final file |
|---|---|---|
| Filename | modeM0/AS1A14_009T01_9000006534_55360cztM0_level2.fits | modeM0/AS1A14_009T01_9000006534_55360cztM0_level2_quad_clean.evt |
| Size (bytes) | 381,116,160 | 94,947,840 |
| Size | 363.5 MB | 90.5 MB |
| Events in quadrant A | 2,957,991 | 620,119 |
| Events in quadrant B | 3,100,429 | 663,820 |
| Events in quadrant C | 3,552,169 | 588,445 |
| Events in quadrant D | 3,999,652 | 556,526 |
| Mode SS | |||
|---|---|---|---|
| Quadrant | BADHDUFLAG | Total packets | Discarded packets |
| A | 0 | 132 | 0 |
| B | 0 | 132 | 0 |
| C | 0 | 132 | 2 |
| D | 0 | 132 | 2 |
| Mode M0 | |||
|---|---|---|---|
| Quadrant | BADHDUFLAG | Total packets | Discarded packets |
| A | 0 | 13709 | 120 |
| B | 0 | 13906 | 156 |
| C | 0 | 15472 | 434 |
| D | 0 | 16648 | 140 |
| Mode M9 | |||
|---|---|---|---|
| Quadrant | BADHDUFLAG | Total packets | Discarded packets |
| A | 0 | 11 | 0 |
| B | 0 | 11 | 0 |
| C | 0 | 11 | 0 |
| D | 0 | 11 | 0 |
| Quadrant | Total seconds | Saturated seconds | Saturation percentage |
|---|---|---|---|
| A | 6398 | 29 | 0.453267% |
| B | 6399 | 58 | 0.906392% |
| C | 6365 | 70 | 1.099764% |
| D | 6399 | 161 | 2.516018% |
Noise dominated data is calculated using 1-second bins in cleaned event files. If a bin has >2000 counts, and if more than 50% of those come from <1% of pixels, then it is considered to be noise-dominated and hence unusable.
| Quadrant | # 1 sec bins | Bins with >0 counts | Bins with >2000 counts | High rate bins dominated by noise | Noise dominated (total time) | Noise dominated (detector-on time) | Marked lightcurve |
|---|---|---|---|---|---|---|---|
| A | 7571 | 6433 | 12 | 12 | 0.16% | 0.19% | 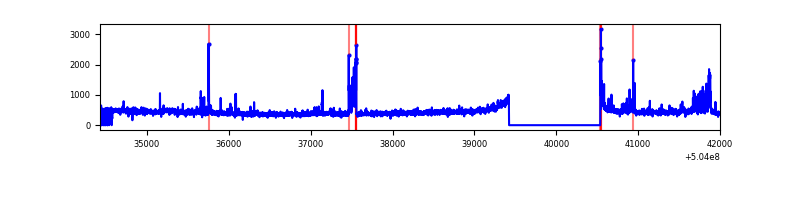 |
| B | 7571 | 6434 | 12 | 12 | 0.16% | 0.19% | 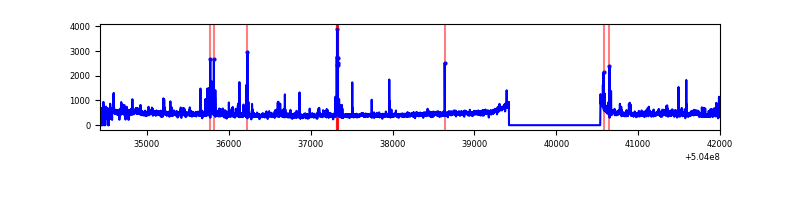 |
| C | 7568 | 6403 | 54 | 54 | 0.71% | 0.84% | 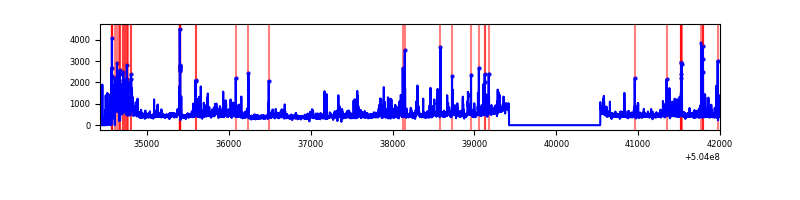 |
| D | 7571 | 6435 | 133 | 133 | 1.76% | 2.07% | 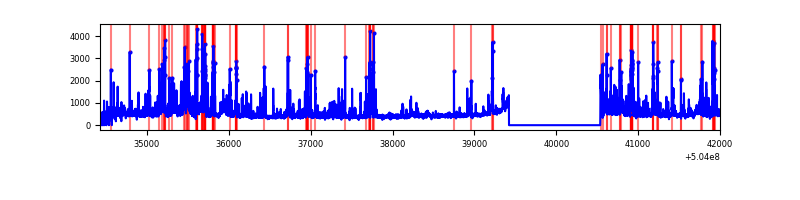 |
Top three noisy pixels from each quadrant. If the there are fewer than three noisy pixels in the level2.evt file, extra rows are filled as -1
| Pixel properties | Quadrant properties | ||||||
|---|---|---|---|---|---|---|---|
| Quadrant | DetID | PixID | Counts | Sigma | Mean | Median | Sigma |
| A | 12 | 115 | 105262 | 625.22 | 677 | 659 | 167.3 |
| A | 3 | 14 | 81366 | 482.39 | 677 | 659 | 167.3 |
| A | 0 | 8 | 67567 | 399.91 | 677 | 659 | 167.3 |
| B | 0 | 199 | 178223 | 1232.15 | 671 | 647 | 144.1 |
| B | 5 | 185 | 79094 | 544.32 | 671 | 647 | 144.1 |
| B | 9 | 254 | 61911 | 425.09 | 671 | 647 | 144.1 |
| C | 9 | 38 | 387187 | 2124.63 | 662 | 655 | 181.9 |
| C | 12 | 249 | 213202 | 1168.3 | 662 | 655 | 181.9 |
| C | 13 | 3 | 89723 | 489.58 | 662 | 655 | 181.9 |
| D | 11 | 176 | 424616 | 2258.96 | 662 | 633 | 187.7 |
| D | 11 | 129 | 371772 | 1977.41 | 662 | 633 | 187.7 |
| D | 2 | 31 | 250836 | 1333.07 | 662 | 633 | 187.7 |
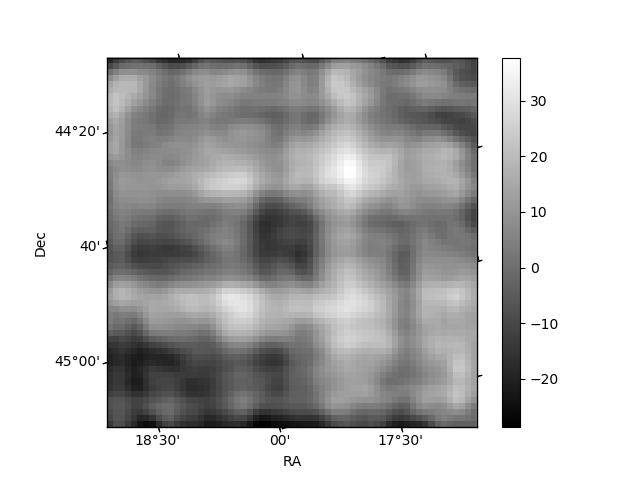
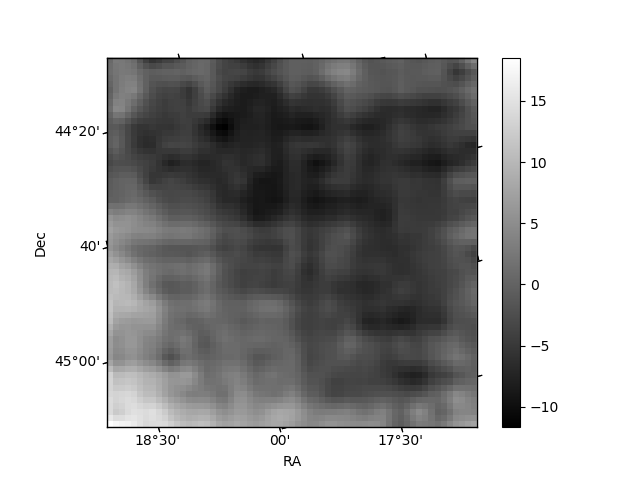
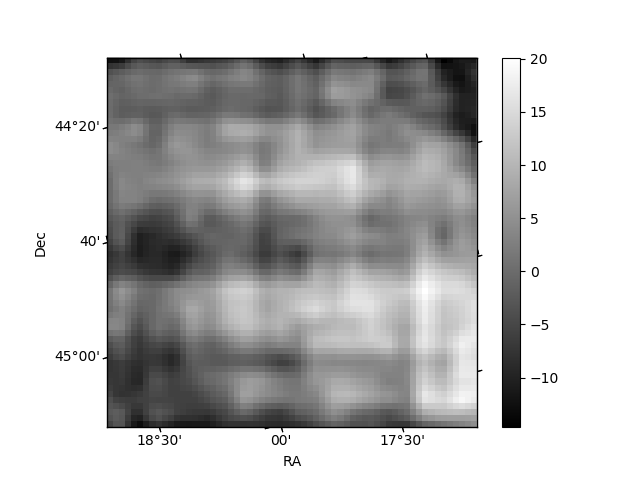
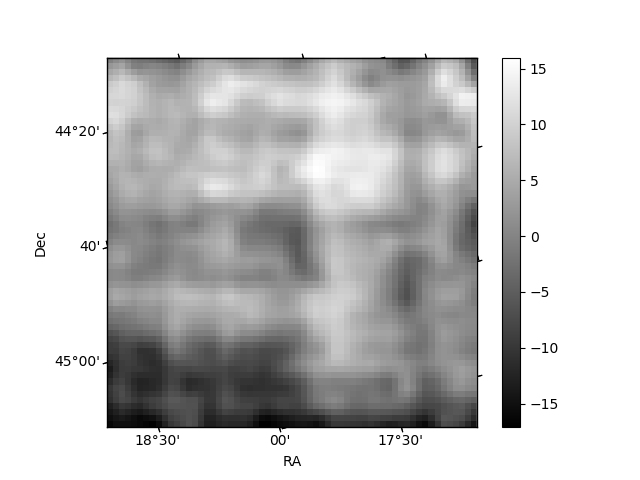
Histogram calculated using DETX and DETY for each event in the final _common_clean file
| Quadrant A | 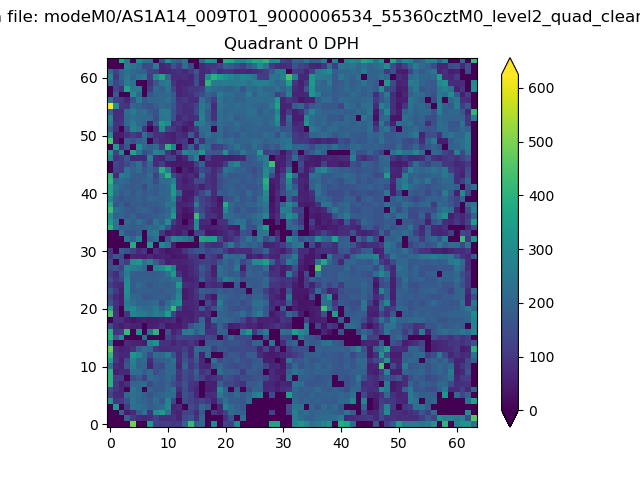 |
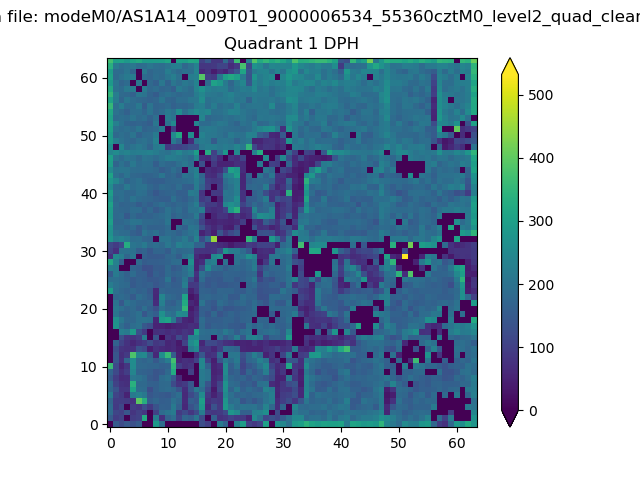 |
Quadrant B |
|---|---|---|---|
| Quadrant D | 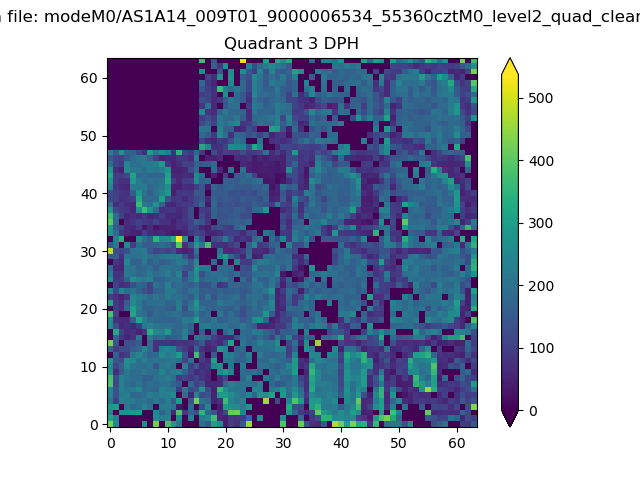 |
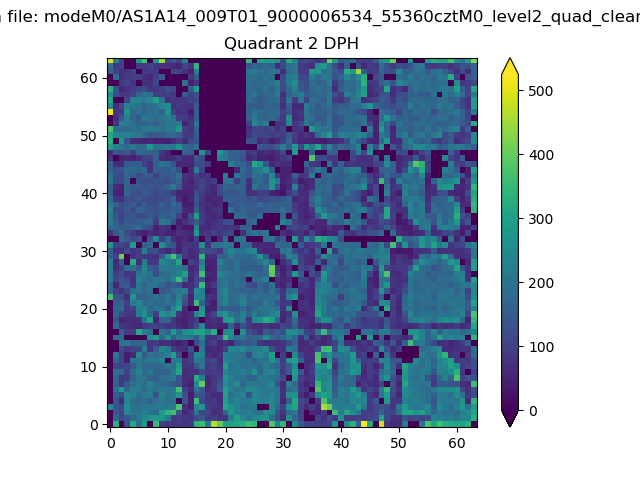 |
Quadrant C |
| Plot type | Count rate plots | Images |
|---|---|---|
| Comparison with Poisson distribution Blue bars denote a histogram of data divided into 1 sec bins. Red curve is a Poisson curve with rate = median count rate of data. |
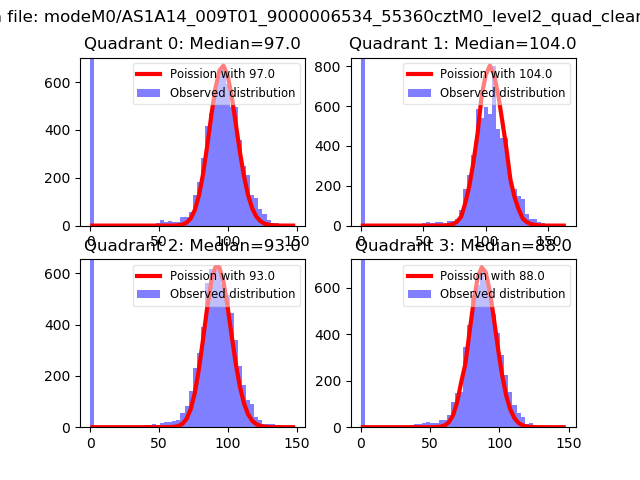 |
 |
| Quadrant-wise count rates Data is divided into 100 sec bins |
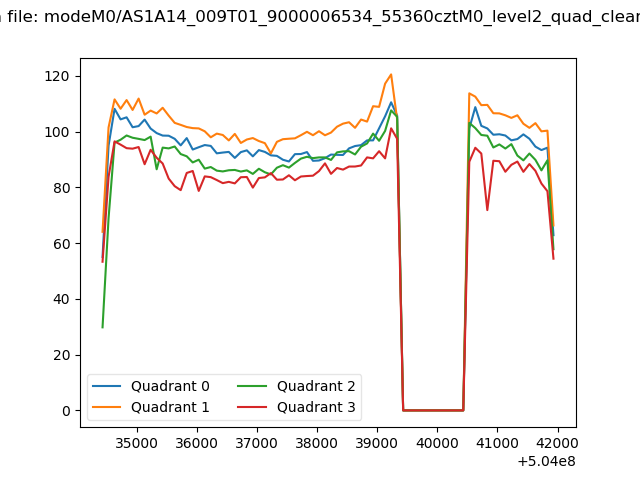 |
|
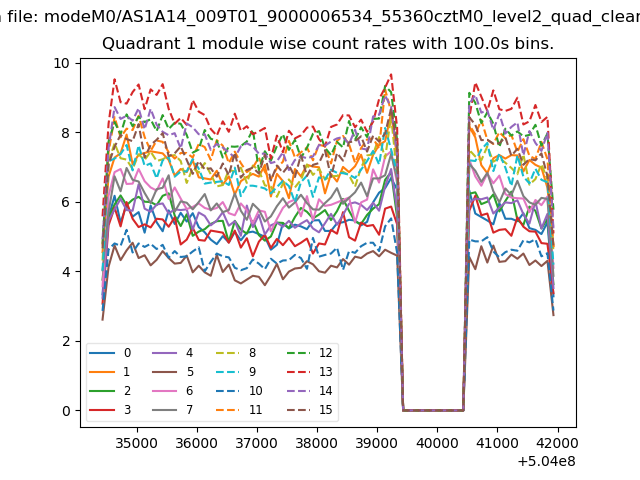
| Module-wise count rates for Quadrant A Data is divided into 100 sec bins |
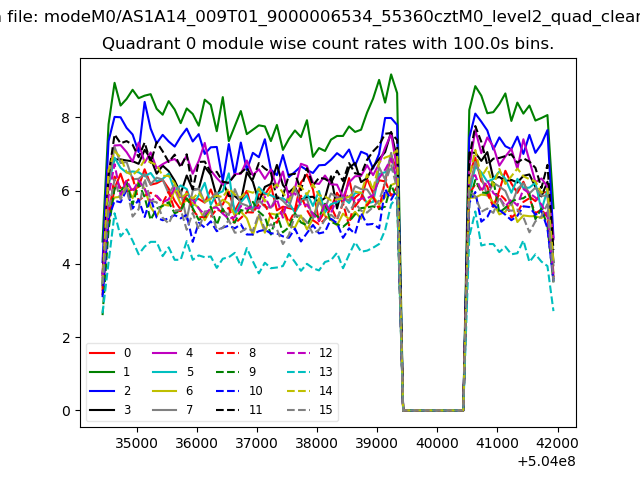 |
 |
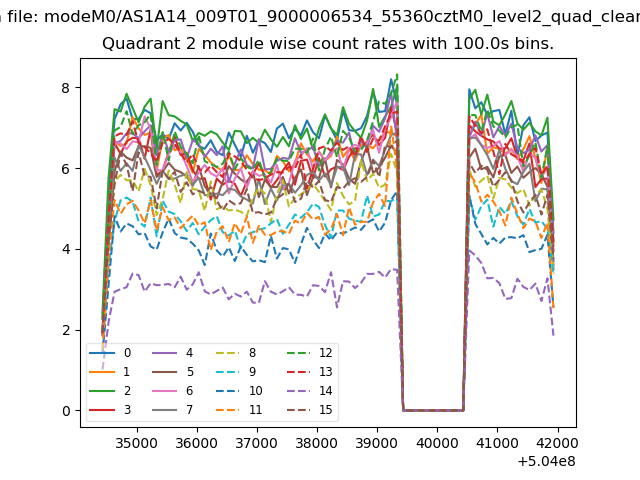
| Module-wise count rates for Quadrant B Data is divided into 100 sec bins |
 |
 |
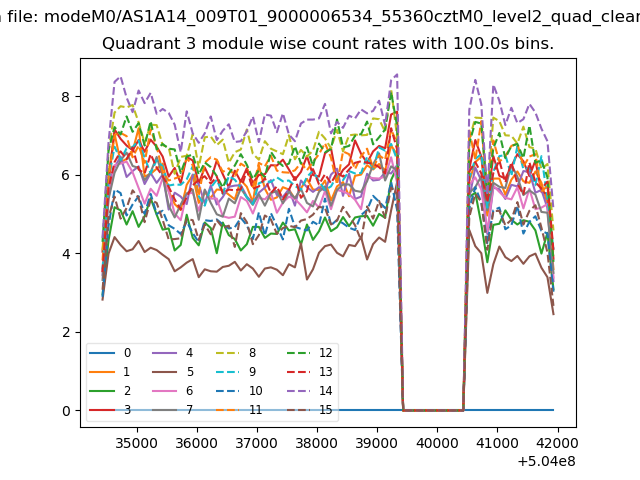
| Module-wise count rates for Quadrant C Data is divided into 100 sec bins |
 |
 |
| Module-wise count rates for Quadrant D Data is divided into 100 sec bins |
 |
 |
| Parameter | Plot |
|---|---|
| CZT HV Monitor | 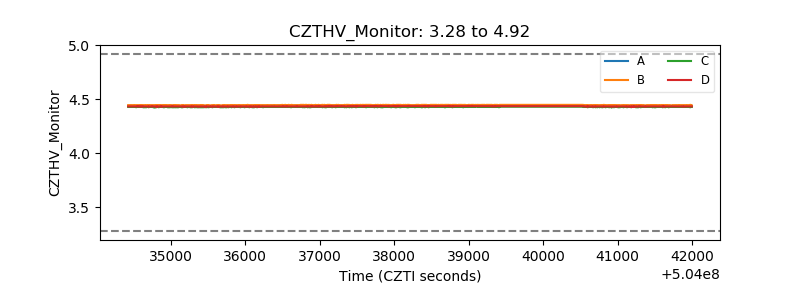 |
| D_VDD | 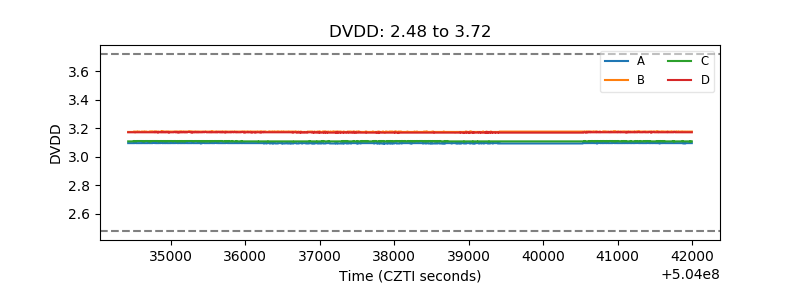 |
| Temperature 1 | 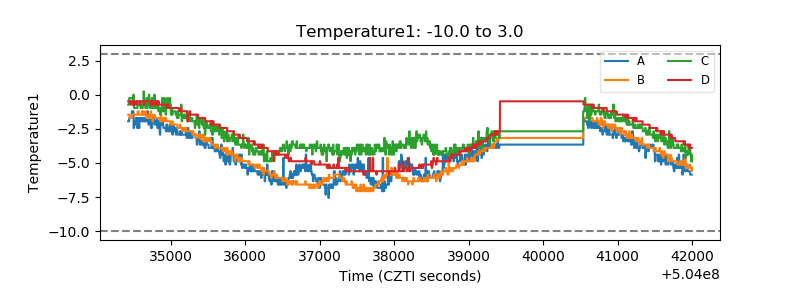 |
| Veto HV Monitor | 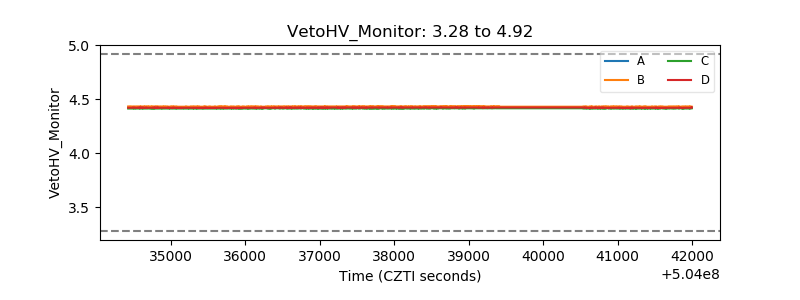 |
| Veto LLD | 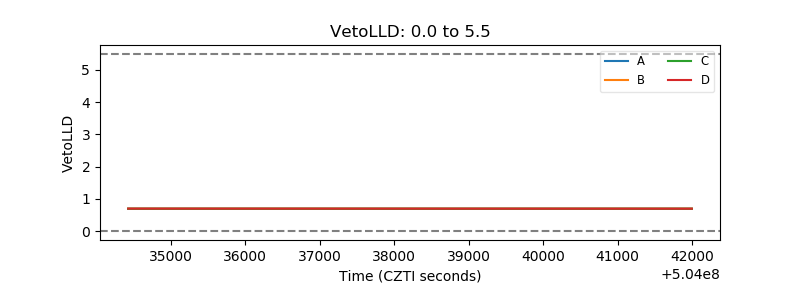 |
| Alpha Counter | 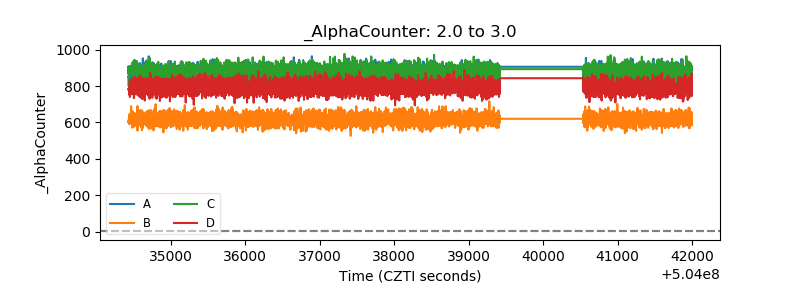 |
| _CPM_Rate | 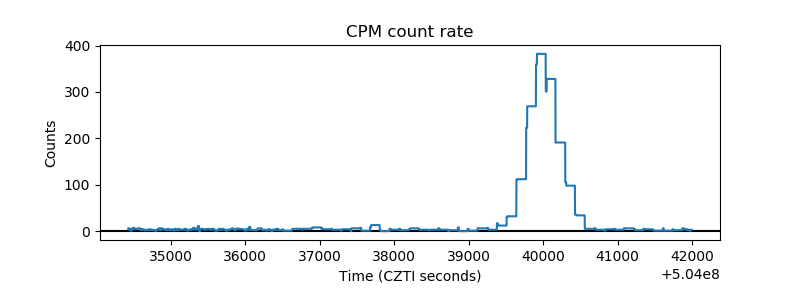 |
| CZT Counter | 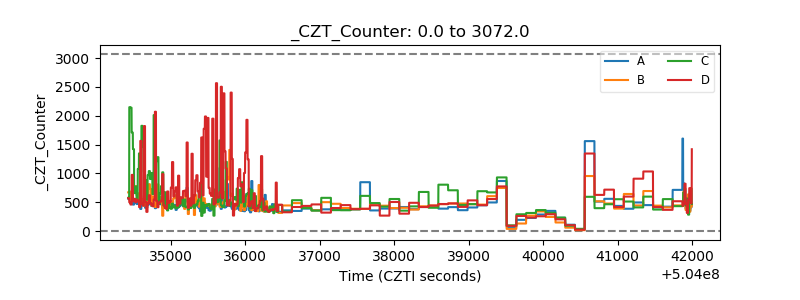 |
| +2.5 Volts monitor |  |
| +5 Volts monitor | 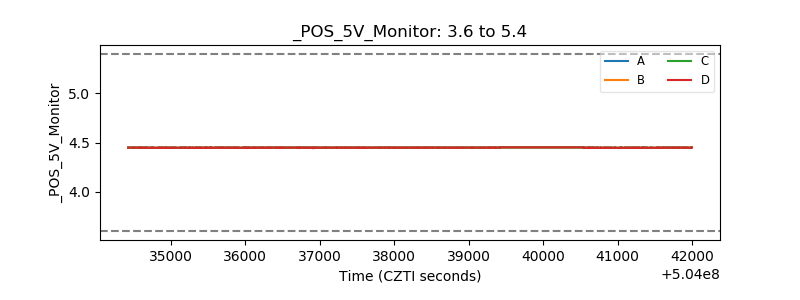 |
| _ROLL_ROT | 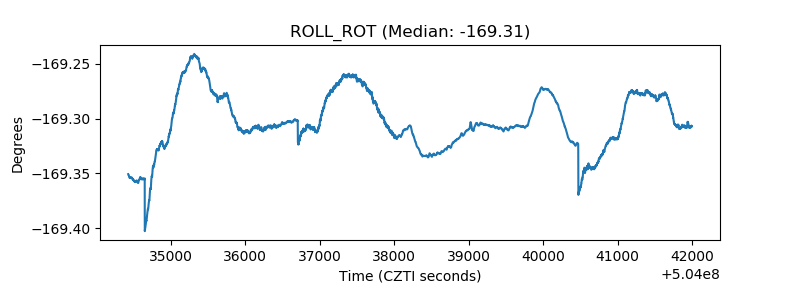 |
| _Roll_DEC | 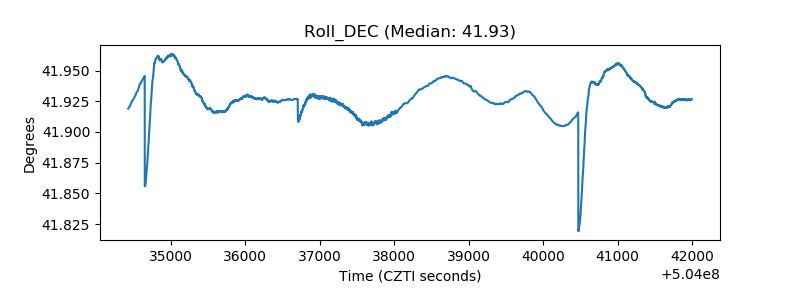 |
| _Roll_RA | 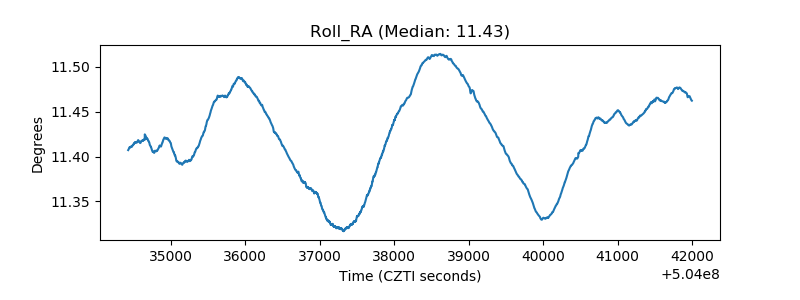 |
| Veto Counter | 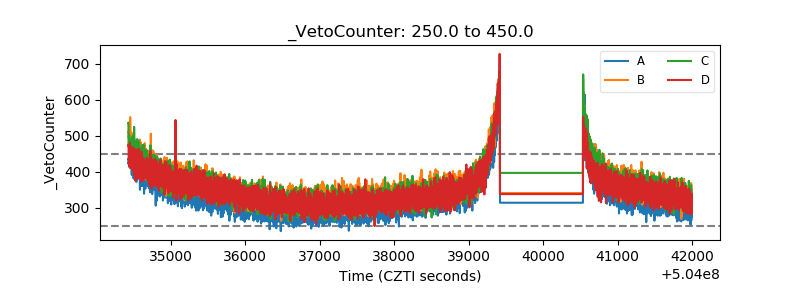 |