| Param | Original file | Final file |
|---|---|---|
| Filename | modeM0/AS1A14_009T01_9000006534_55361cztM0_level2.fits | modeM0/AS1A14_009T01_9000006534_55361cztM0_level2_quad_clean.evt |
| Size (bytes) | 625,184,640 | 153,227,520 |
| Size | 596.2 MB | 146.1 MB |
| Events in quadrant A | 4,977,401 | 995,745 |
| Events in quadrant B | 4,812,002 | 1,068,665 |
| Events in quadrant C | 5,525,519 | 960,470 |
| Events in quadrant D | 7,008,518 | 883,812 |
| Mode SS | |||
|---|---|---|---|
| Quadrant | BADHDUFLAG | Total packets | Discarded packets |
| A | 0 | 216 | 0 |
| B | 0 | 216 | 0 |
| C | 0 | 216 | 0 |
| D | 0 | 216 | 0 |
| Mode M0 | |||
|---|---|---|---|
| Quadrant | BADHDUFLAG | Total packets | Discarded packets |
| A | 0 | 22914 | 2 |
| B | 0 | 22304 | 2 |
| C | 0 | 24035 | 2 |
| D | 0 | 28466 | 2 |
| Mode M9 | |||
|---|---|---|---|
| Quadrant | BADHDUFLAG | Total packets | Discarded packets |
| A | 0 | 20 | 0 |
| B | 0 | 20 | 0 |
| C | 0 | 20 | 0 |
| D | 0 | 20 | 0 |
| Quadrant | Total seconds | Saturated seconds | Saturation percentage |
|---|---|---|---|
| A | 10550 | 60 | 0.568720% |
| B | 10550 | 83 | 0.786730% |
| C | 10550 | 93 | 0.881517% |
| D | 10550 | 415 | 3.933649% |
Noise dominated data is calculated using 1-second bins in cleaned event files. If a bin has >2000 counts, and if more than 50% of those come from <1% of pixels, then it is considered to be noise-dominated and hence unusable.
| Quadrant | # 1 sec bins | Bins with >0 counts | Bins with >2000 counts | High rate bins dominated by noise | Noise dominated (total time) | Noise dominated (detector-on time) | Marked lightcurve |
|---|---|---|---|---|---|---|---|
| A | 12580 | 10552 | 43 | 43 | 0.34% | 0.41% | 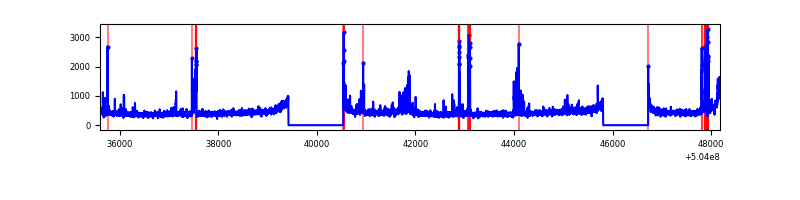 |
| B | 12580 | 10552 | 15 | 15 | 0.12% | 0.14% | 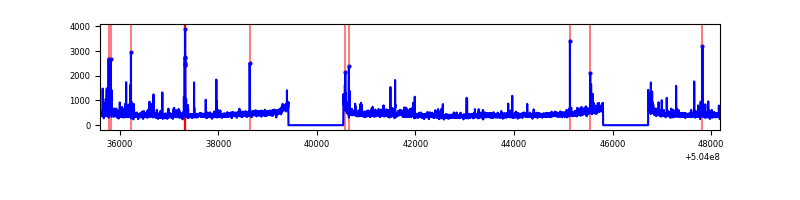 |
| C | 12580 | 10552 | 74 | 74 | 0.59% | 0.70% | 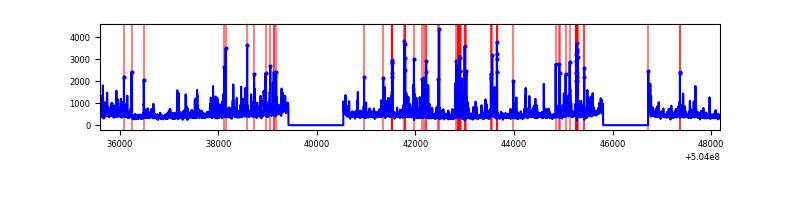 |
| D | 12580 | 10552 | 330 | 330 | 2.62% | 3.13% | 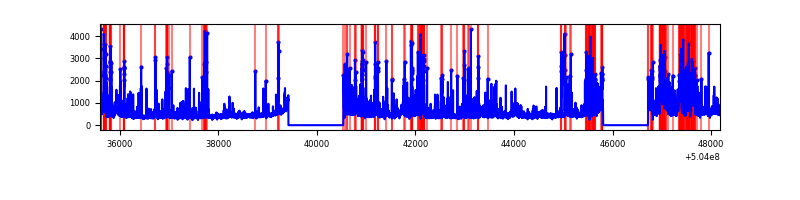 |
Top three noisy pixels from each quadrant. If the there are fewer than three noisy pixels in the level2.evt file, extra rows are filled as -1
| Pixel properties | Quadrant properties | ||||||
|---|---|---|---|---|---|---|---|
| Quadrant | DetID | PixID | Counts | Sigma | Mean | Median | Sigma |
| A | 0 | 8 | 275871 | 1015.32 | 1099 | 1072 | 270.7 |
| A | 12 | 115 | 219075 | 805.47 | 1099 | 1072 | 270.7 |
| A | 3 | 14 | 85699 | 312.68 | 1099 | 1072 | 270.7 |
| B | 0 | 199 | 191913 | 817.02 | 1095 | 1052 | 233.6 |
| B | 10 | 247 | 83724 | 353.89 | 1095 | 1052 | 233.6 |
| B | 5 | 185 | 58553 | 246.14 | 1095 | 1052 | 233.6 |
| C | 12 | 249 | 293689 | 982.04 | 1085 | 1077 | 298.0 |
| C | 7 | 64 | 261145 | 872.82 | 1085 | 1077 | 298.0 |
| C | 13 | 3 | 212864 | 710.78 | 1085 | 1077 | 298.0 |
| D | 11 | 129 | 793511 | 2609.54 | 1068 | 1021 | 303.7 |
| D | 2 | 31 | 599858 | 1971.87 | 1068 | 1021 | 303.7 |
| D | 11 | 176 | 477269 | 1568.21 | 1068 | 1021 | 303.7 |
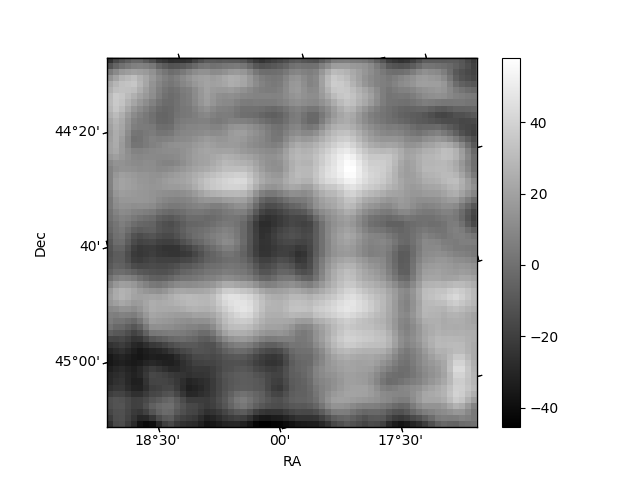
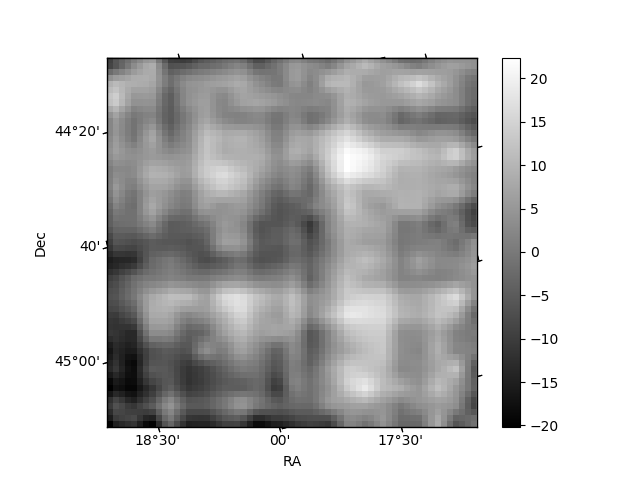
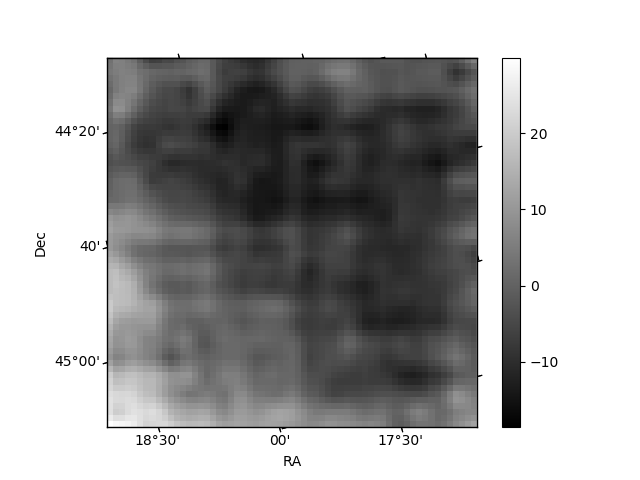
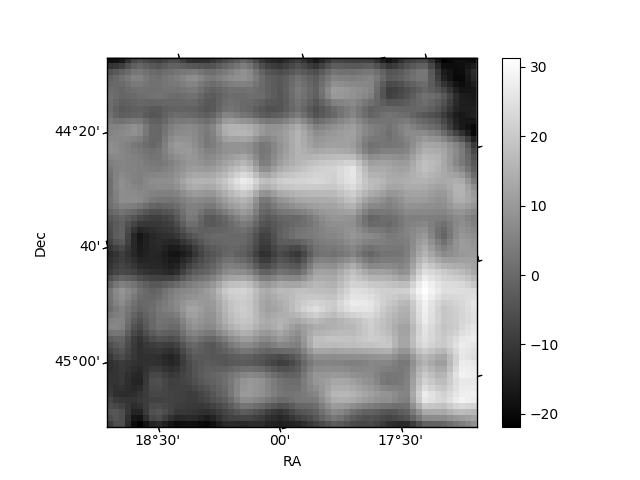
Histogram calculated using DETX and DETY for each event in the final _common_clean file
| Quadrant A | 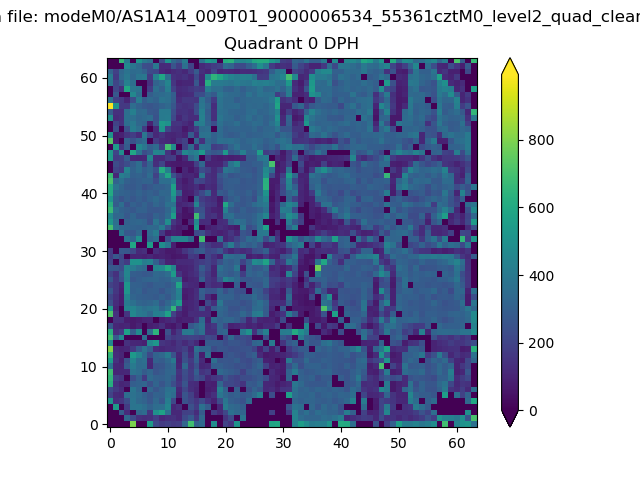 |
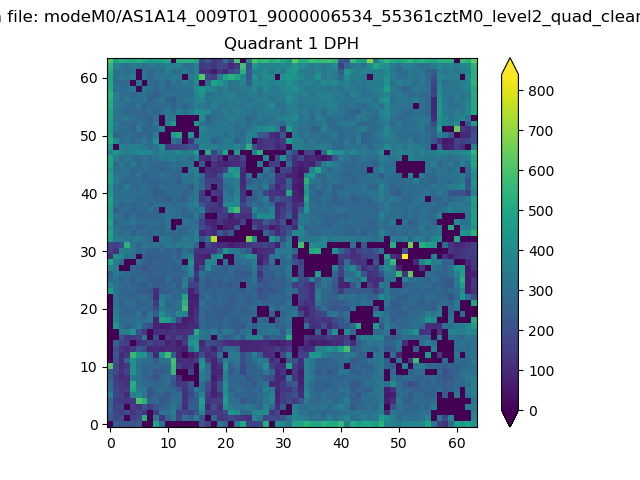 |
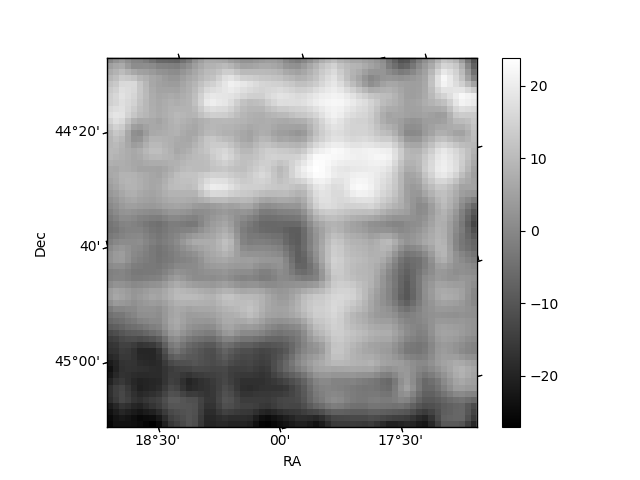
Quadrant B |
|---|---|---|---|
| Quadrant D | 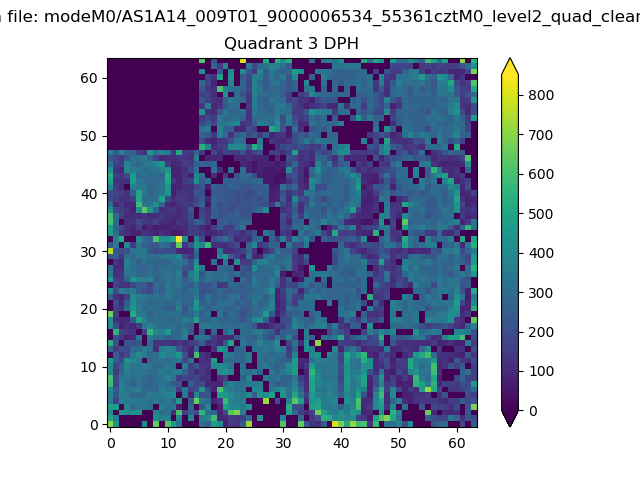 |
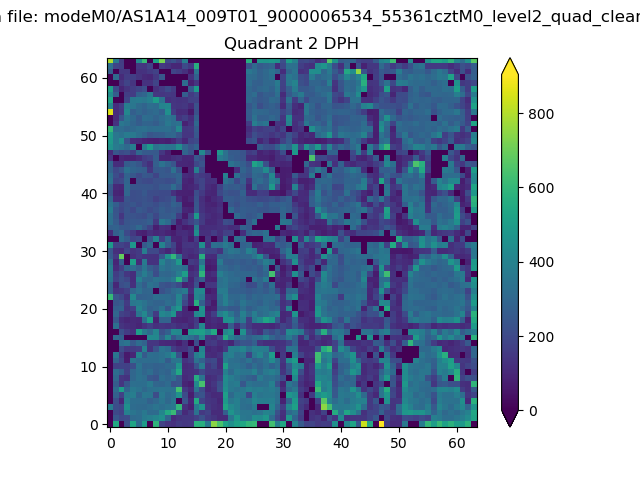 |
Quadrant C |
| Plot type | Count rate plots | Images |
|---|---|---|
| Comparison with Poisson distribution Blue bars denote a histogram of data divided into 1 sec bins. Red curve is a Poisson curve with rate = median count rate of data. |
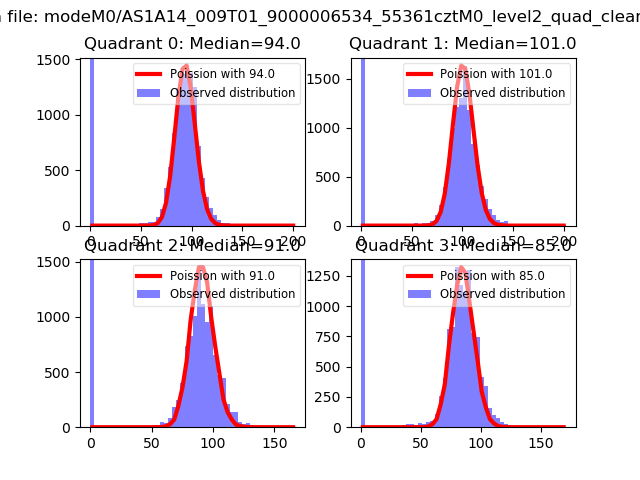 |
 |
| Quadrant-wise count rates Data is divided into 100 sec bins |
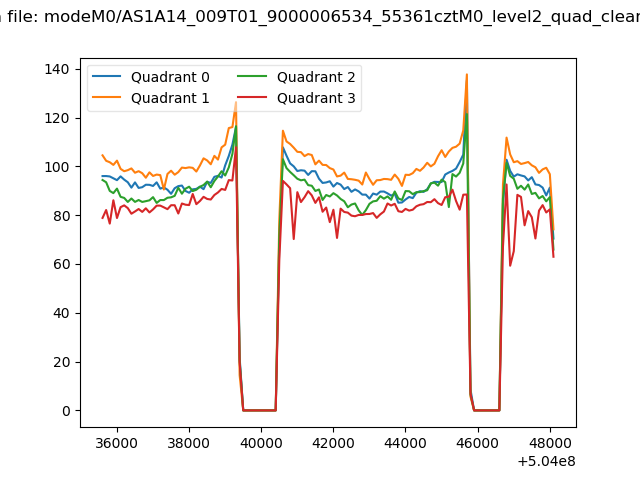 |
|
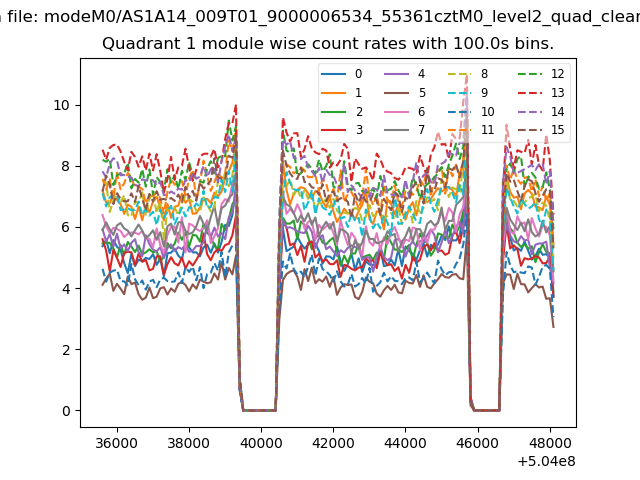
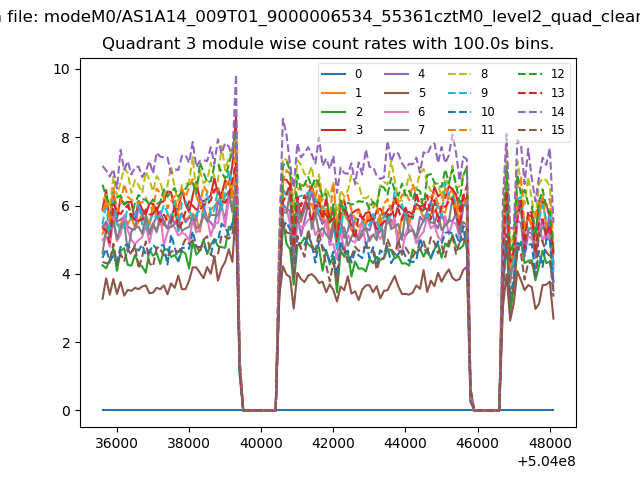
| Module-wise count rates for Quadrant A Data is divided into 100 sec bins |
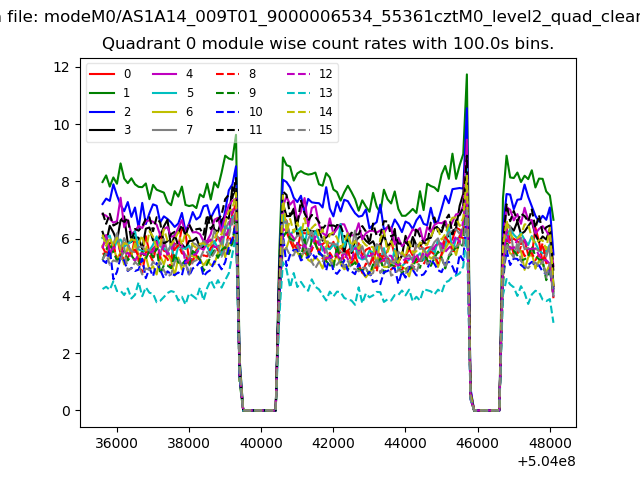 |
 |
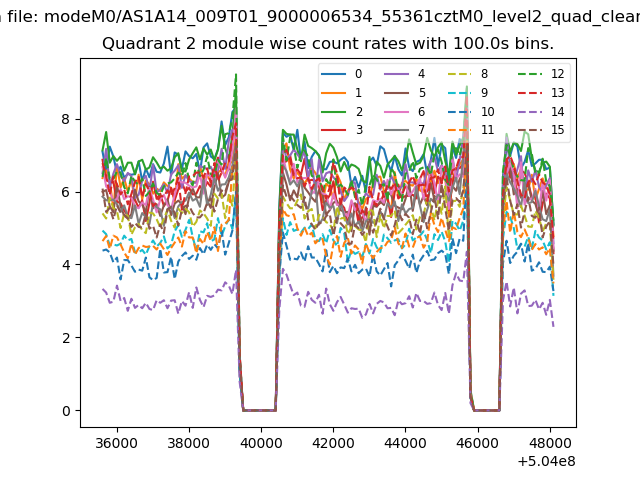
| Module-wise count rates for Quadrant B Data is divided into 100 sec bins |
 |
 |
| Module-wise count rates for Quadrant C Data is divided into 100 sec bins |
 |
 |
| Module-wise count rates for Quadrant D Data is divided into 100 sec bins |
 |
 |
| Parameter | Plot |
|---|---|
| CZT HV Monitor | 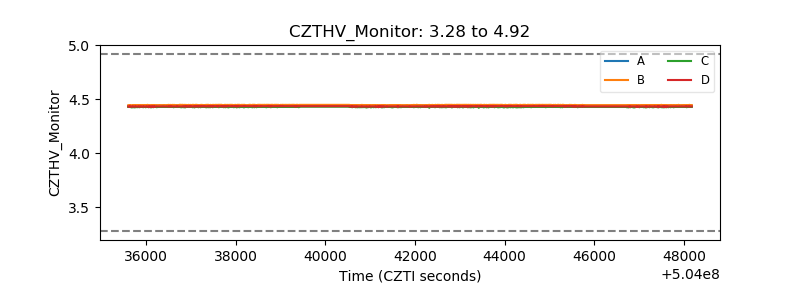 |
| D_VDD | 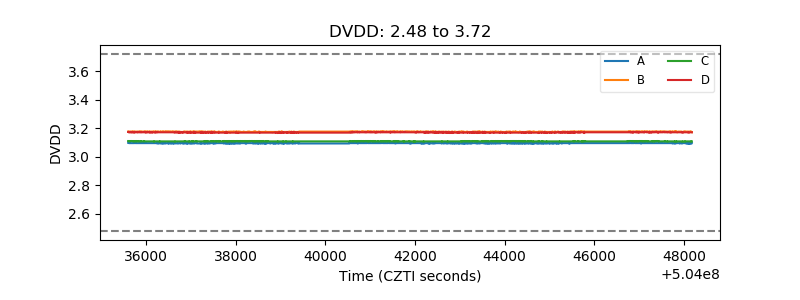 |
| Temperature 1 | 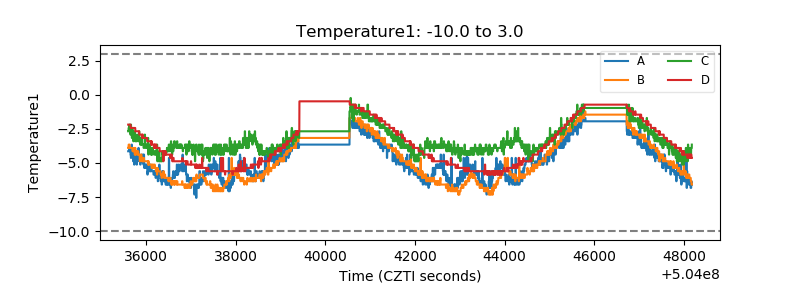 |
| Veto HV Monitor | 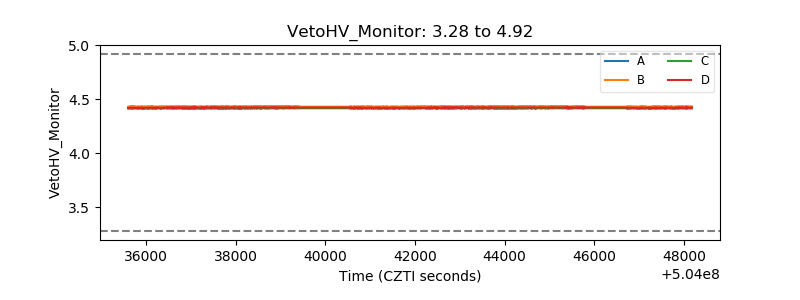 |
| Veto LLD | 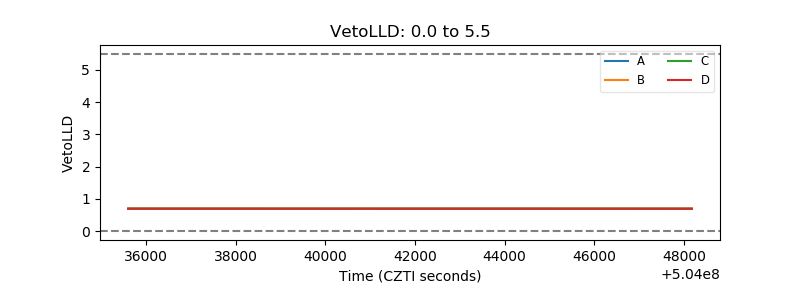 |
| Alpha Counter | 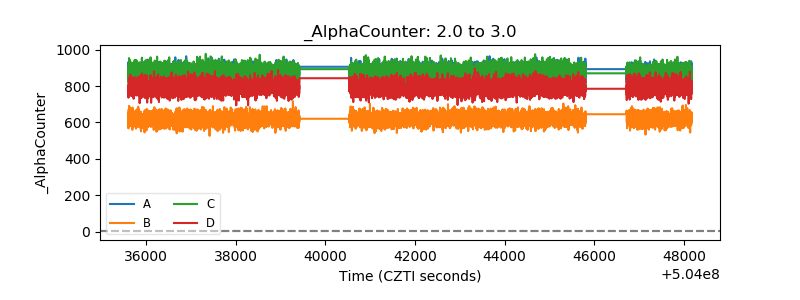 |
| _CPM_Rate | 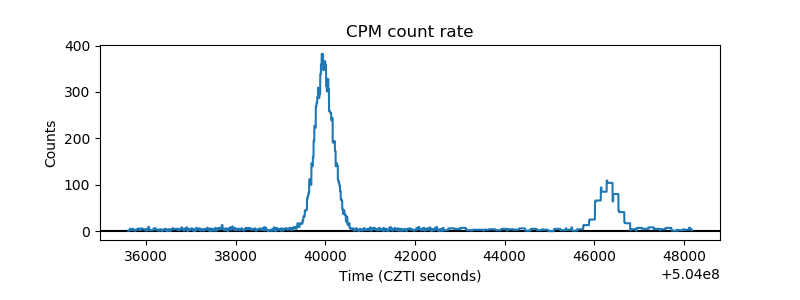 |
| CZT Counter | 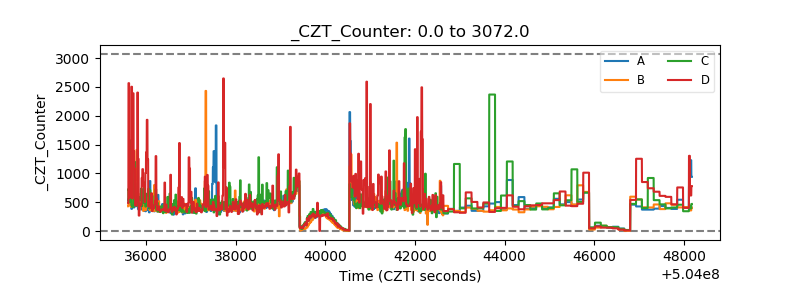 |
| +2.5 Volts monitor |  |
| +5 Volts monitor |  |
| _ROLL_ROT | 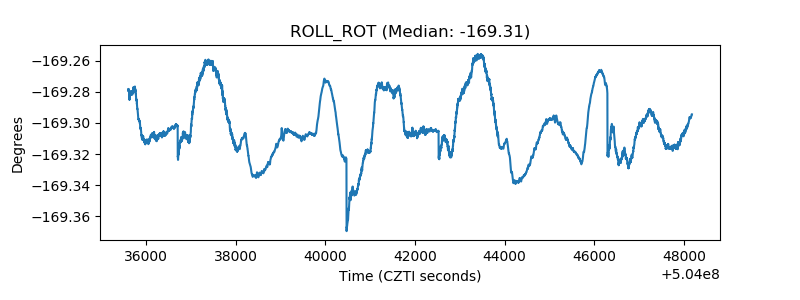 |
| _Roll_DEC | 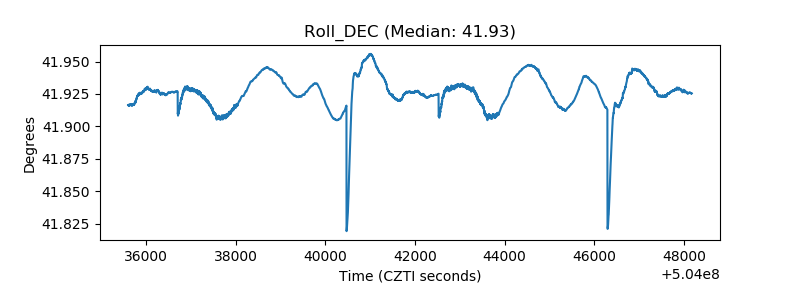 |
| _Roll_RA | 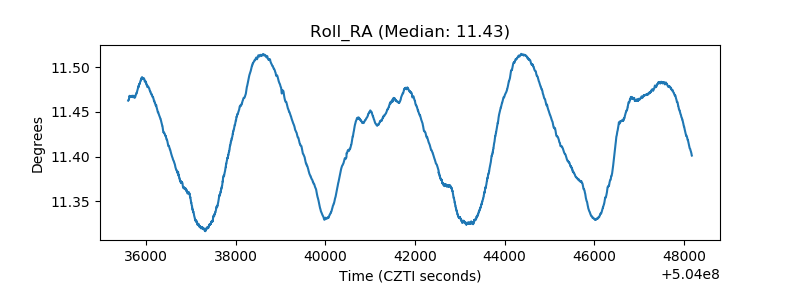 |
| Veto Counter | 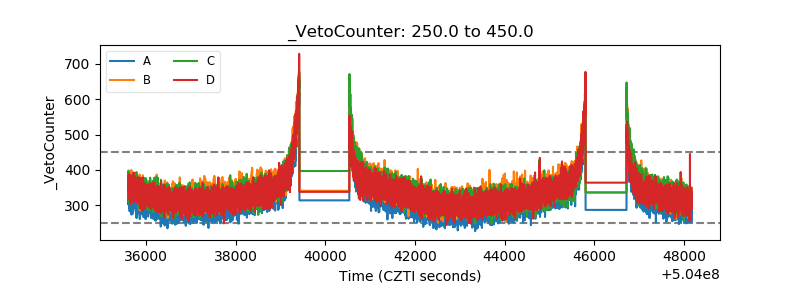 |