| Param | Original file | Final file |
|---|---|---|
| Filename | modeM0/AS1A14_009T01_9000006534_55362cztM0_level2.fits | modeM0/AS1A14_009T01_9000006534_55362cztM0_level2_quad_clean.evt |
| Size (bytes) | 480,781,440 | 109,598,400 |
| Size | 458.5 MB | 104.5 MB |
| Events in quadrant A | 4,159,589 | 716,900 |
| Events in quadrant B | 3,864,006 | 756,542 |
| Events in quadrant C | 4,041,094 | 685,085 |
| Events in quadrant D | 5,141,830 | 631,886 |
| Mode SS | |||
|---|---|---|---|
| Quadrant | BADHDUFLAG | Total packets | Discarded packets |
| A | 0 | 154 | 0 |
| B | 0 | 154 | 0 |
| C | 0 | 154 | 0 |
| D | 0 | 154 | 0 |
| Mode M0 | |||
|---|---|---|---|
| Quadrant | BADHDUFLAG | Total packets | Discarded packets |
| A | 0 | 17904 | 2 |
| B | 0 | 17213 | 2 |
| C | 0 | 17762 | 2 |
| D | 0 | 20803 | 2 |
| Mode M9 | |||
|---|---|---|---|
| Quadrant | BADHDUFLAG | Total packets | Discarded packets |
| A | 0 | 13 | 0 |
| B | 0 | 13 | 0 |
| C | 0 | 13 | 0 |
| D | 0 | 13 | 0 |
| Quadrant | Total seconds | Saturated seconds | Saturation percentage |
|---|---|---|---|
| A | 7597 | 81 | 1.066210% |
| B | 7598 | 194 | 2.553304% |
| C | 7598 | 99 | 1.302974% |
| D | 7598 | 329 | 4.330087% |
Noise dominated data is calculated using 1-second bins in cleaned event files. If a bin has >2000 counts, and if more than 50% of those come from <1% of pixels, then it is considered to be noise-dominated and hence unusable.
| Quadrant | # 1 sec bins | Bins with >0 counts | Bins with >2000 counts | High rate bins dominated by noise | Noise dominated (total time) | Noise dominated (detector-on time) | Marked lightcurve |
|---|---|---|---|---|---|---|---|
| A | 8887 | 7599 | 39 | 39 | 0.44% | 0.51% | 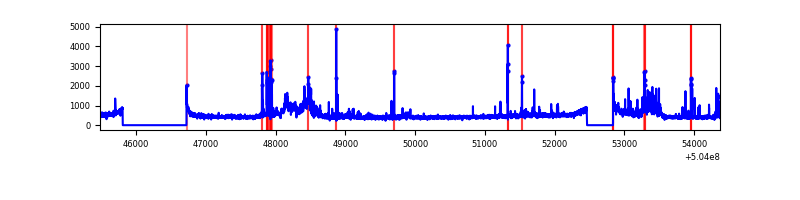 |
| B | 8888 | 7600 | 84 | 84 | 0.95% | 1.11% | 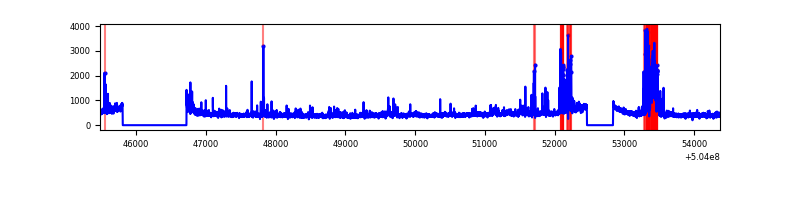 |
| C | 8888 | 7600 | 62 | 62 | 0.70% | 0.82% | 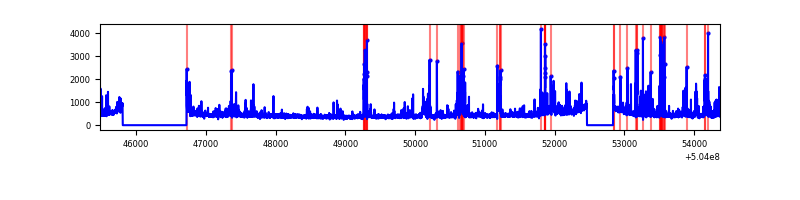 |
| D | 8888 | 7600 | 248 | 248 | 2.79% | 3.26% | 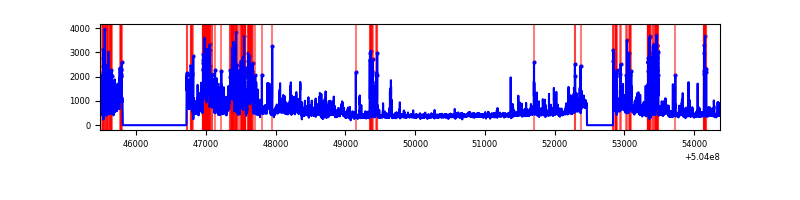 |
Top three noisy pixels from each quadrant. If the there are fewer than three noisy pixels in the level2.evt file, extra rows are filled as -1
| Pixel properties | Quadrant properties | ||||||
|---|---|---|---|---|---|---|---|
| Quadrant | DetID | PixID | Counts | Sigma | Mean | Median | Sigma |
| A | 12 | 115 | 683764 | 3402.07 | 814 | 793 | 200.8 |
| A | 0 | 8 | 162647 | 806.24 | 814 | 793 | 200.8 |
| A | 4 | 3 | 44608 | 218.25 | 814 | 793 | 200.8 |
| B | 5 | 185 | 389674 | 2252.04 | 806 | 775 | 172.7 |
| B | 0 | 199 | 166242 | 958.19 | 806 | 775 | 172.7 |
| B | 9 | 254 | 52195 | 297.76 | 806 | 775 | 172.7 |
| C | 12 | 250 | 162564 | 741.08 | 801 | 792 | 218.3 |
| C | 7 | 64 | 153632 | 700.16 | 801 | 792 | 218.3 |
| C | 13 | 3 | 142226 | 647.91 | 801 | 792 | 218.3 |
| D | 11 | 129 | 685622 | 3024.75 | 789 | 752 | 226.4 |
| D | 2 | 31 | 305192 | 1344.57 | 789 | 752 | 226.4 |
| D | 5 | 38 | 213286 | 938.66 | 789 | 752 | 226.4 |
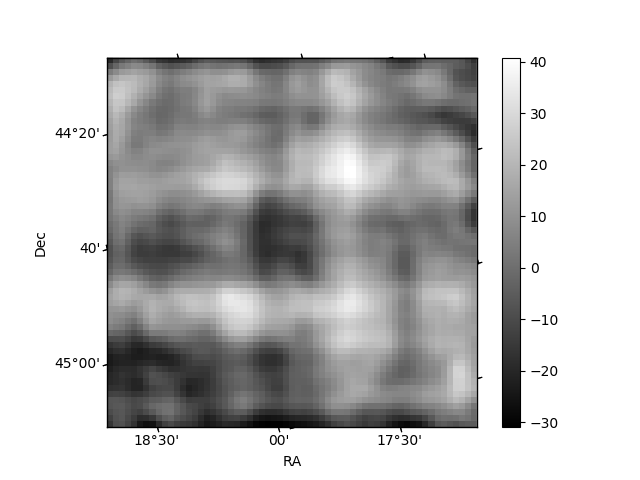
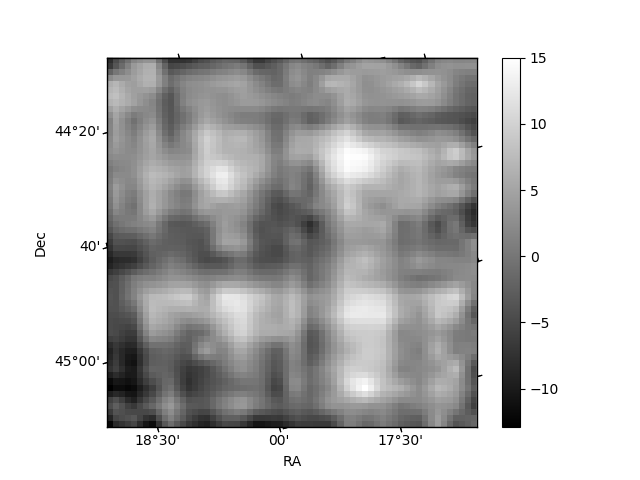
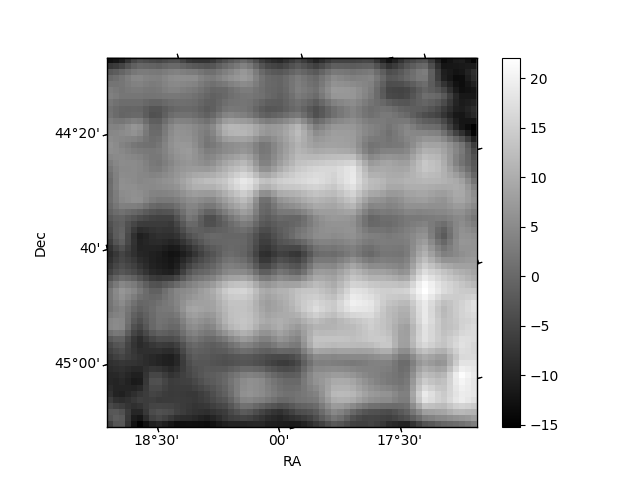
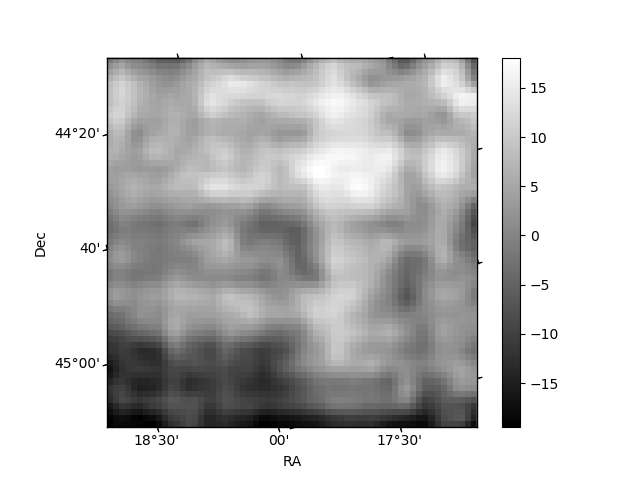
Histogram calculated using DETX and DETY for each event in the final _common_clean file
| Quadrant A | 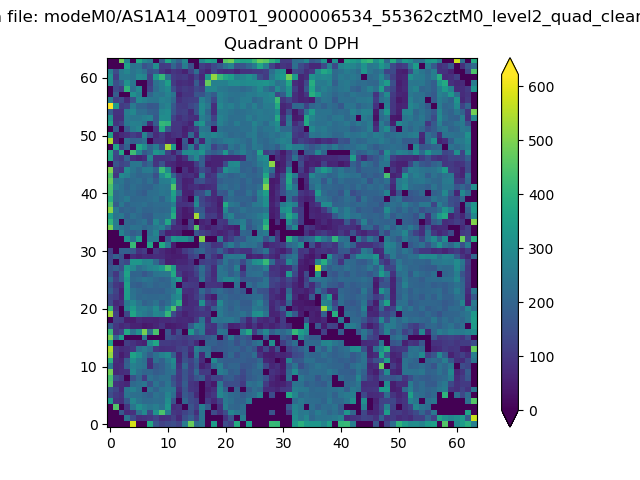 |
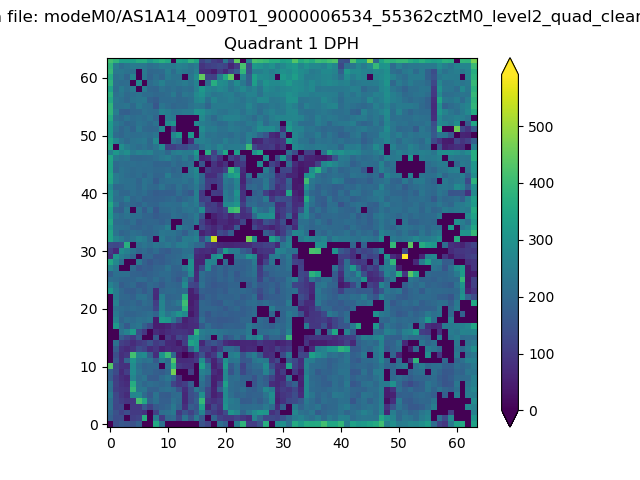 |
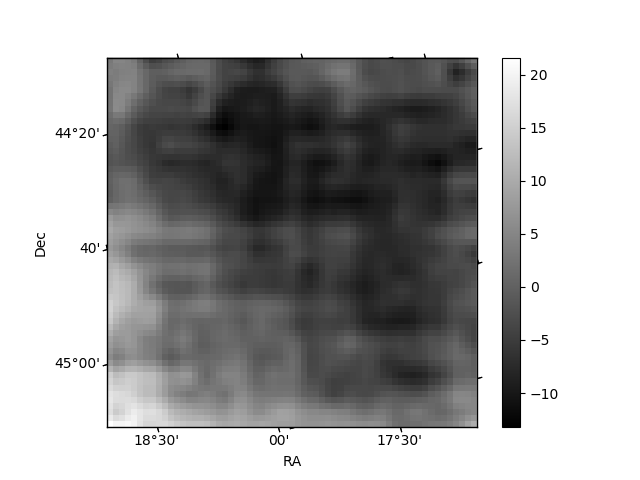
Quadrant B |
|---|---|---|---|
| Quadrant D | 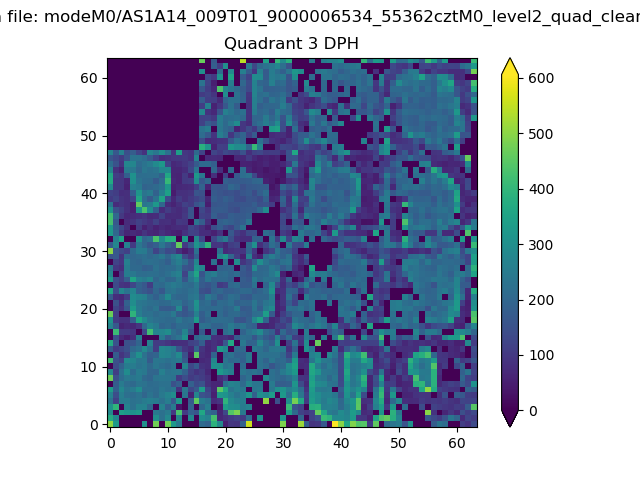 |
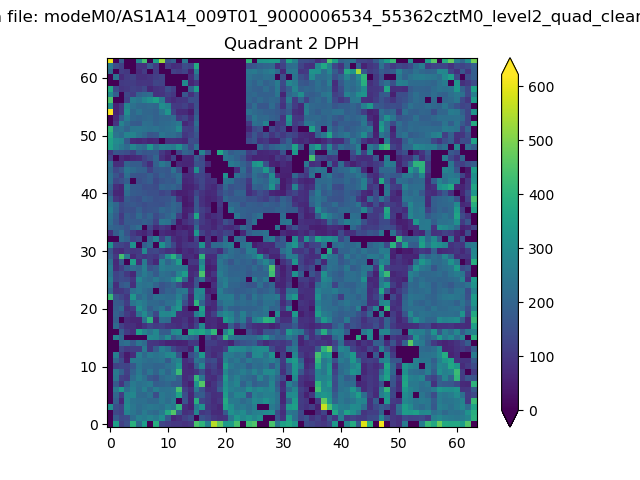 |
Quadrant C |
| Plot type | Count rate plots | Images |
|---|---|---|
| Comparison with Poisson distribution Blue bars denote a histogram of data divided into 1 sec bins. Red curve is a Poisson curve with rate = median count rate of data. |
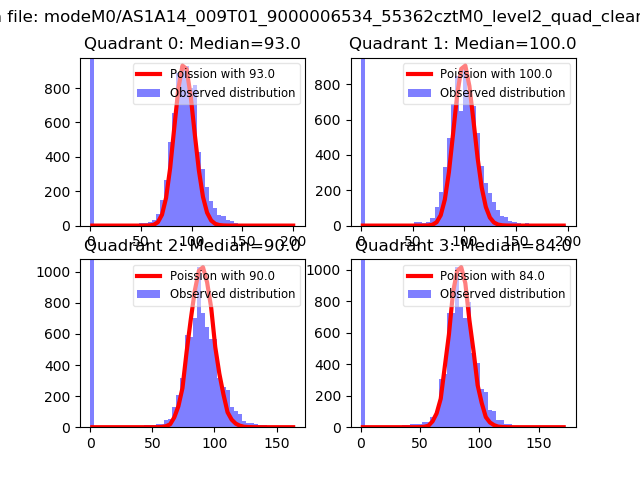 |
 |
| Quadrant-wise count rates Data is divided into 100 sec bins |
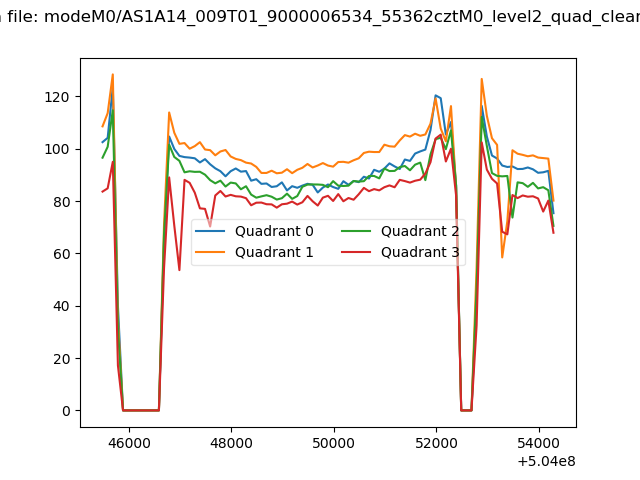 |
|
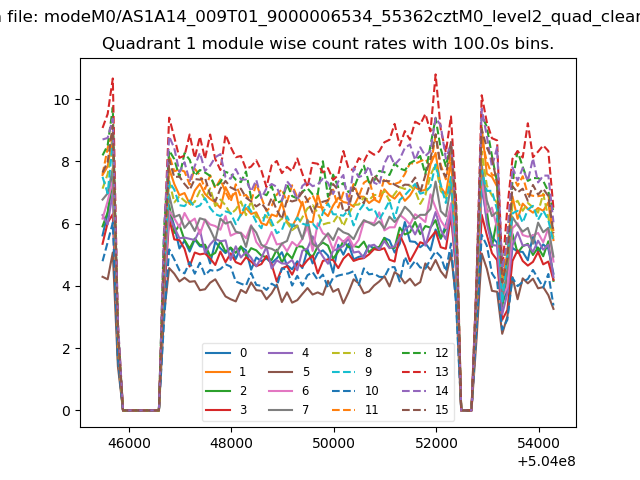
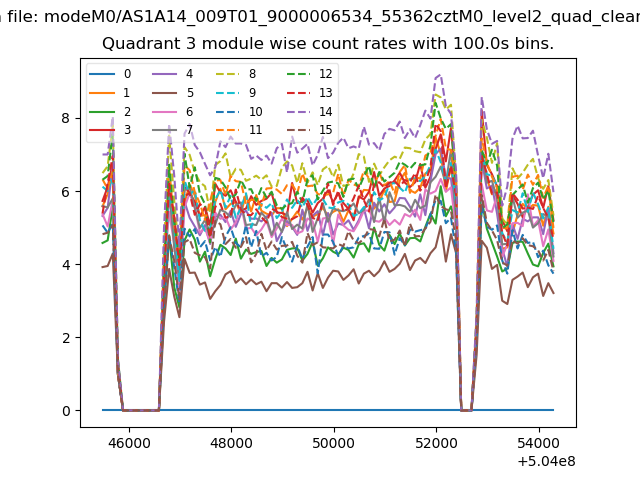
| Module-wise count rates for Quadrant A Data is divided into 100 sec bins |
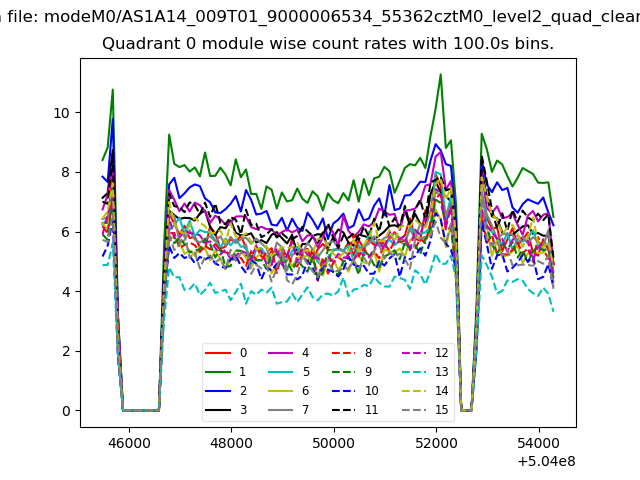 |
 |
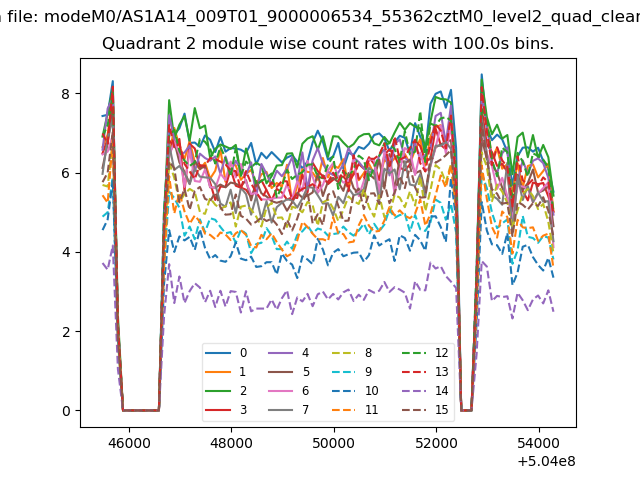
| Module-wise count rates for Quadrant B Data is divided into 100 sec bins |
 |
 |
| Module-wise count rates for Quadrant C Data is divided into 100 sec bins |
 |
 |
| Module-wise count rates for Quadrant D Data is divided into 100 sec bins |
 |
 |
| Parameter | Plot |
|---|---|
| CZT HV Monitor | 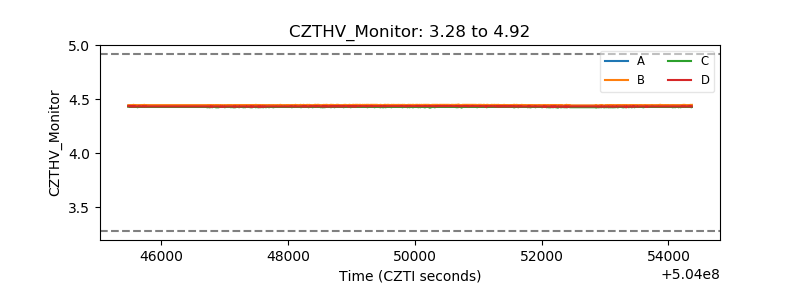 |
| D_VDD | 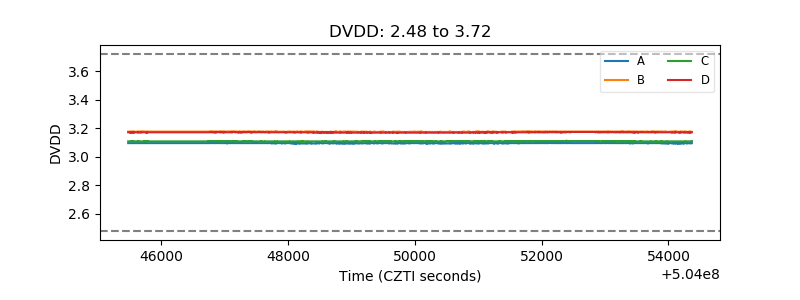 |
| Temperature 1 | 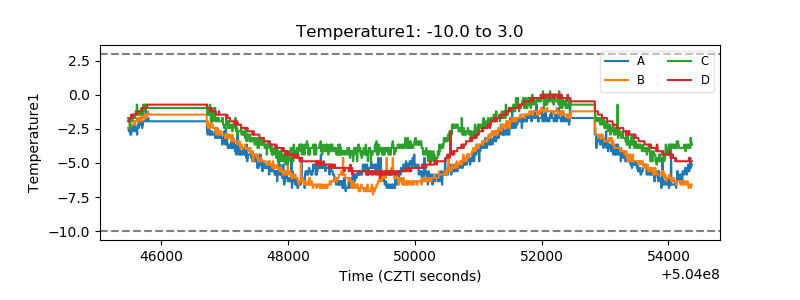 |
| Veto HV Monitor | 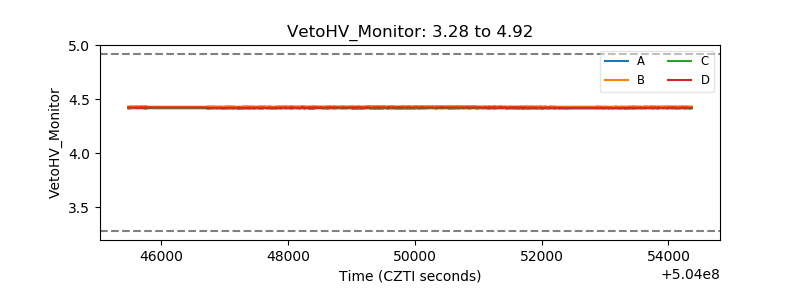 |
| Veto LLD | 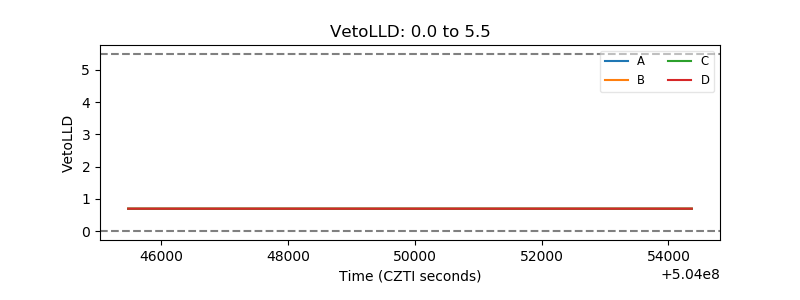 |
| Alpha Counter | 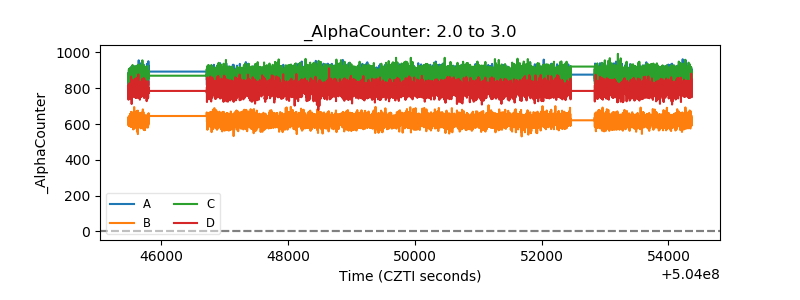 |
| _CPM_Rate | 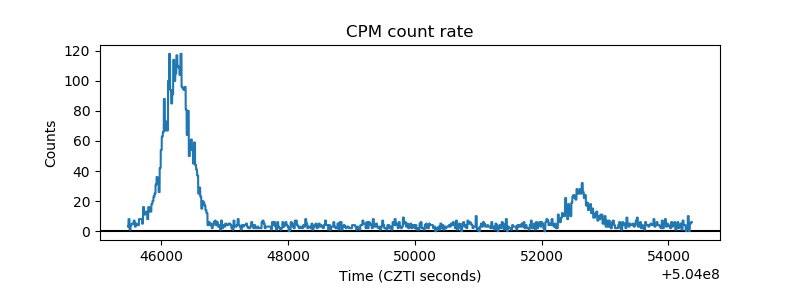 |
| CZT Counter | 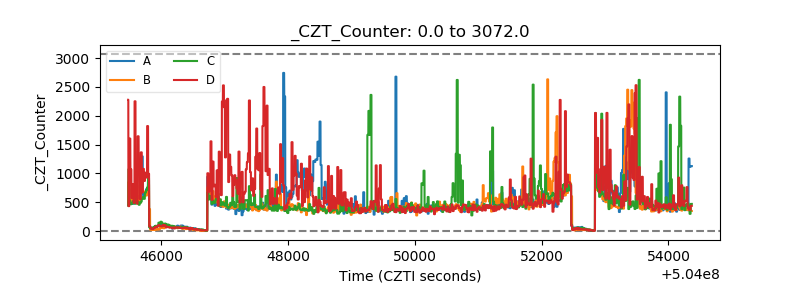 |
| +2.5 Volts monitor |  |
| +5 Volts monitor |  |
| _ROLL_ROT | 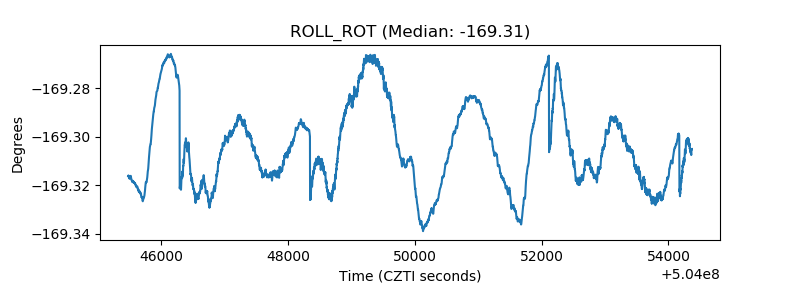 |
| _Roll_DEC | 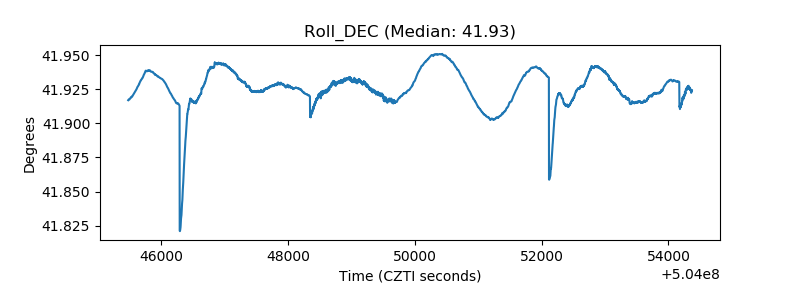 |
| _Roll_RA | 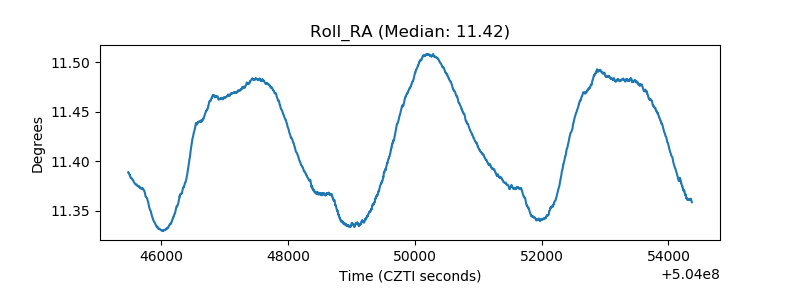 |
| Veto Counter | 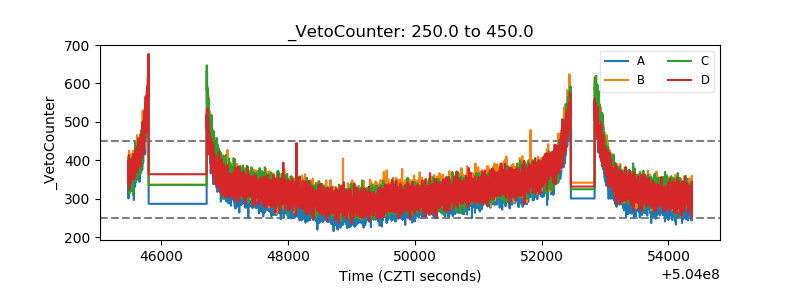 |