| Param | Original file | Final file |
|---|---|---|
| Filename | modeM0/AS1A14_009T01_9000006534_55363cztM0_level2.fits | modeM0/AS1A14_009T01_9000006534_55363cztM0_level2_quad_clean.evt |
| Size (bytes) | 552,490,560 | 121,017,600 |
| Size | 526.9 MB | 115.4 MB |
| Events in quadrant A | 4,241,087 | 793,452 |
| Events in quadrant B | 4,228,384 | 838,030 |
| Events in quadrant C | 6,024,135 | 750,028 |
| Events in quadrant D | 5,308,977 | 702,283 |
| Mode SS | |||
|---|---|---|---|
| Quadrant | BADHDUFLAG | Total packets | Discarded packets |
| A | 0 | 168 | 0 |
| B | 0 | 168 | 0 |
| C | 0 | 168 | 0 |
| D | 0 | 168 | 0 |
| Mode M0 | |||
|---|---|---|---|
| Quadrant | BADHDUFLAG | Total packets | Discarded packets |
| A | 0 | 18809 | 2 |
| B | 0 | 18736 | 1 |
| C | 0 | 23810 | 1 |
| D | 0 | 21919 | 1 |
| Mode M9 | |||
|---|---|---|---|
| Quadrant | BADHDUFLAG | Total packets | Discarded packets |
| A | 0 | 4 | 0 |
| B | 0 | 4 | 0 |
| C | 0 | 4 | 0 |
| D | 0 | 4 | 0 |
| Quadrant | Total seconds | Saturated seconds | Saturation percentage |
|---|---|---|---|
| A | 8358 | 71 | 0.849486% |
| B | 8359 | 192 | 2.296925% |
| C | 8359 | 200 | 2.392631% |
| D | 8359 | 318 | 3.804283% |
Noise dominated data is calculated using 1-second bins in cleaned event files. If a bin has >2000 counts, and if more than 50% of those come from <1% of pixels, then it is considered to be noise-dominated and hence unusable.
| Quadrant | # 1 sec bins | Bins with >0 counts | Bins with >2000 counts | High rate bins dominated by noise | Noise dominated (total time) | Noise dominated (detector-on time) | Marked lightcurve |
|---|---|---|---|---|---|---|---|
| A | 8733 | 8359 | 40 | 40 | 0.46% | 0.48% | 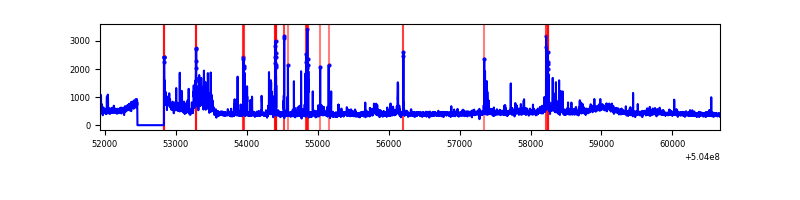 |
| B | 8734 | 8360 | 96 | 96 | 1.10% | 1.15% | 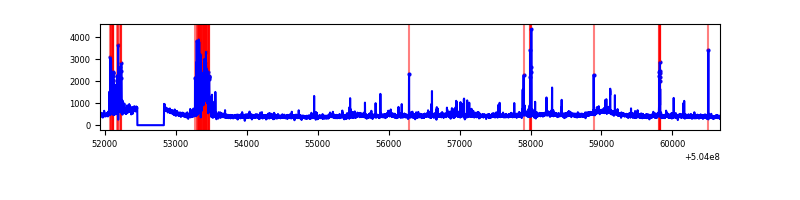 |
| C | 8734 | 8360 | 175 | 175 | 2.00% | 2.09% | 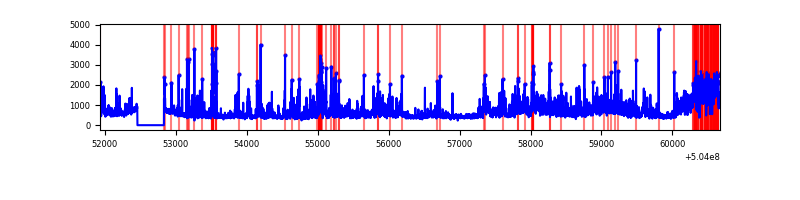 |
| D | 8734 | 8360 | 249 | 249 | 2.85% | 2.98% | 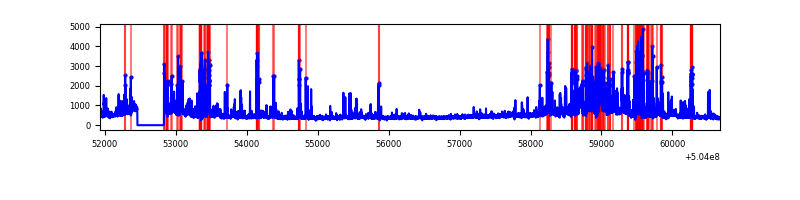 |
Top three noisy pixels from each quadrant. If the there are fewer than three noisy pixels in the level2.evt file, extra rows are filled as -1
| Pixel properties | Quadrant properties | ||||||
|---|---|---|---|---|---|---|---|
| Quadrant | DetID | PixID | Counts | Sigma | Mean | Median | Sigma |
| A | 0 | 8 | 247378 | 1098.26 | 902 | 878 | 224.4 |
| A | 12 | 115 | 236471 | 1049.66 | 902 | 878 | 224.4 |
| A | 3 | 78 | 58672 | 257.49 | 902 | 878 | 224.4 |
| B | 5 | 185 | 428520 | 2234.52 | 890 | 854 | 191.4 |
| B | 0 | 199 | 110120 | 570.91 | 890 | 854 | 191.4 |
| B | 10 | 247 | 62063 | 319.81 | 890 | 854 | 191.4 |
| C | 9 | 38 | 1755257 | 7308.11 | 881 | 873 | 240.1 |
| C | 12 | 252 | 184609 | 765.38 | 881 | 873 | 240.1 |
| C | 12 | 249 | 172761 | 716.02 | 881 | 873 | 240.1 |
| D | 2 | 249 | 530767 | 2148.66 | 872 | 834 | 246.6 |
| D | 11 | 129 | 396058 | 1602.47 | 872 | 834 | 246.6 |
| D | 15 | 107 | 220617 | 891.13 | 872 | 834 | 246.6 |
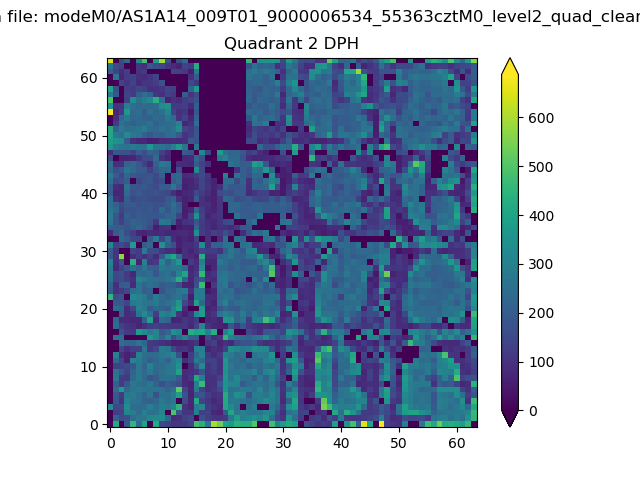
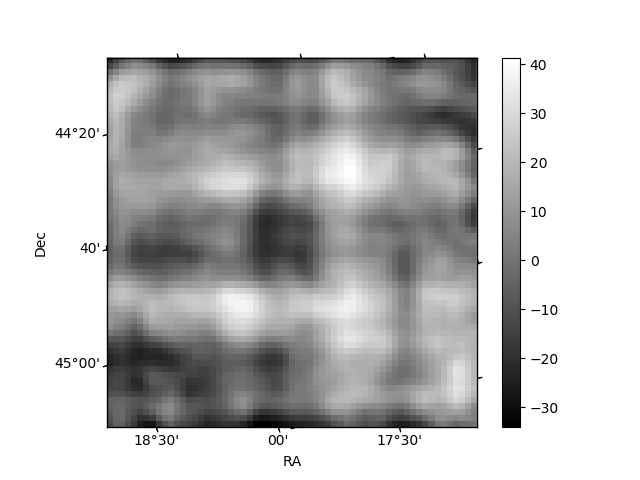
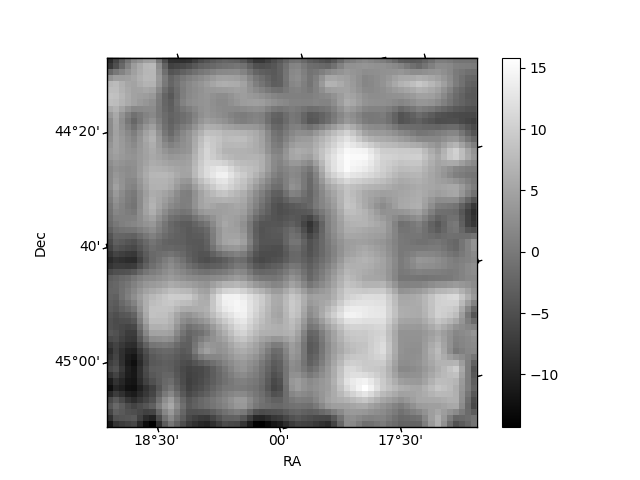
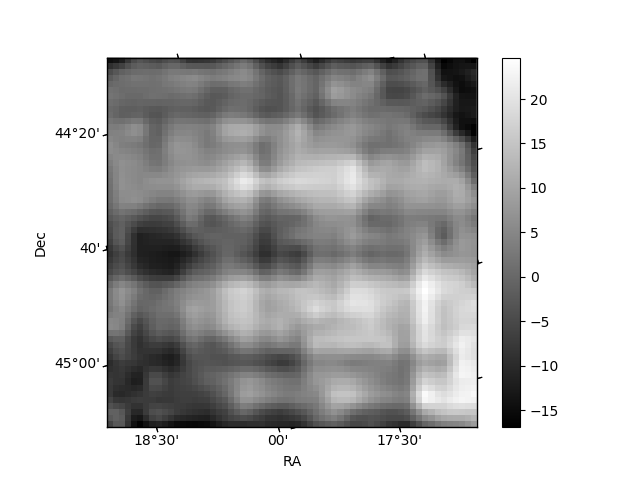
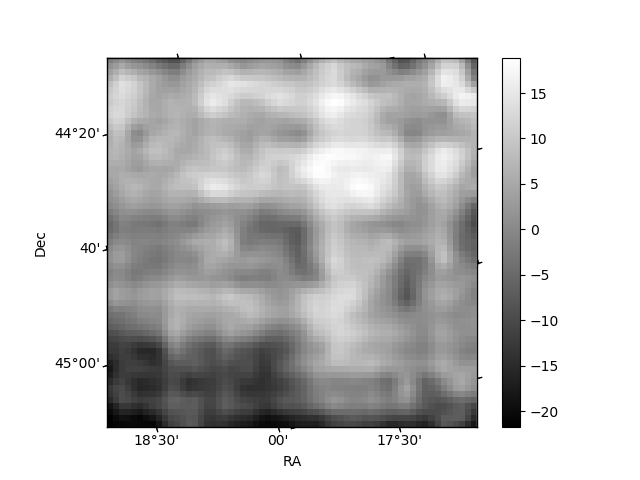
Histogram calculated using DETX and DETY for each event in the final _common_clean file
| Quadrant A | 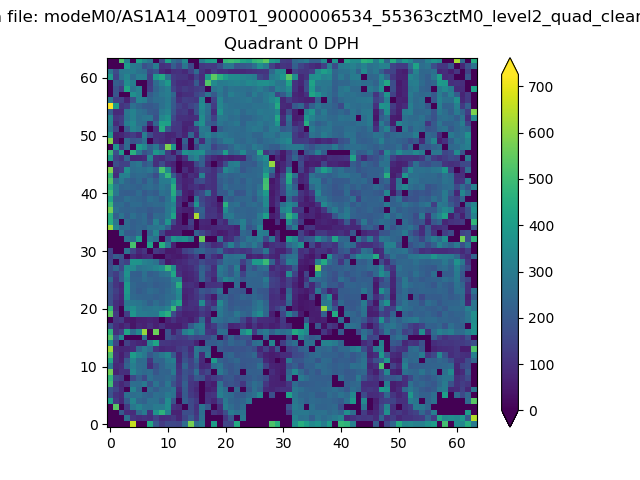 |
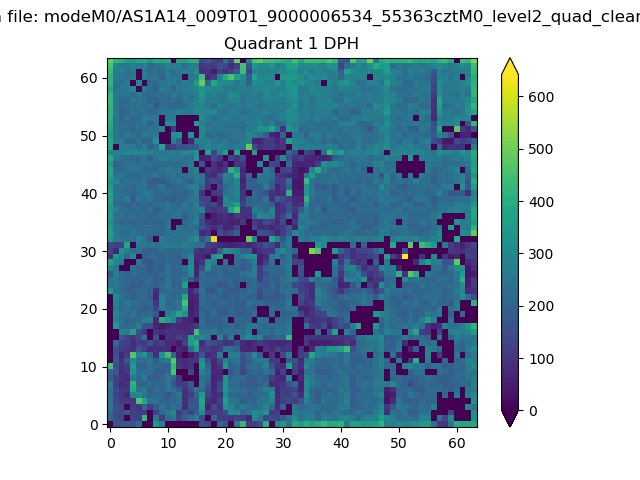 |
Quadrant B |
|---|---|---|---|
| Quadrant D | 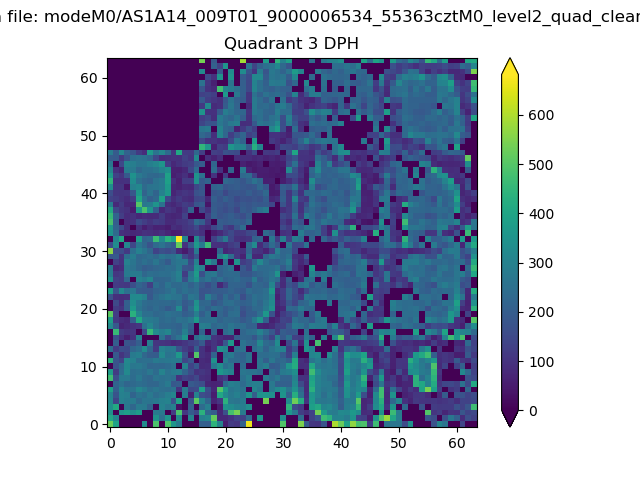 |
 |
Quadrant C |
| Plot type | Count rate plots | Images |
|---|---|---|
| Comparison with Poisson distribution Blue bars denote a histogram of data divided into 1 sec bins. Red curve is a Poisson curve with rate = median count rate of data. |
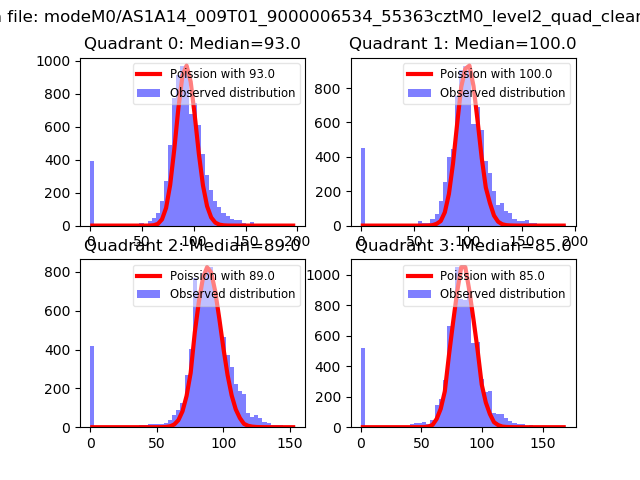 |
 |
| Quadrant-wise count rates Data is divided into 100 sec bins |
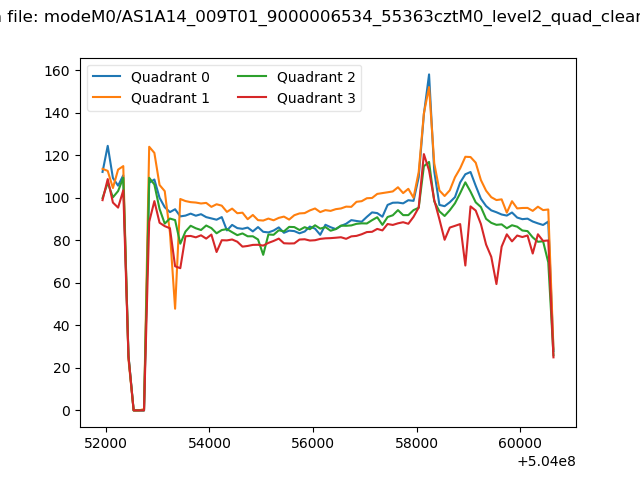 |
|
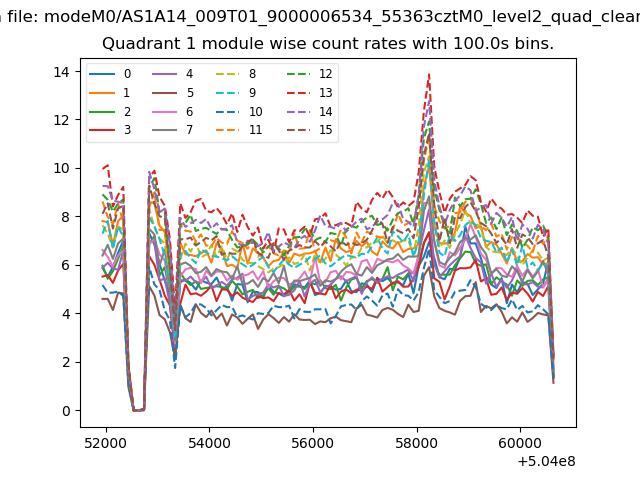
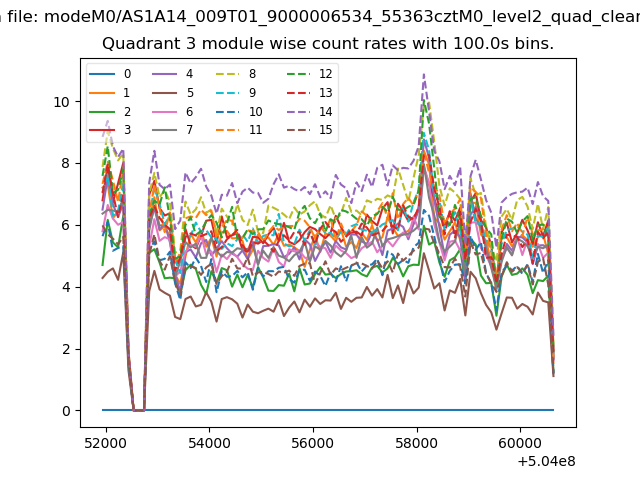
| Module-wise count rates for Quadrant A Data is divided into 100 sec bins |
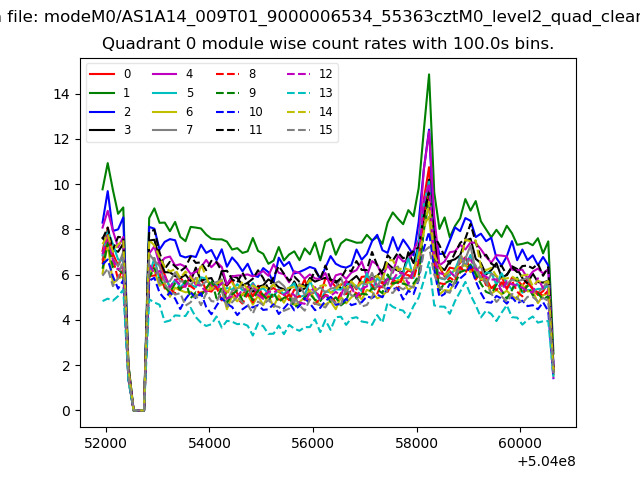 |
 |
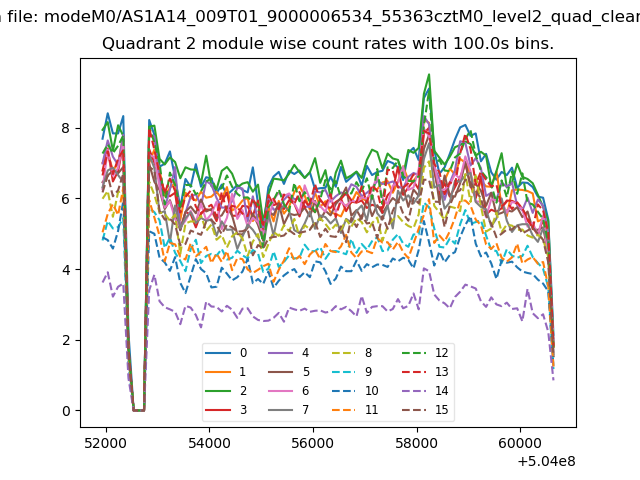
| Module-wise count rates for Quadrant B Data is divided into 100 sec bins |
 |
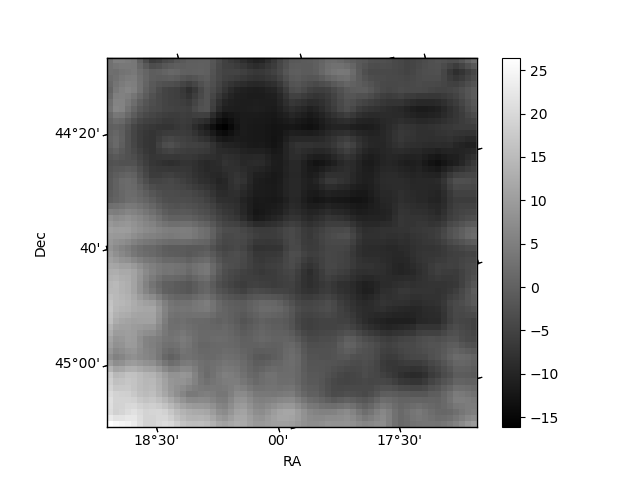 |
| Module-wise count rates for Quadrant C Data is divided into 100 sec bins |
 |
 |
| Module-wise count rates for Quadrant D Data is divided into 100 sec bins |
 |
 |
| Parameter | Plot |
|---|---|
| CZT HV Monitor | 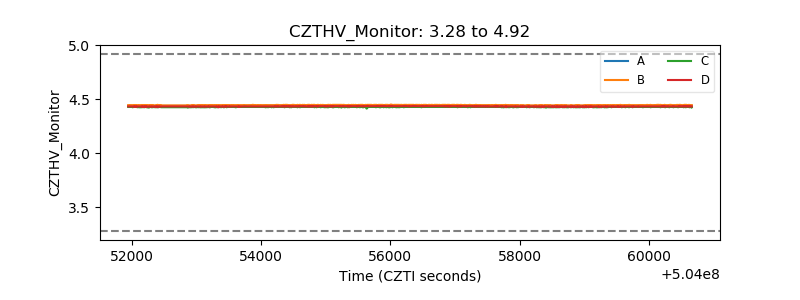 |
| D_VDD | 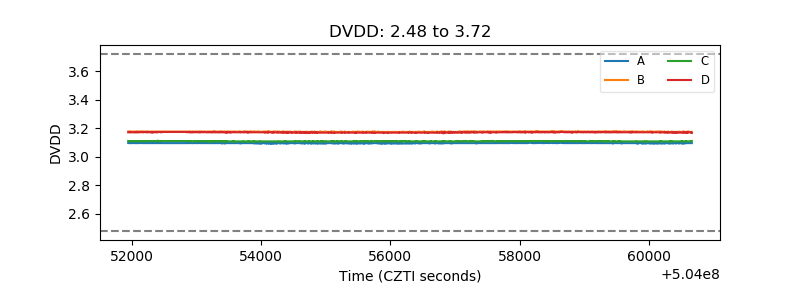 |
| Temperature 1 | 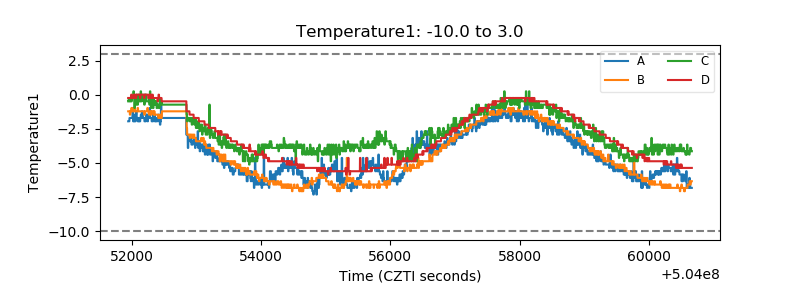 |
| Veto HV Monitor | 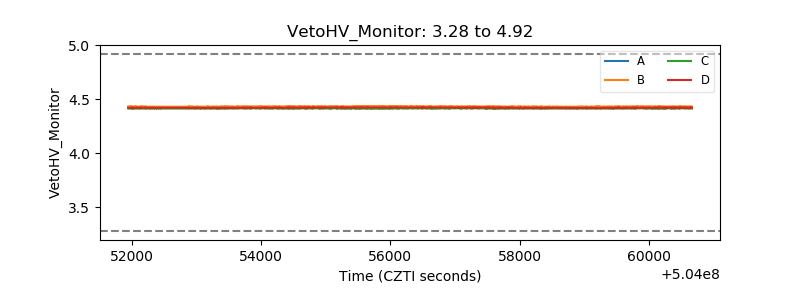 |
| Veto LLD | 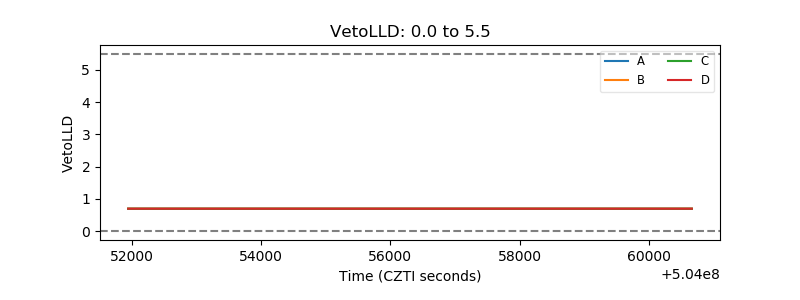 |
| Alpha Counter | 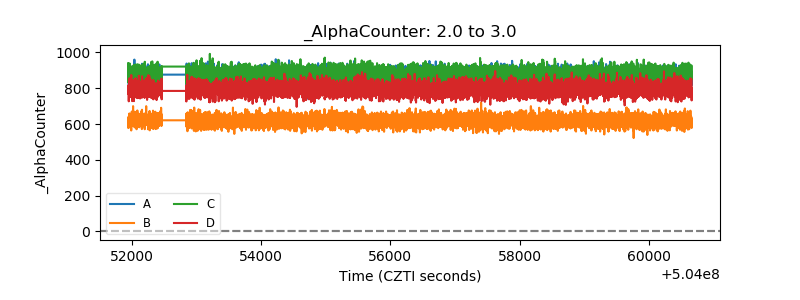 |
| _CPM_Rate | 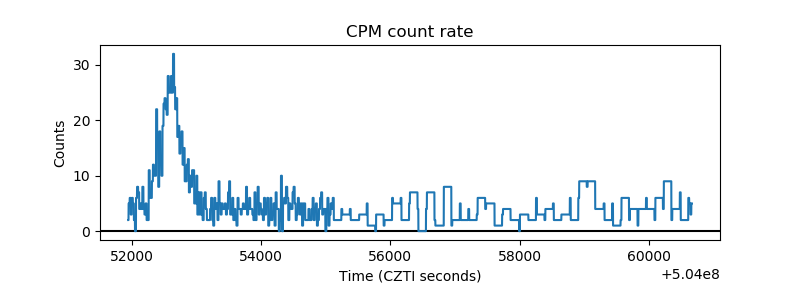 |
| CZT Counter | 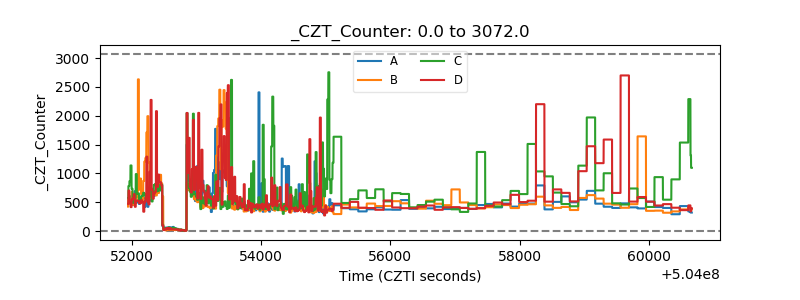 |
| +2.5 Volts monitor |  |
| +5 Volts monitor |  |
| _ROLL_ROT | 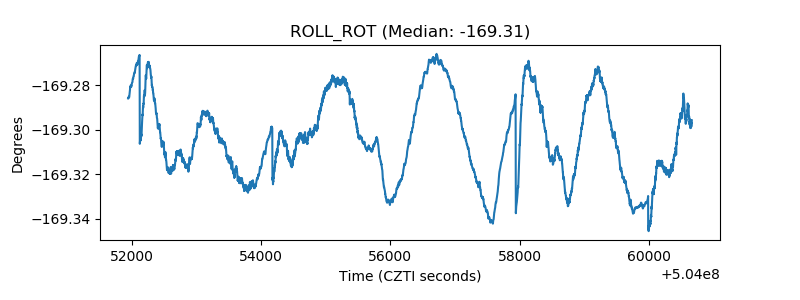 |
| _Roll_DEC | 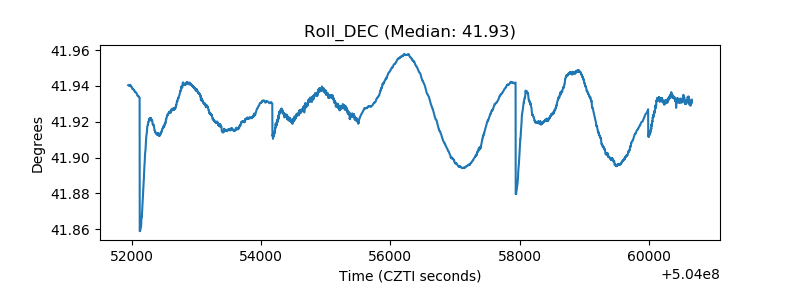 |
| _Roll_RA | 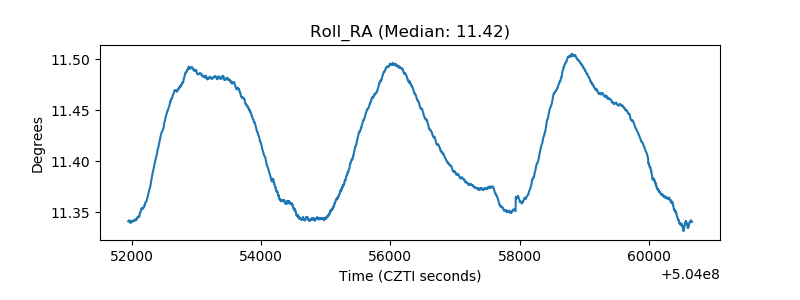 |
| Veto Counter | 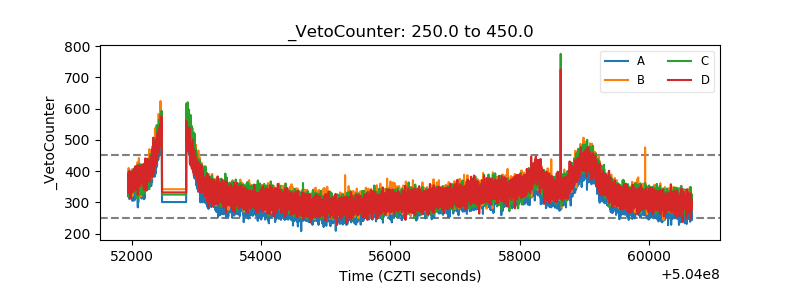 |