| Param | Original file | Final file |
|---|---|---|
| Filename | modeM0/AS1A14_009T01_9000006534_55364cztM0_level2.fits | modeM0/AS1A14_009T01_9000006534_55364cztM0_level2_quad_clean.evt |
| Size (bytes) | 545,618,880 | 123,431,040 |
| Size | 520.3 MB | 117.7 MB |
| Events in quadrant A | 3,849,387 | 812,738 |
| Events in quadrant B | 3,999,219 | 857,944 |
| Events in quadrant C | 5,649,011 | 767,072 |
| Events in quadrant D | 6,033,095 | 703,609 |
| Mode SS | |||
|---|---|---|---|
| Quadrant | BADHDUFLAG | Total packets | Discarded packets |
| A | 0 | 172 | 0 |
| B | 0 | 172 | 0 |
| C | 0 | 172 | 0 |
| D | 0 | 172 | 0 |
| Mode M0 | |||
|---|---|---|---|
| Quadrant | BADHDUFLAG | Total packets | Discarded packets |
| A | 0 | 17908 | 0 |
| B | 0 | 18279 | 0 |
| C | 0 | 22972 | 0 |
| D | 0 | 24277 | 0 |
| Quadrant | Total seconds | Saturated seconds | Saturation percentage |
|---|---|---|---|
| A | 8580 | 14 | 0.163170% |
| B | 8580 | 77 | 0.897436% |
| C | 8581 | 169 | 1.969467% |
| D | 8581 | 474 | 5.523832% |
Noise dominated data is calculated using 1-second bins in cleaned event files. If a bin has >2000 counts, and if more than 50% of those come from <1% of pixels, then it is considered to be noise-dominated and hence unusable.
| Quadrant | # 1 sec bins | Bins with >0 counts | Bins with >2000 counts | High rate bins dominated by noise | Noise dominated (total time) | Noise dominated (detector-on time) | Marked lightcurve |
|---|---|---|---|---|---|---|---|
| A | 8580 | 8580 | 8 | 8 | 0.09% | 0.09% | 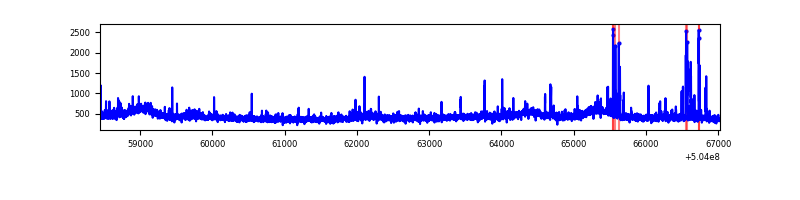 |
| B | 8580 | 8580 | 56 | 56 | 0.65% | 0.65% | 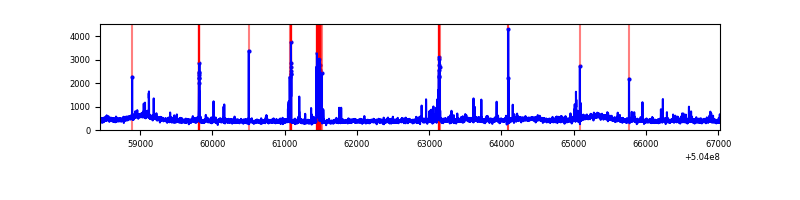 |
| C | 8581 | 8581 | 180 | 180 | 2.10% | 2.10% | 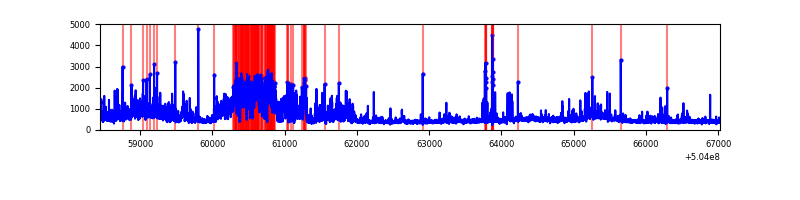 |
| D | 8581 | 8581 | 382 | 382 | 4.45% | 4.45% | 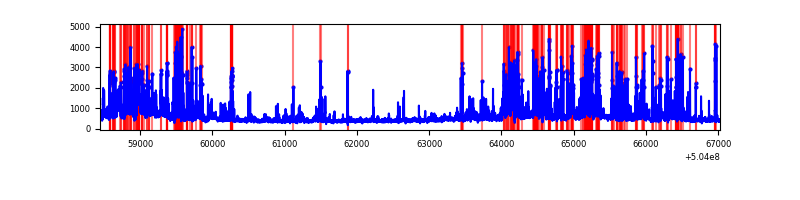 |
Top three noisy pixels from each quadrant. If the there are fewer than three noisy pixels in the level2.evt file, extra rows are filled as -1
| Pixel properties | Quadrant properties | ||||||
|---|---|---|---|---|---|---|---|
| Quadrant | DetID | PixID | Counts | Sigma | Mean | Median | Sigma |
| A | 3 | 78 | 116286 | 506.82 | 914 | 887 | 227.7 |
| A | 0 | 8 | 66314 | 287.35 | 914 | 887 | 227.7 |
| A | 7 | 243 | 27269 | 115.87 | 914 | 887 | 227.7 |
| B | 2 | 249 | 137557 | 703.18 | 905 | 871 | 194.4 |
| B | 0 | 199 | 132576 | 677.55 | 905 | 871 | 194.4 |
| B | 10 | 247 | 84438 | 429.91 | 905 | 871 | 194.4 |
| C | 9 | 38 | 1650165 | 6817.56 | 892 | 884 | 241.9 |
| C | 12 | 252 | 115775 | 474.92 | 892 | 884 | 241.9 |
| C | 12 | 249 | 109263 | 448.0 | 892 | 884 | 241.9 |
| D | 11 | 129 | 694039 | 2806.15 | 872 | 834 | 247.0 |
| D | 15 | 107 | 592428 | 2394.82 | 872 | 834 | 247.0 |
| D | 2 | 249 | 542191 | 2191.46 | 872 | 834 | 247.0 |
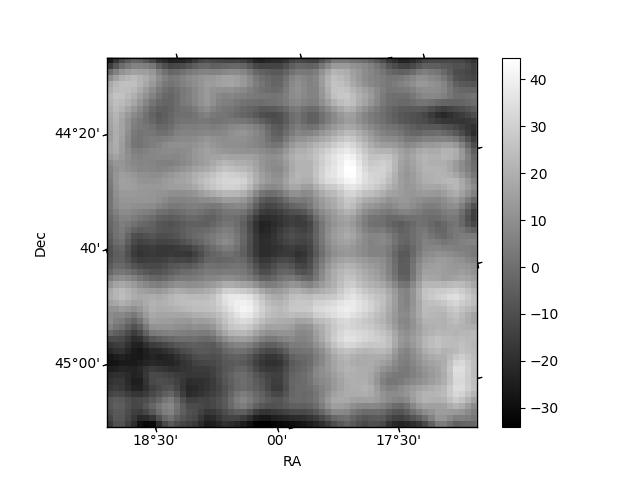
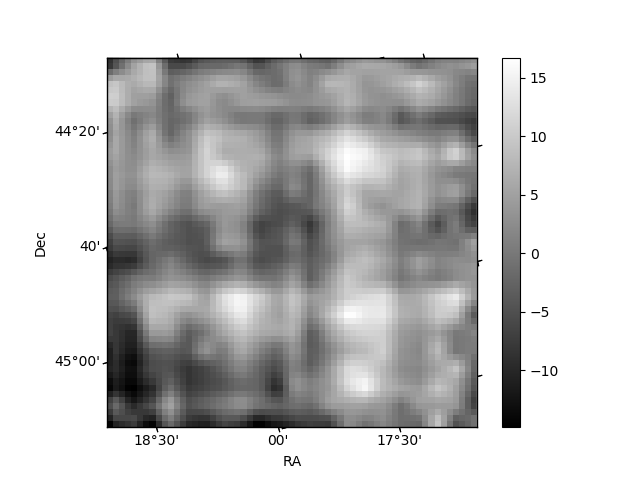
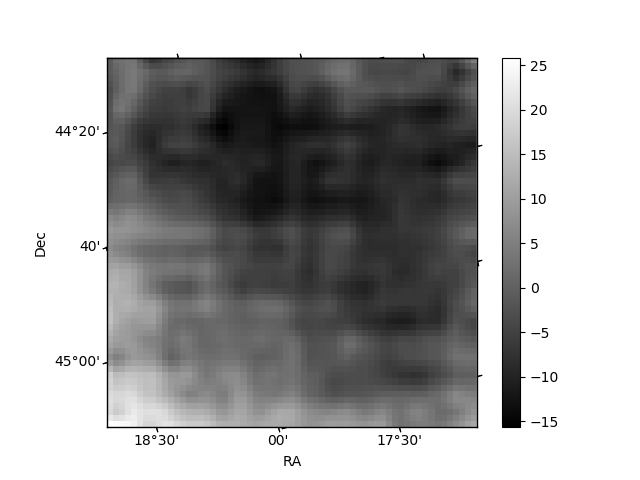
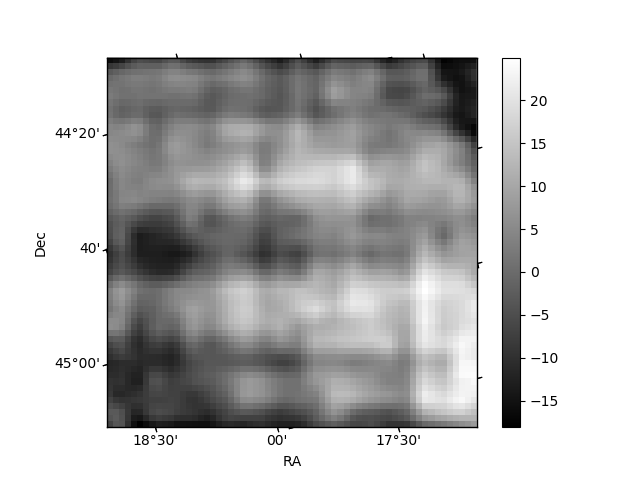
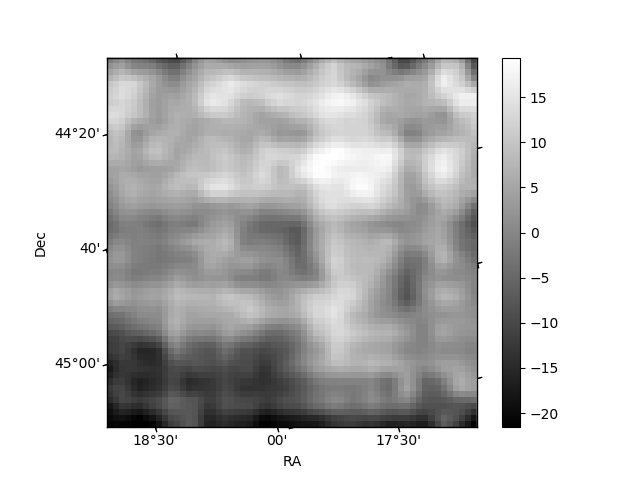
Histogram calculated using DETX and DETY for each event in the final _common_clean file
| Quadrant A | 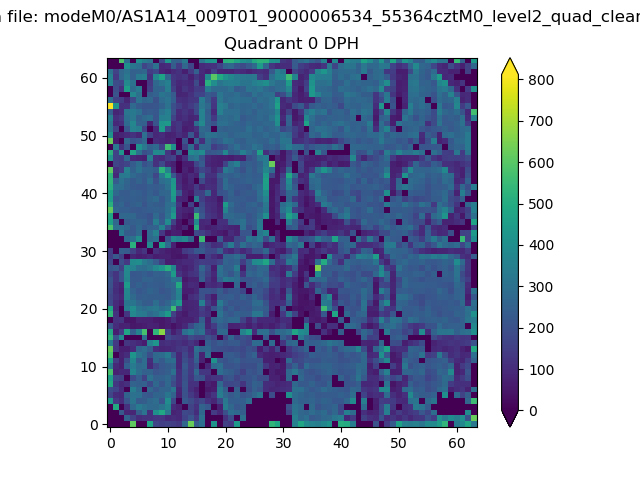 |
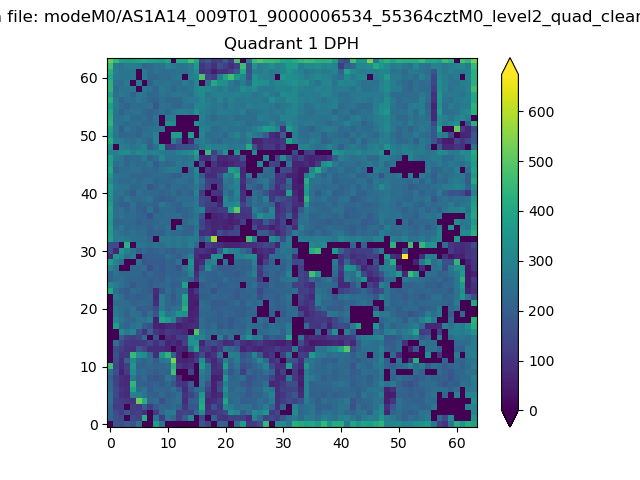 |
Quadrant B |
|---|---|---|---|
| Quadrant D | 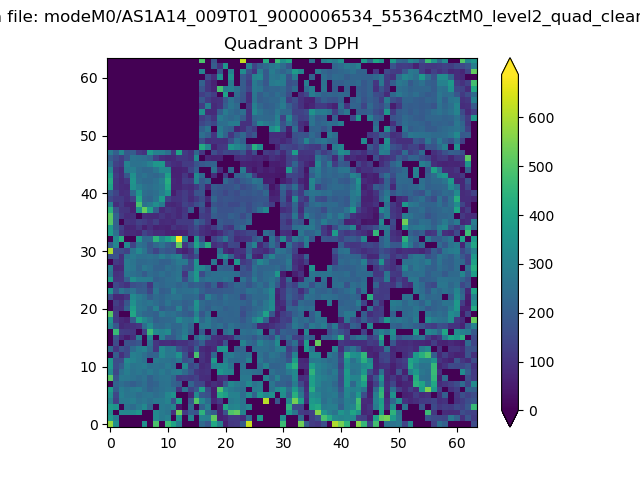 |
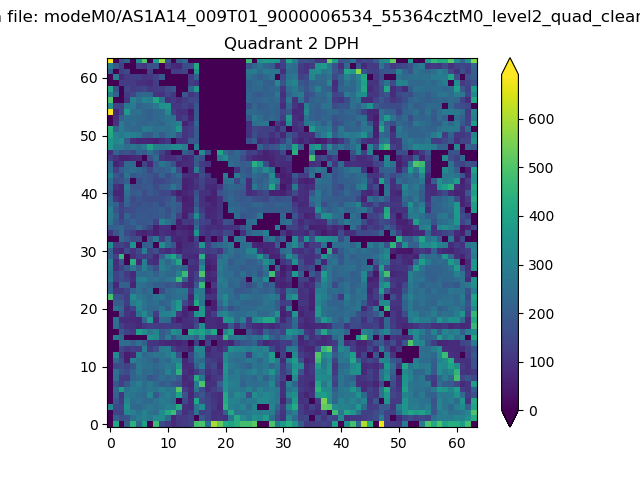 |
Quadrant C |
| Plot type | Count rate plots | Images |
|---|---|---|
| Comparison with Poisson distribution Blue bars denote a histogram of data divided into 1 sec bins. Red curve is a Poisson curve with rate = median count rate of data. |
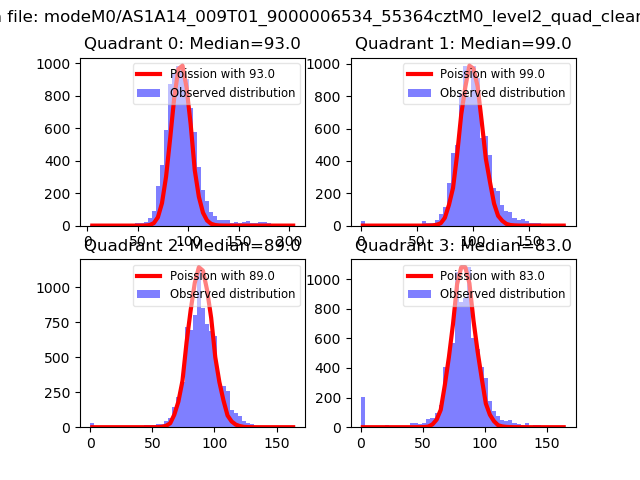 |
 |
| Quadrant-wise count rates Data is divided into 100 sec bins |
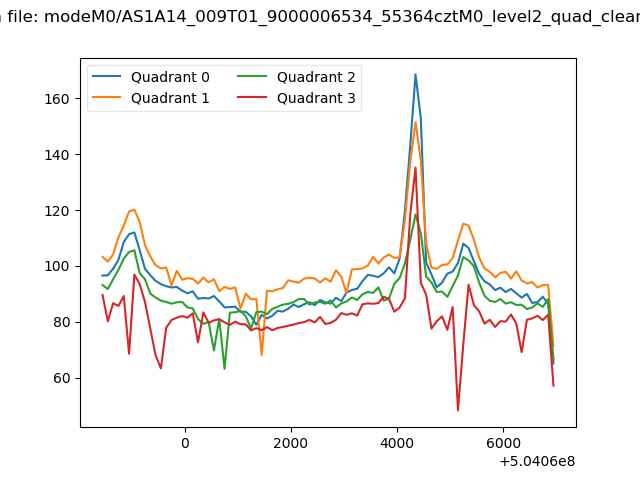 |
|
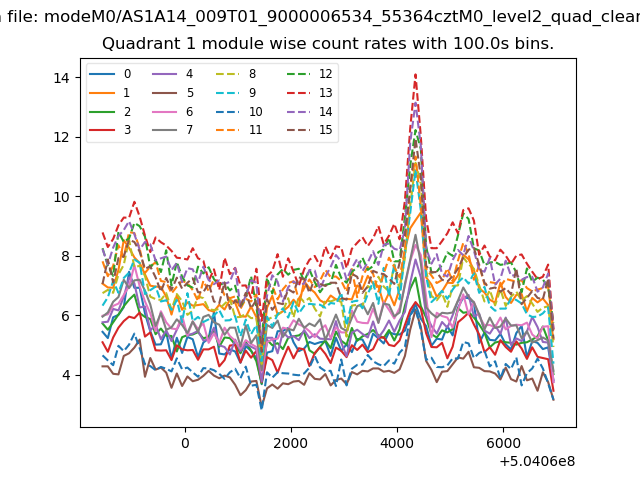
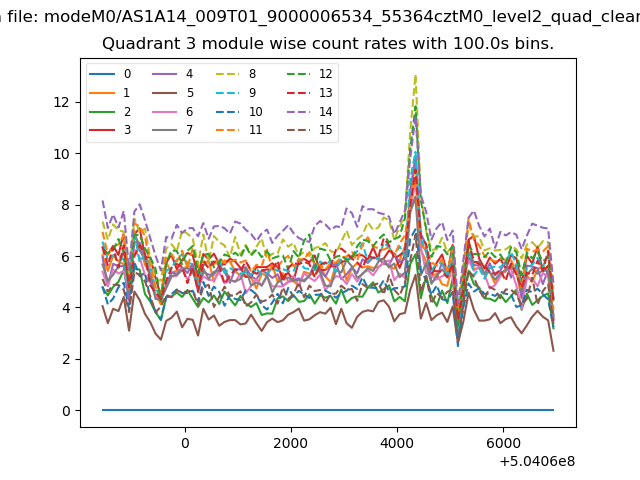
| Module-wise count rates for Quadrant A Data is divided into 100 sec bins |
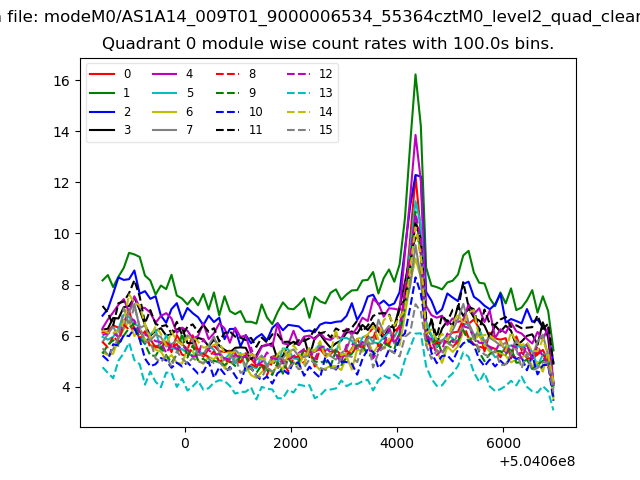 |
 |
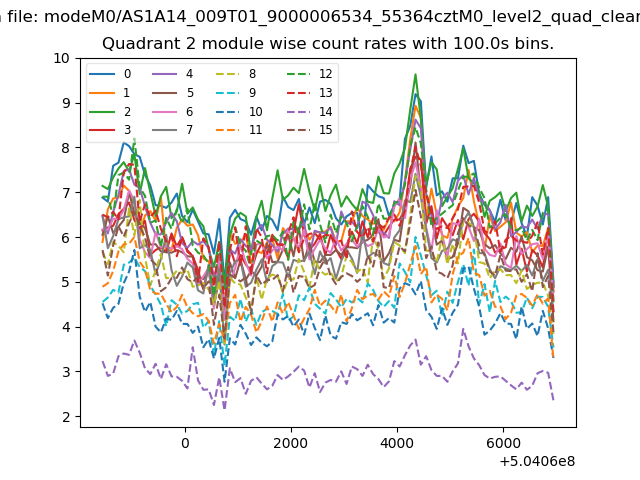
| Module-wise count rates for Quadrant B Data is divided into 100 sec bins |
 |
 |
| Module-wise count rates for Quadrant C Data is divided into 100 sec bins |
 |
 |
| Module-wise count rates for Quadrant D Data is divided into 100 sec bins |
 |
 |
| Parameter | Plot |
|---|---|
| CZT HV Monitor | 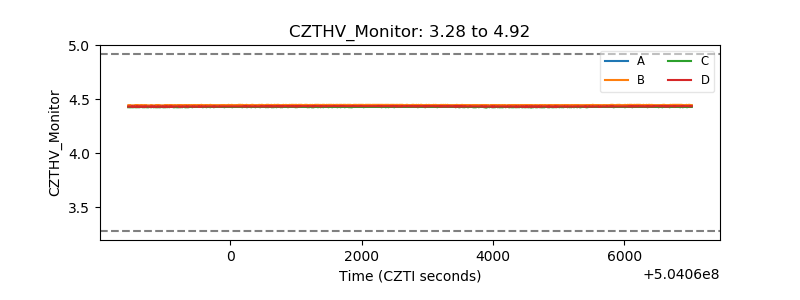 |
| D_VDD | 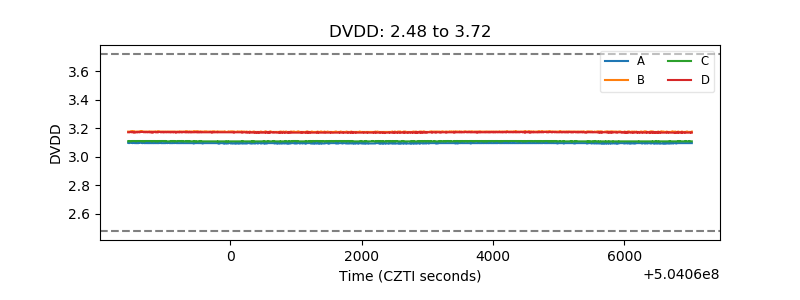 |
| Temperature 1 | 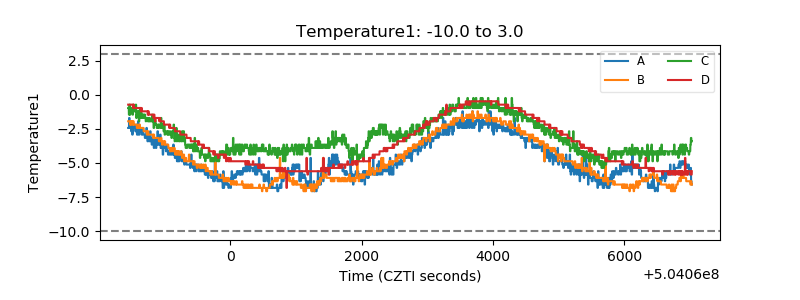 |
| Veto HV Monitor | 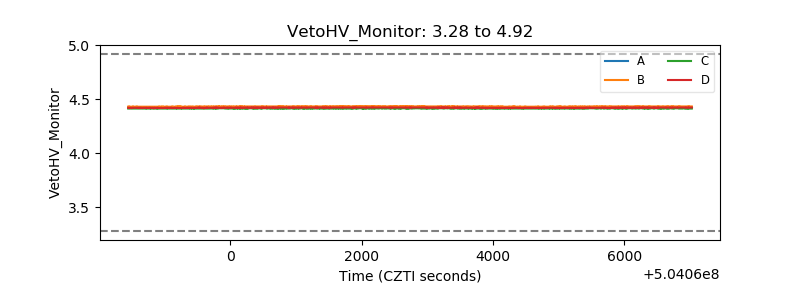 |
| Veto LLD | 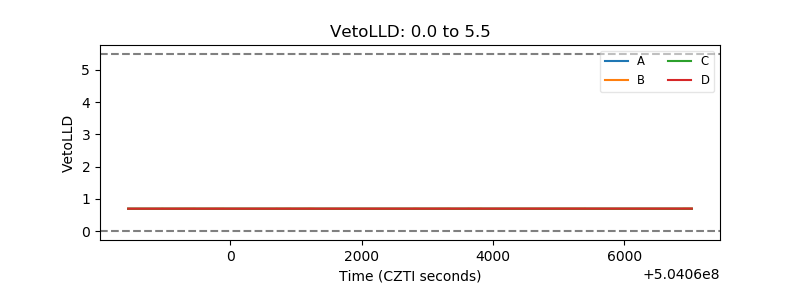 |
| Alpha Counter | 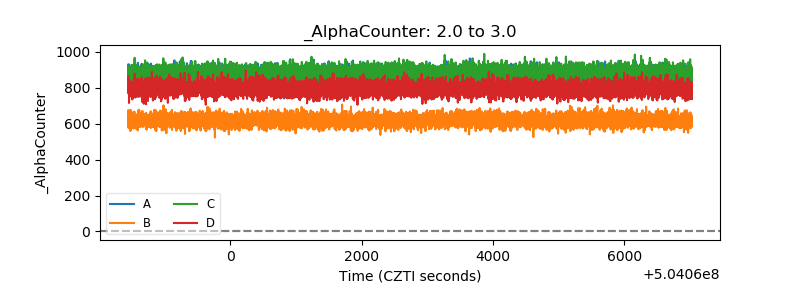 |
| _CPM_Rate | 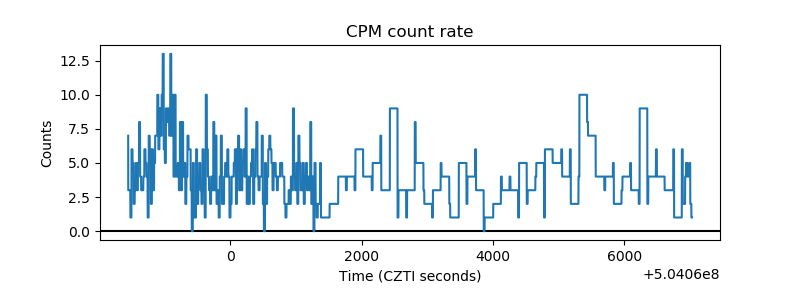 |
| CZT Counter | 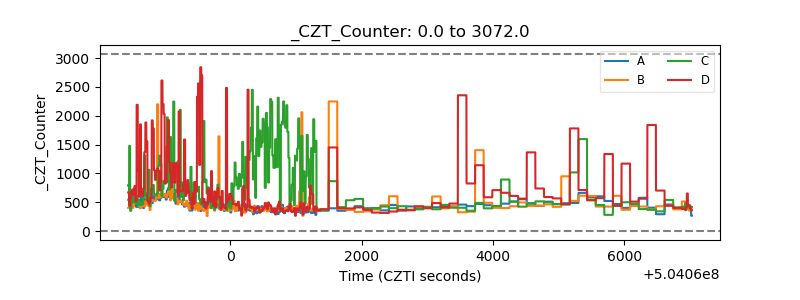 |
| +2.5 Volts monitor |  |
| +5 Volts monitor | 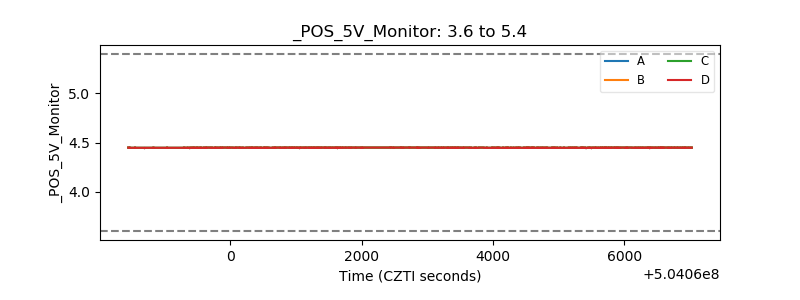 |
| _ROLL_ROT | 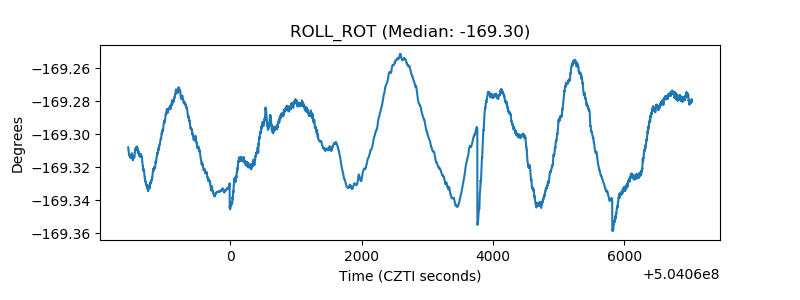 |
| _Roll_DEC | 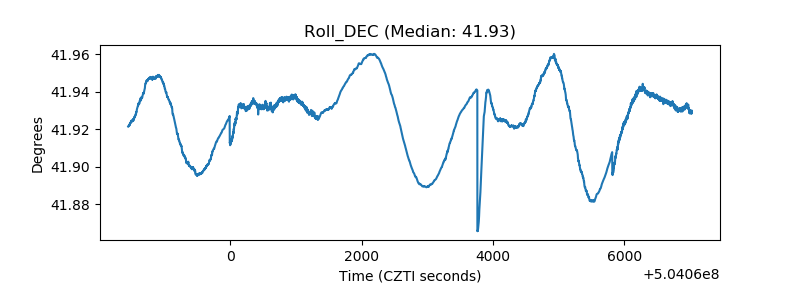 |
| _Roll_RA | 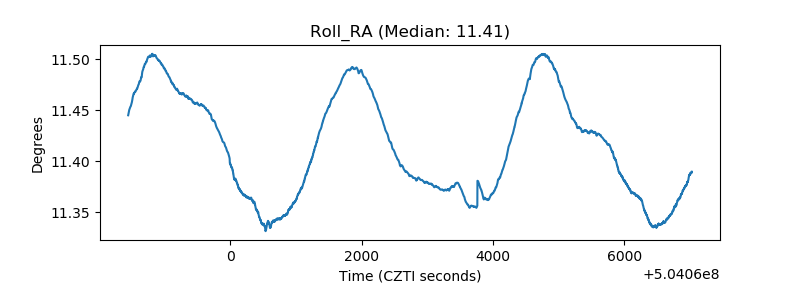 |
| Veto Counter | 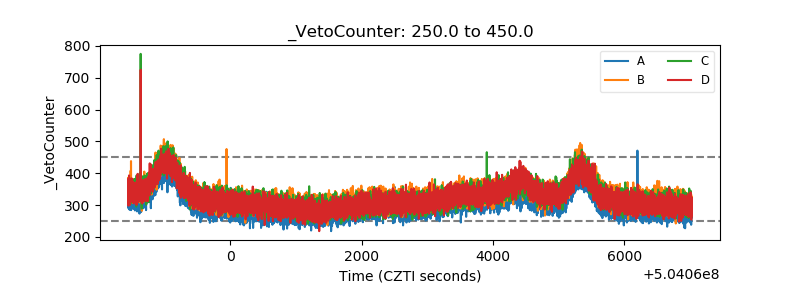 |