| Param | Original file | Final file |
|---|---|---|
| Filename | modeM0/AS1A14_009T01_9000006534_55367cztM0_level2.fits | modeM0/AS1A14_009T01_9000006534_55367cztM0_level2_quad_clean.evt |
| Size (bytes) | 1,165,642,560 | 240,960,960 |
| Size | 1.1 GB | 229.8 MB |
| Events in quadrant A | 13,078,740 | 1,413,395 |
| Events in quadrant B | 7,991,045 | 1,703,063 |
| Events in quadrant C | 9,894,360 | 1,536,411 |
| Events in quadrant D | 10,826,937 | 1,434,486 |
| Mode SS | |||
|---|---|---|---|
| Quadrant | BADHDUFLAG | Total packets | Discarded packets |
| A | 0 | 352 | 0 |
| B | 0 | 352 | 0 |
| C | 0 | 352 | 0 |
| D | 0 | 352 | 0 |
| Mode M0 | |||
|---|---|---|---|
| Quadrant | BADHDUFLAG | Total packets | Discarded packets |
| A | 0 | 51709 | 1 |
| B | 0 | 36967 | 1 |
| C | 0 | 42300 | 1 |
| D | 0 | 44786 | 1 |
| Mode M9 | |||
|---|---|---|---|
| Quadrant | BADHDUFLAG | Total packets | Discarded packets |
| A | 0 | 3 | 0 |
| B | 0 | 3 | 0 |
| C | 0 | 3 | 0 |
| D | 0 | 3 | 0 |
| Quadrant | Total seconds | Saturated seconds | Saturation percentage |
|---|---|---|---|
| A | 17525 | 1799 | 10.265335% |
| B | 17525 | 265 | 1.512126% |
| C | 17525 | 339 | 1.934379% |
| D | 17525 | 512 | 2.921541% |
Noise dominated data is calculated using 1-second bins in cleaned event files. If a bin has >2000 counts, and if more than 50% of those come from <1% of pixels, then it is considered to be noise-dominated and hence unusable.
| Quadrant | # 1 sec bins | Bins with >0 counts | Bins with >2000 counts | High rate bins dominated by noise | Noise dominated (total time) | Noise dominated (detector-on time) | Marked lightcurve |
|---|---|---|---|---|---|---|---|
| A | 17850 | 17525 | 1241 | 1241 | 6.95% | 7.08% | 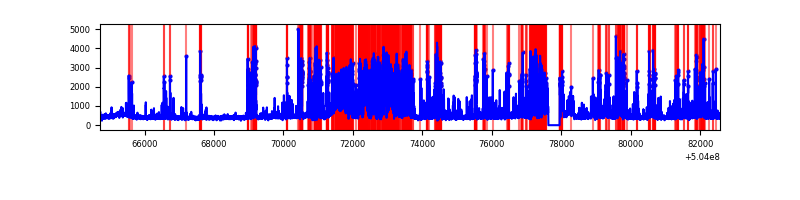 |
| B | 17850 | 17525 | 33 | 33 | 0.18% | 0.19% | 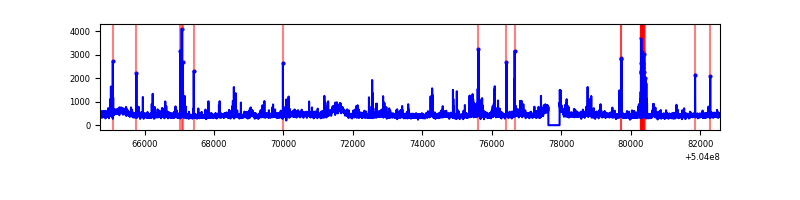 |
| C | 17850 | 17526 | 204 | 204 | 1.14% | 1.16% | 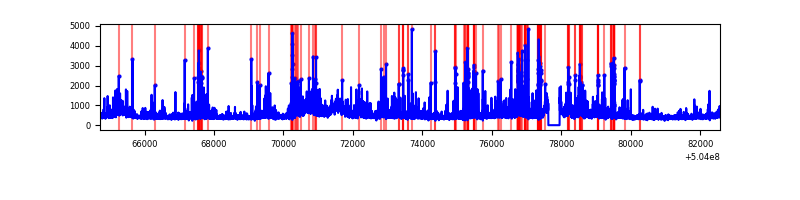 |
| D | 17850 | 17526 | 401 | 401 | 2.25% | 2.29% | 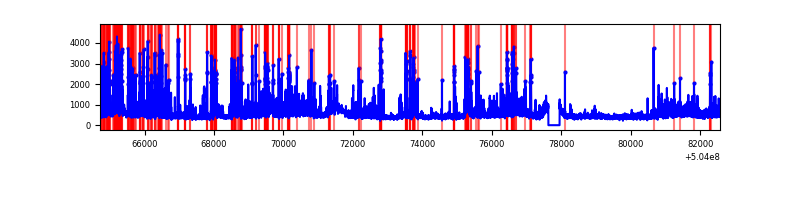 |
Top three noisy pixels from each quadrant. If the there are fewer than three noisy pixels in the level2.evt file, extra rows are filled as -1
| Pixel properties | Quadrant properties | ||||||
|---|---|---|---|---|---|---|---|
| Quadrant | DetID | PixID | Counts | Sigma | Mean | Median | Sigma |
| A | 4 | 159 | 3749966 | 8565.68 | 1773 | 1727 | 437.6 |
| A | 3 | 78 | 1309125 | 2987.74 | 1773 | 1727 | 437.6 |
| A | 0 | 8 | 811278 | 1850.03 | 1773 | 1727 | 437.6 |
| B | 0 | 199 | 327677 | 834.47 | 1831 | 1761 | 390.6 |
| B | 5 | 185 | 202062 | 512.85 | 1831 | 1761 | 390.6 |
| B | 10 | 247 | 74060 | 185.11 | 1831 | 1761 | 390.6 |
| C | 9 | 38 | 1194114 | 2446.11 | 1801 | 1789 | 487.4 |
| C | 13 | 3 | 668237 | 1367.25 | 1801 | 1789 | 487.4 |
| C | 12 | 252 | 461888 | 943.91 | 1801 | 1789 | 487.4 |
| D | 11 | 129 | 1350843 | 2691.65 | 1789 | 1707 | 501.2 |
| D | 2 | 249 | 364926 | 724.65 | 1789 | 1707 | 501.2 |
| D | 10 | 199 | 311205 | 617.48 | 1789 | 1707 | 501.2 |
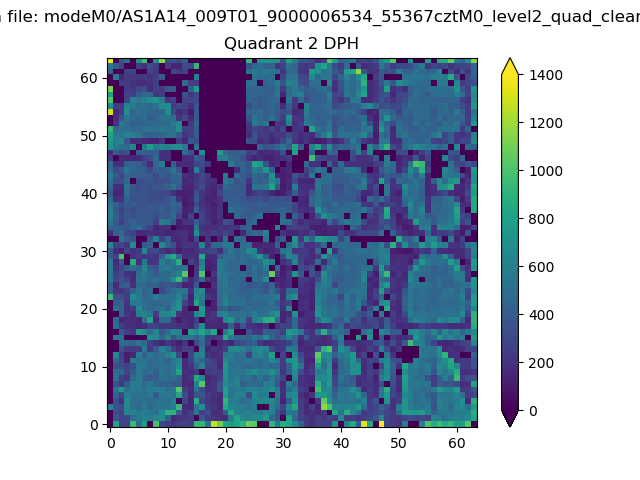
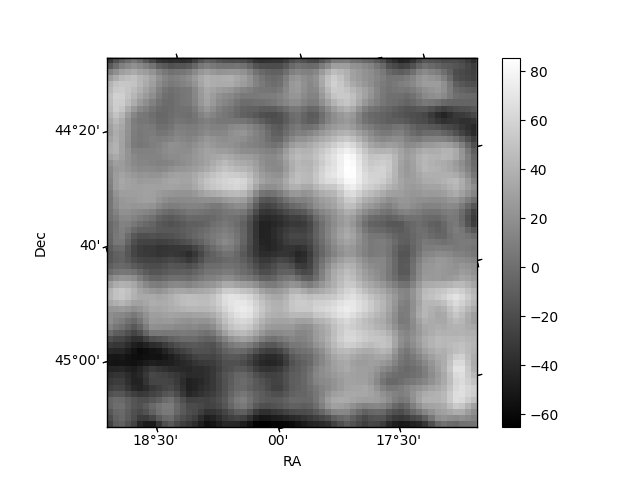
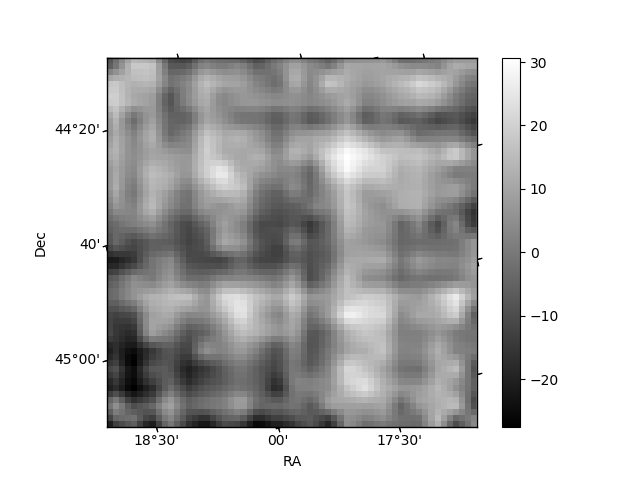
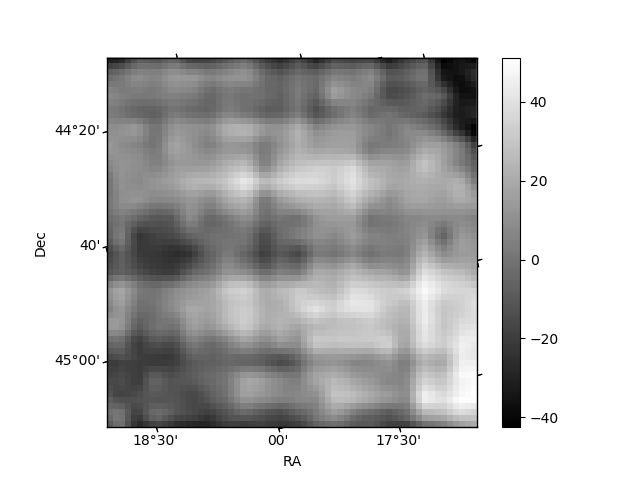
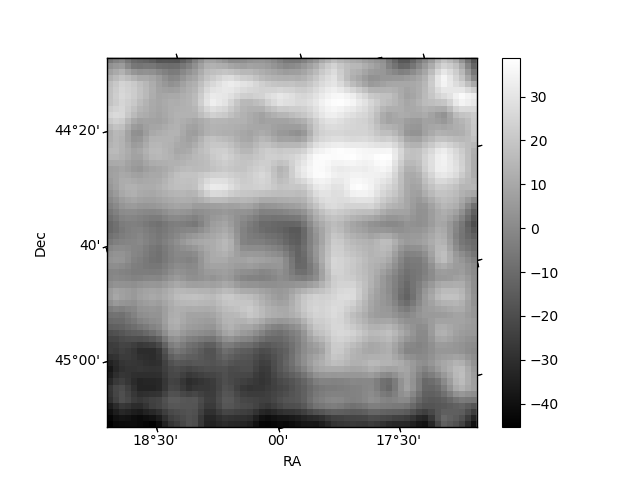
Histogram calculated using DETX and DETY for each event in the final _common_clean file
| Quadrant A | 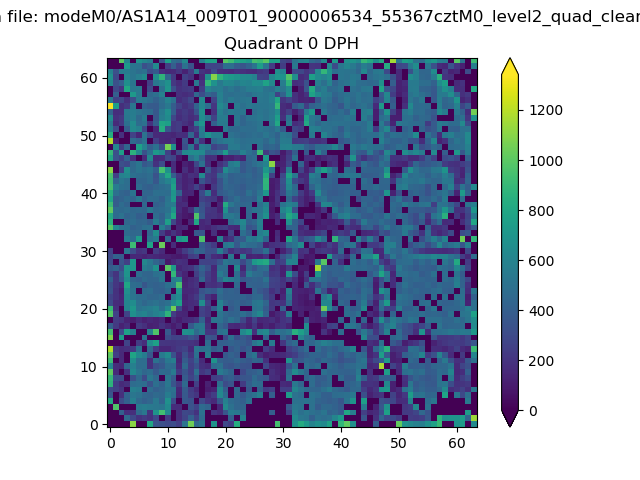 |
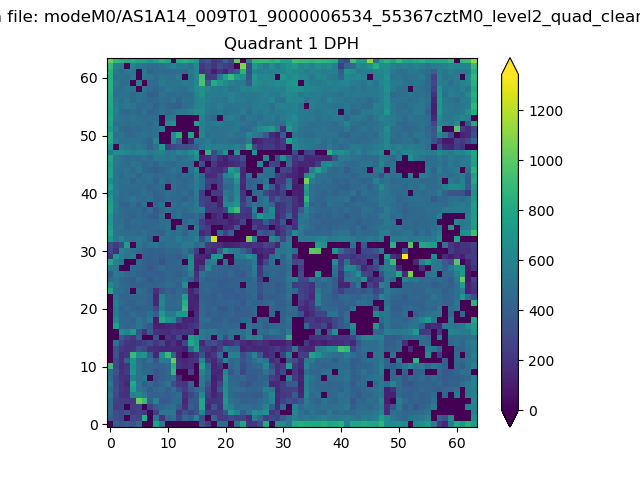 |
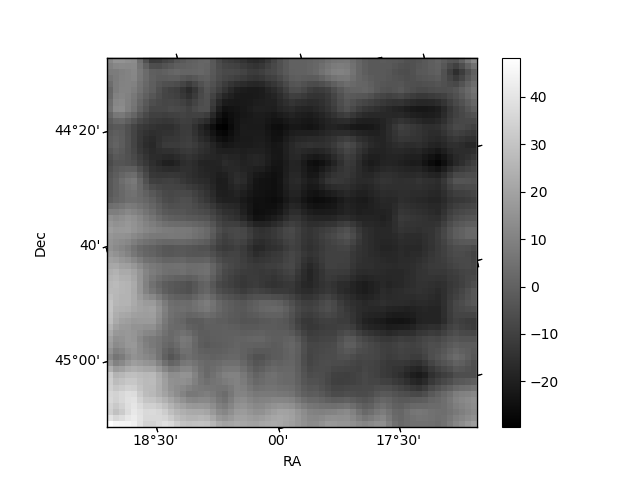
Quadrant B |
|---|---|---|---|
| Quadrant D | 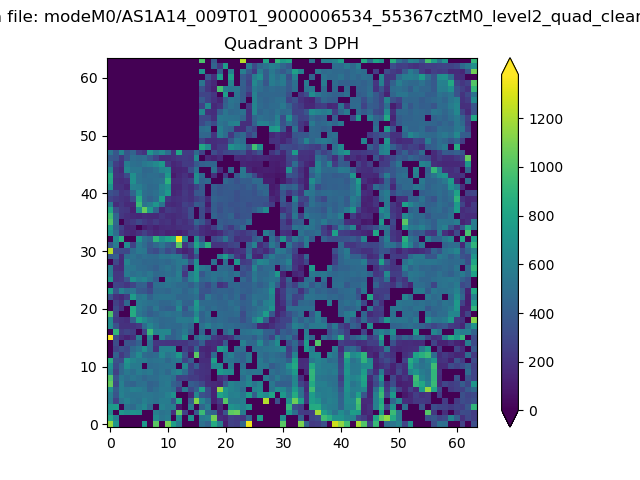 |
 |
Quadrant C |
| Plot type | Count rate plots | Images |
|---|---|---|
| Comparison with Poisson distribution Blue bars denote a histogram of data divided into 1 sec bins. Red curve is a Poisson curve with rate = median count rate of data. |
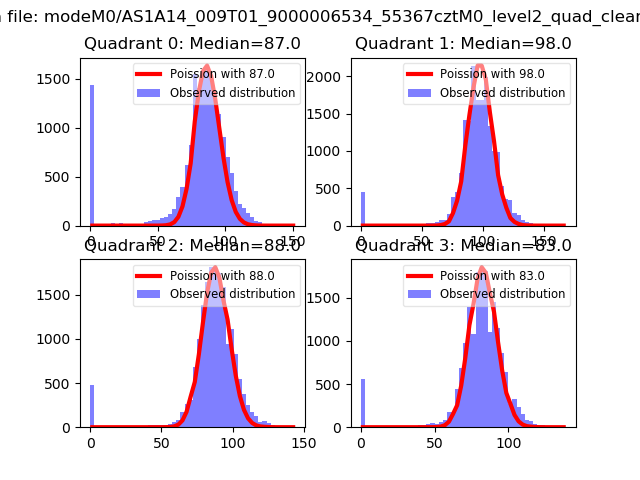 |
 |
| Quadrant-wise count rates Data is divided into 100 sec bins |
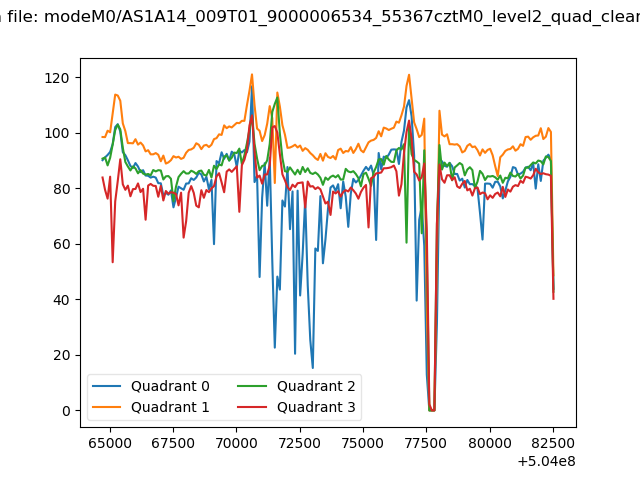 |
|
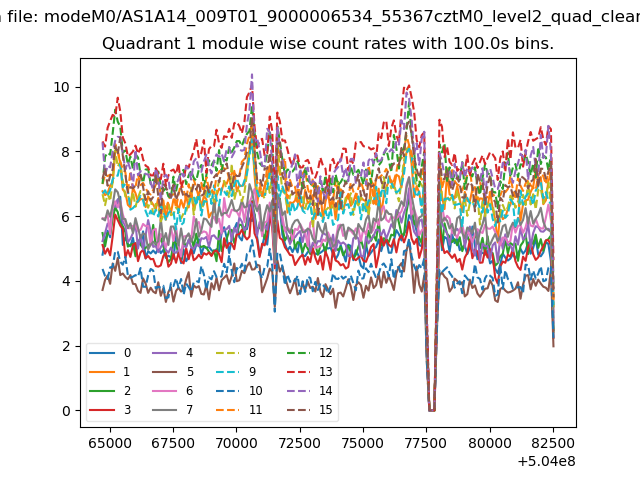
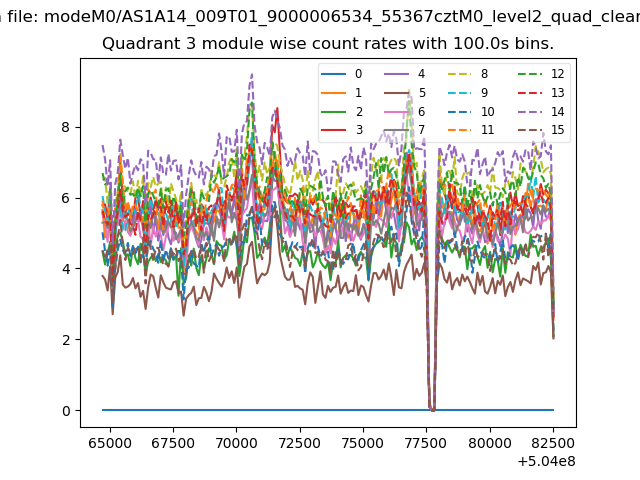
| Module-wise count rates for Quadrant A Data is divided into 100 sec bins |
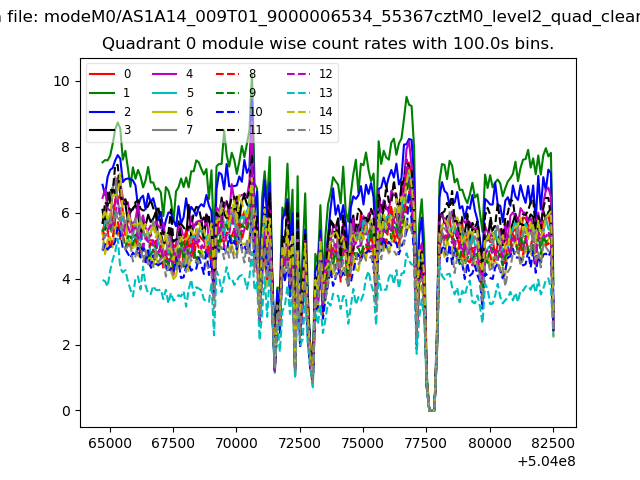 |
 |
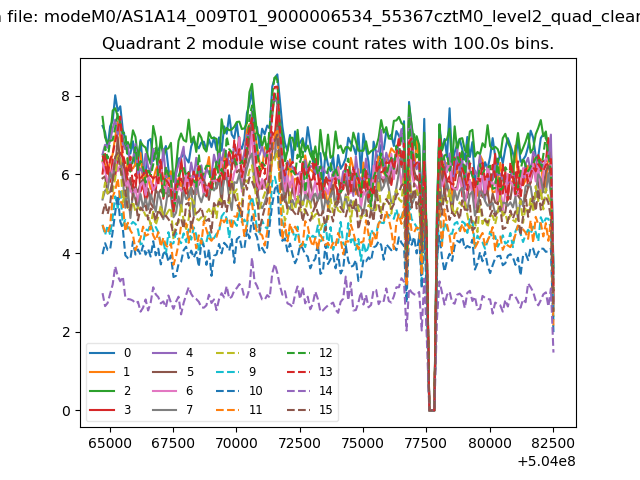
| Module-wise count rates for Quadrant B Data is divided into 100 sec bins |
 |
 |
| Module-wise count rates for Quadrant C Data is divided into 100 sec bins |
 |
 |
| Module-wise count rates for Quadrant D Data is divided into 100 sec bins |
 |
 |
| Parameter | Plot |
|---|---|
| CZT HV Monitor | 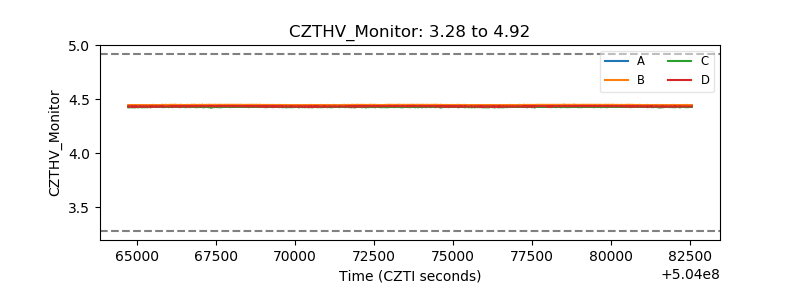 |
| D_VDD | 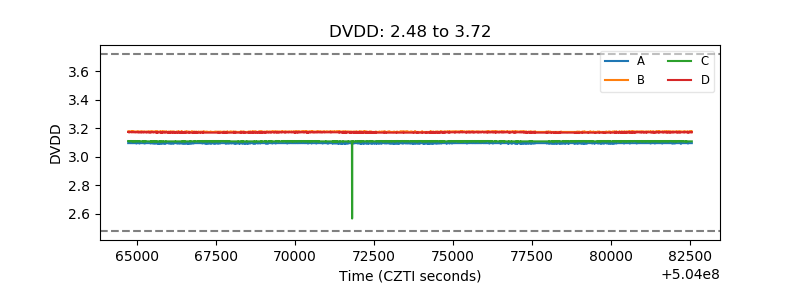 |
| Temperature 1 | 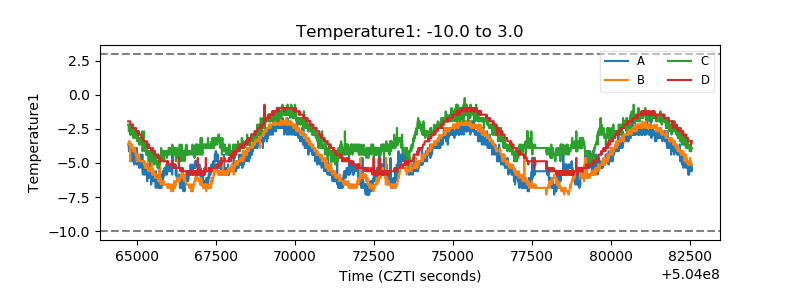 |
| Veto HV Monitor | 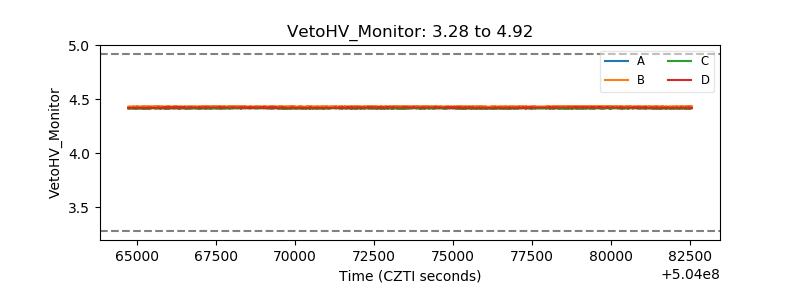 |
| Veto LLD | 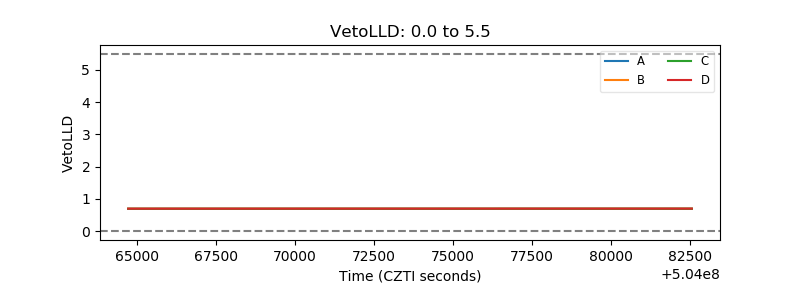 |
| Alpha Counter | 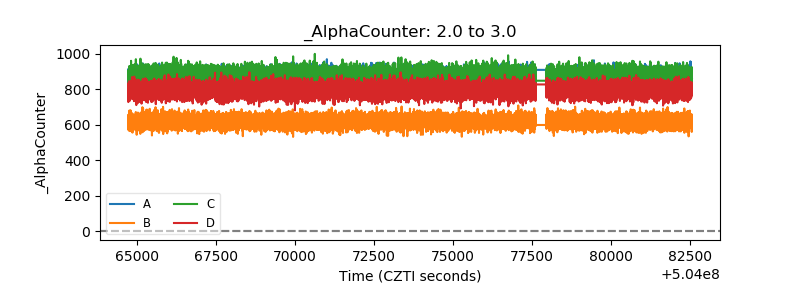 |
| _CPM_Rate | 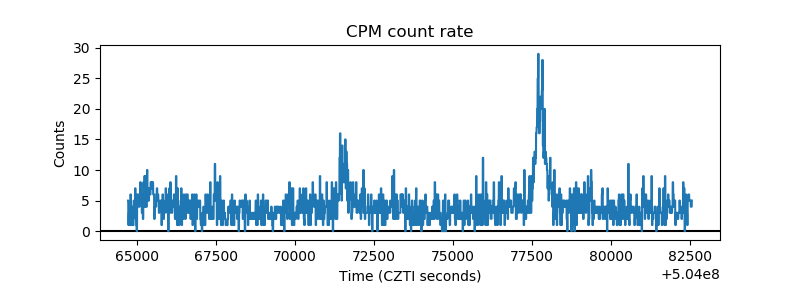 |
| CZT Counter | 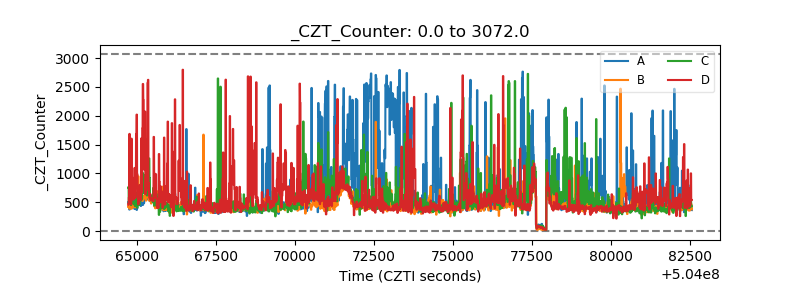 |
| +2.5 Volts monitor | 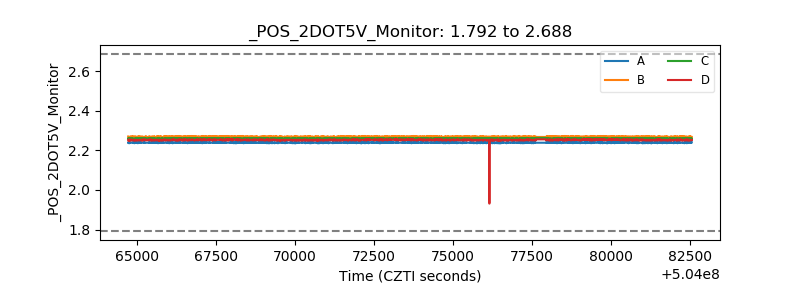 |
| +5 Volts monitor | 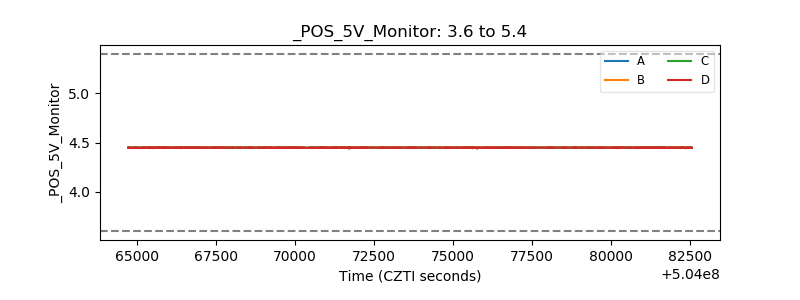 |
| _ROLL_ROT | 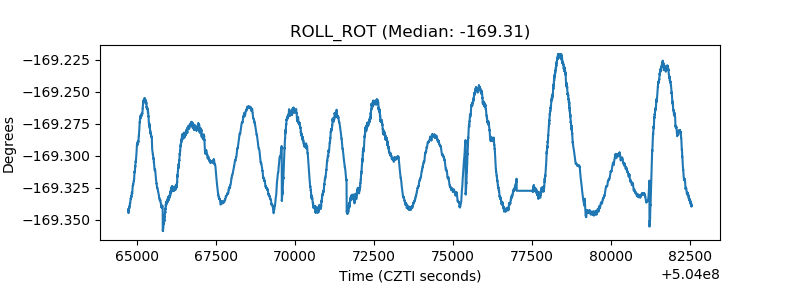 |
| _Roll_DEC | 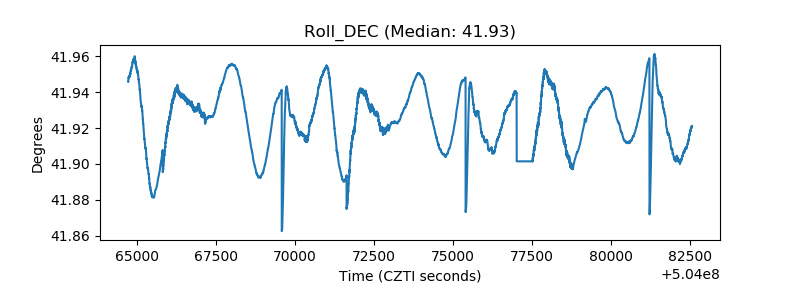 |
| _Roll_RA | 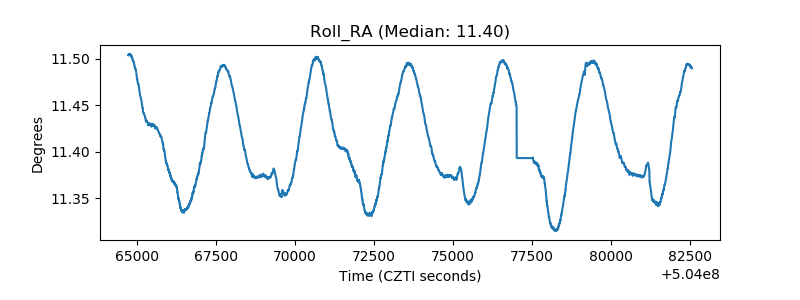 |
| Veto Counter | 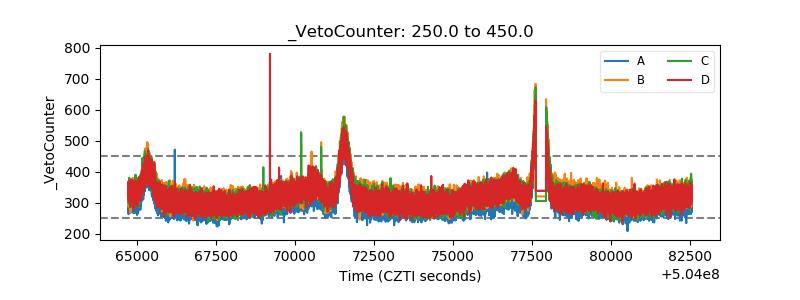 |