| Param | Original file | Final file |
|---|---|---|
| Filename | modeM0/AS1A14_009T01_9000006534_55368cztM0_level2.fits | modeM0/AS1A14_009T01_9000006534_55368cztM0_level2_quad_clean.evt |
| Size (bytes) | 217,941,120 | 50,356,800 |
| Size | 207.8 MB | 48.0 MB |
| Events in quadrant A | 2,131,059 | 322,291 |
| Events in quadrant B | 1,538,731 | 350,935 |
| Events in quadrant C | 2,561,998 | 302,949 |
| Events in quadrant D | 1,561,396 | 300,722 |
| Mode SS | |||
|---|---|---|---|
| Quadrant | BADHDUFLAG | Total packets | Discarded packets |
| A | 0 | 70 | 0 |
| B | 0 | 70 | 0 |
| C | 0 | 70 | 0 |
| D | 0 | 70 | 0 |
| Mode M0 | |||
|---|---|---|---|
| Quadrant | BADHDUFLAG | Total packets | Discarded packets |
| A | 0 | 8833 | 55 |
| B | 0 | 7316 | 41 |
| C | 0 | 10227 | 67 |
| D | 0 | 7290 | 44 |
| Mode M9 | |||
|---|---|---|---|
| Quadrant | BADHDUFLAG | Total packets | Discarded packets |
| A | 1 | 139748625389608 | 139745350909998 |
| B | 1 | -1 | -1 |
| C | 1 | -1 | -1 |
| D | 1 | -1 | -1 |
| Quadrant | Total seconds | Saturated seconds | Saturation percentage |
|---|---|---|---|
| A | 3498 | 133 | 3.802173% |
| B | 3500 | 37 | 1.057143% |
| C | 3502 | 211 | 6.025128% |
| D | 3507 | 13 | 0.370687% |
Noise dominated data is calculated using 1-second bins in cleaned event files. If a bin has >2000 counts, and if more than 50% of those come from <1% of pixels, then it is considered to be noise-dominated and hence unusable.
| Quadrant | # 1 sec bins | Bins with >0 counts | Bins with >2000 counts | High rate bins dominated by noise | Noise dominated (total time) | Noise dominated (detector-on time) | Marked lightcurve |
|---|---|---|---|---|---|---|---|
| A | 6381 | 3507 | 88 | 88 | 1.38% | 2.51% | 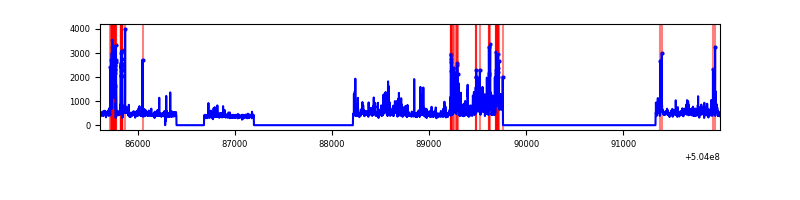 |
| B | 6381 | 3509 | 13 | 13 | 0.20% | 0.37% | 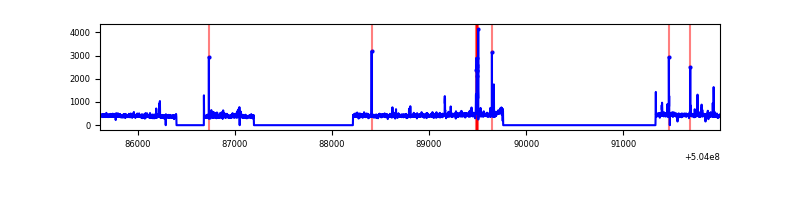 |
| C | 6381 | 3510 | 191 | 191 | 2.99% | 5.44% | 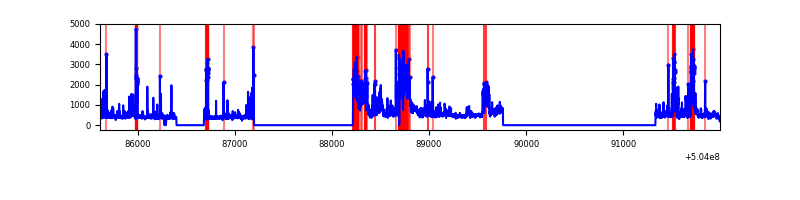 |
| D | 6381 | 3512 | 7 | 7 | 0.11% | 0.20% | 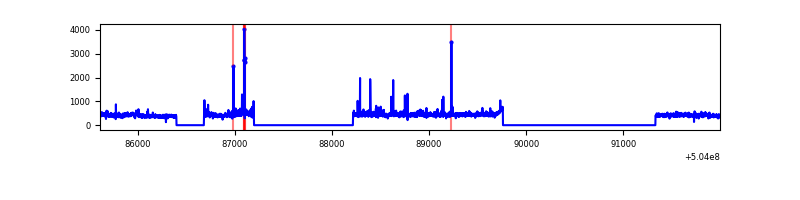 |
Top three noisy pixels from each quadrant. If the there are fewer than three noisy pixels in the level2.evt file, extra rows are filled as -1
| Pixel properties | Quadrant properties | ||||||
|---|---|---|---|---|---|---|---|
| Quadrant | DetID | PixID | Counts | Sigma | Mean | Median | Sigma |
| A | 4 | 159 | 368586 | 4044.9 | 360 | 350 | 91.0 |
| A | 0 | 8 | 185250 | 2031.04 | 360 | 350 | 91.0 |
| A | 3 | 78 | 84700 | 926.55 | 360 | 350 | 91.0 |
| B | 10 | 247 | 58728 | 742.02 | 359 | 346 | 78.7 |
| B | 0 | 199 | 21852 | 273.33 | 359 | 346 | 78.7 |
| B | 5 | 185 | 11233 | 138.37 | 359 | 346 | 78.7 |
| C | 9 | 38 | 615817 | 6368.72 | 348 | 343 | 96.6 |
| C | 13 | 3 | 341933 | 3534.66 | 348 | 343 | 96.6 |
| C | 12 | 250 | 142333 | 1469.26 | 348 | 343 | 96.6 |
| D | 11 | 129 | 38129 | 374.18 | 355 | 339 | 101.0 |
| D | 5 | 173 | 28411 | 277.95 | 355 | 339 | 101.0 |
| D | 3 | 12 | 25439 | 248.53 | 355 | 339 | 101.0 |
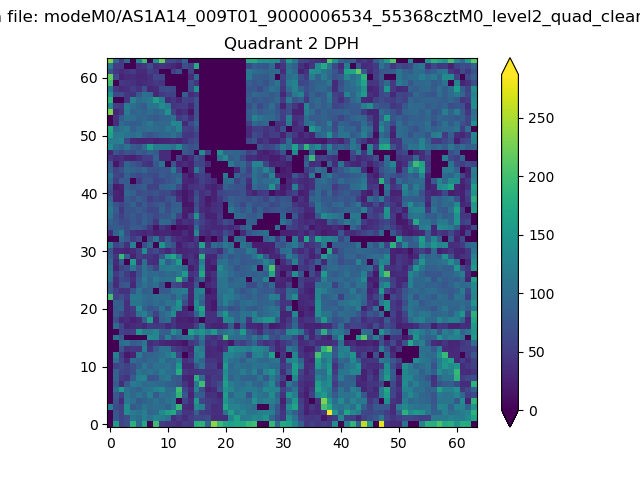
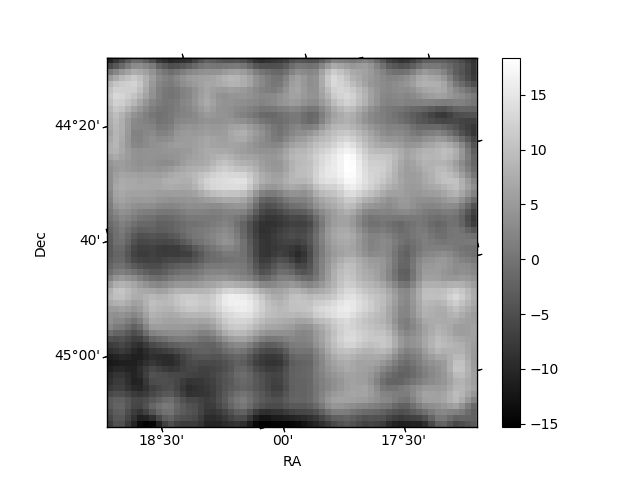
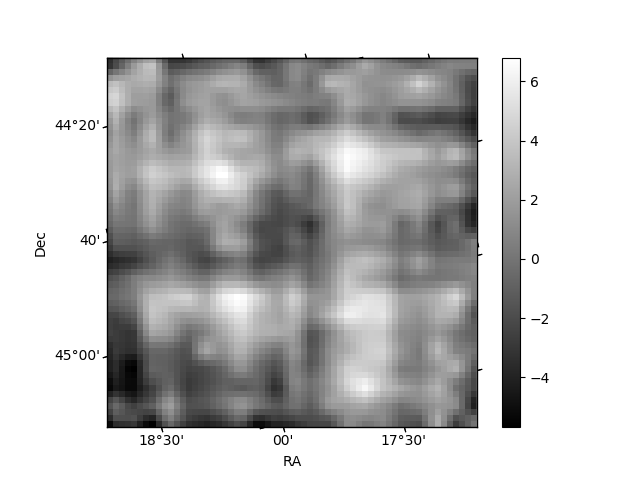
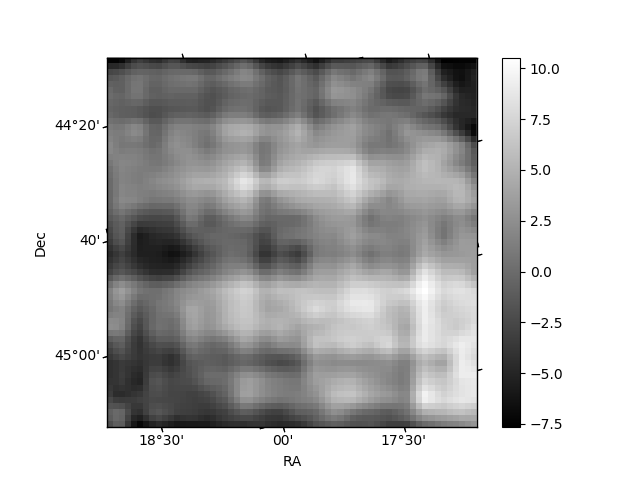
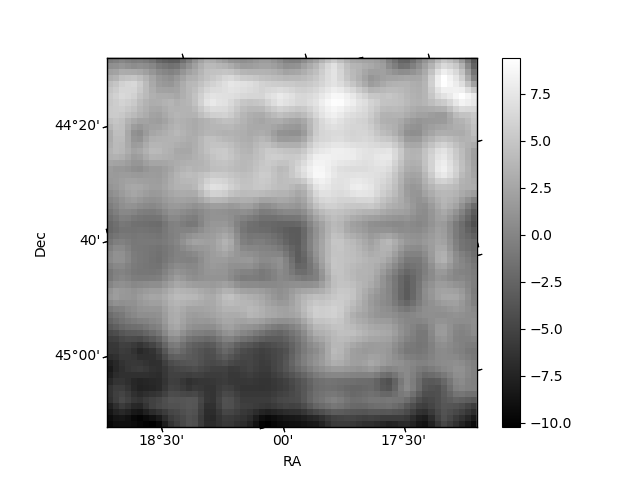
Histogram calculated using DETX and DETY for each event in the final _common_clean file
| Quadrant A | 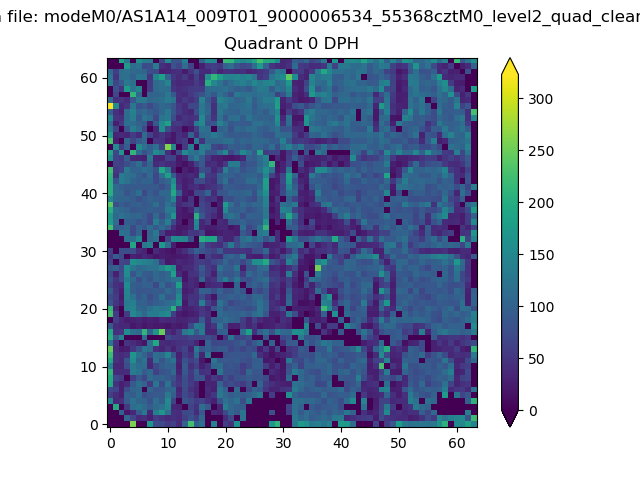 |
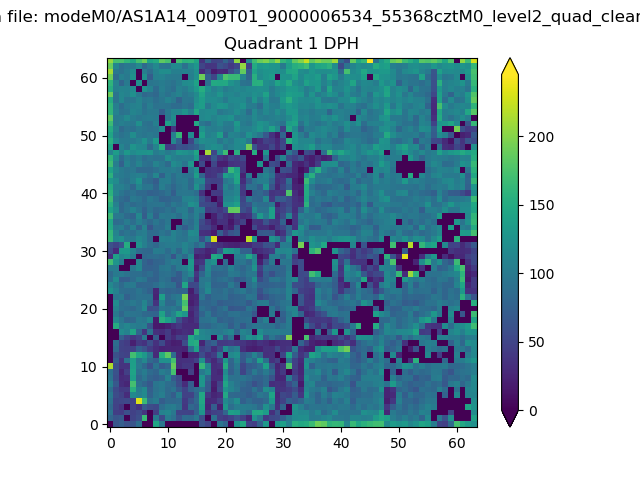 |
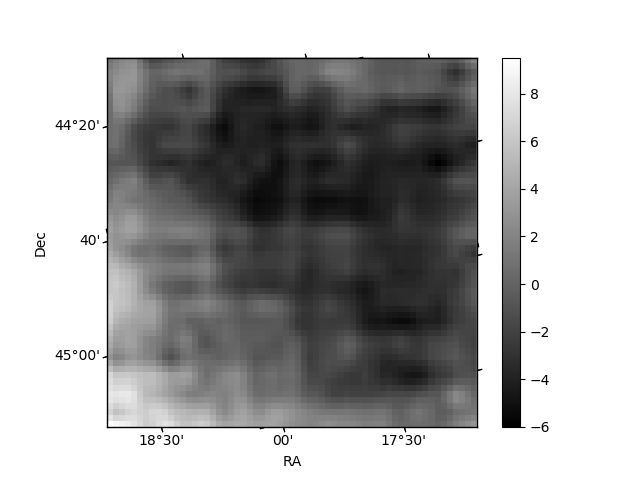
Quadrant B |
|---|---|---|---|
| Quadrant D | 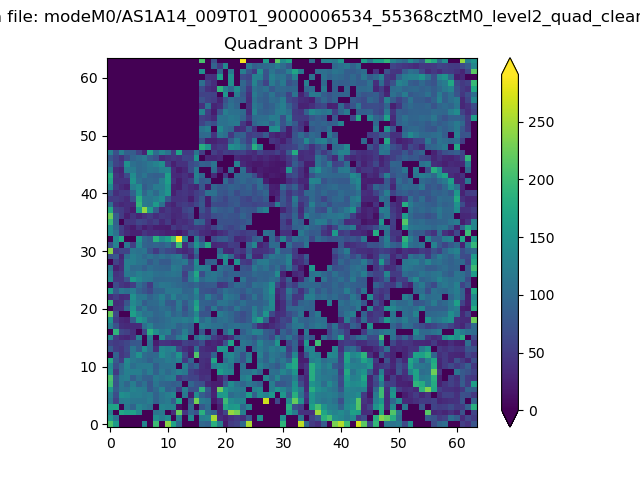 |
 |
Quadrant C |
| Plot type | Count rate plots | Images |
|---|---|---|
| Comparison with Poisson distribution Blue bars denote a histogram of data divided into 1 sec bins. Red curve is a Poisson curve with rate = median count rate of data. |
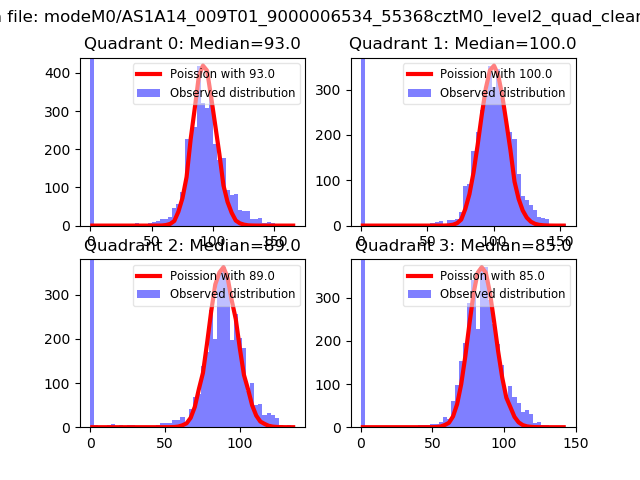 |
 |
| Quadrant-wise count rates Data is divided into 100 sec bins |
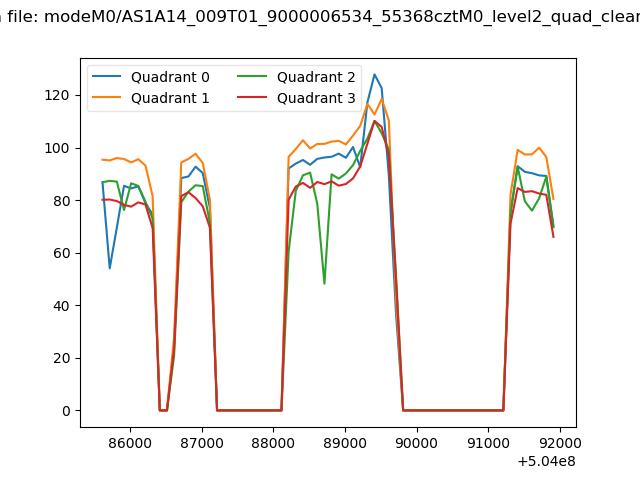 |
|
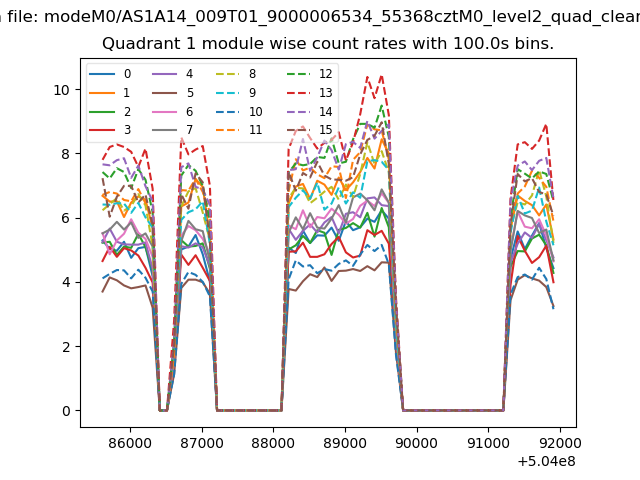
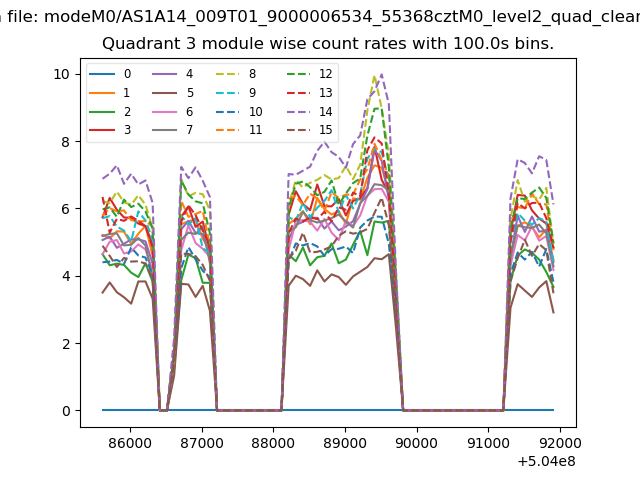
| Module-wise count rates for Quadrant A Data is divided into 100 sec bins |
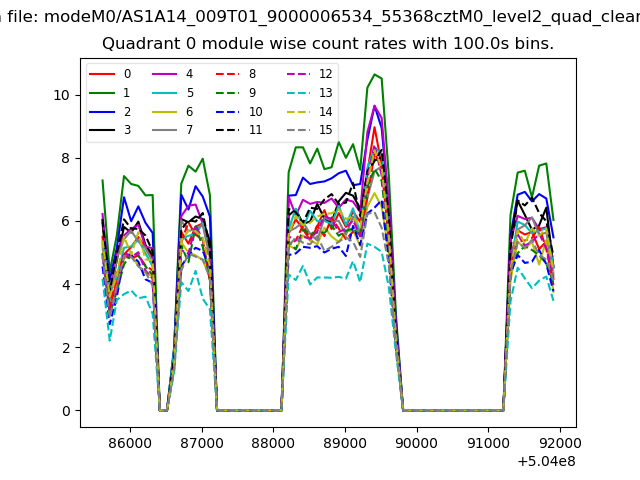 |
 |
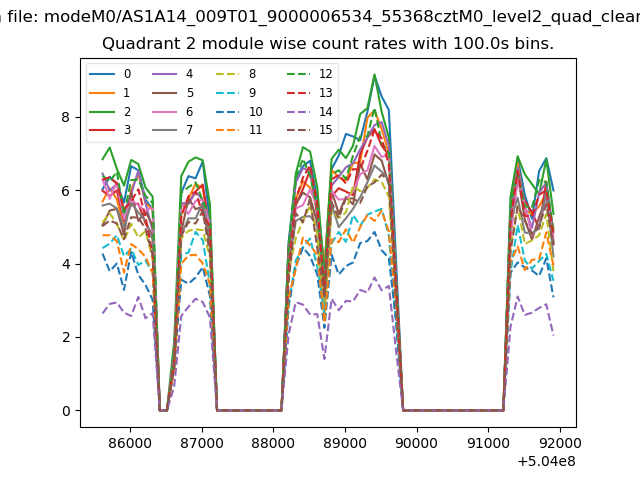
| Module-wise count rates for Quadrant B Data is divided into 100 sec bins |
 |
 |
| Module-wise count rates for Quadrant C Data is divided into 100 sec bins |
 |
 |
| Module-wise count rates for Quadrant D Data is divided into 100 sec bins |
 |
 |
| Parameter | Plot |
|---|---|
| CZT HV Monitor | 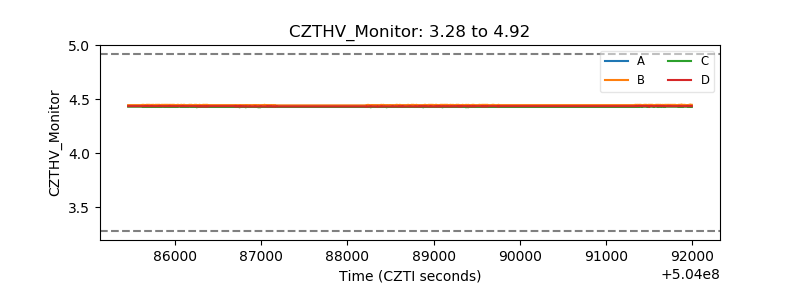 |
| D_VDD | 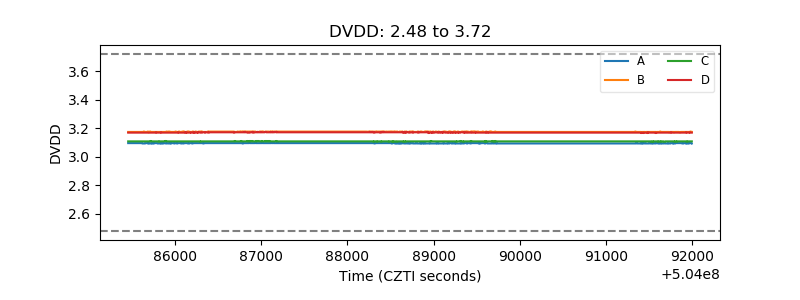 |
| Temperature 1 | 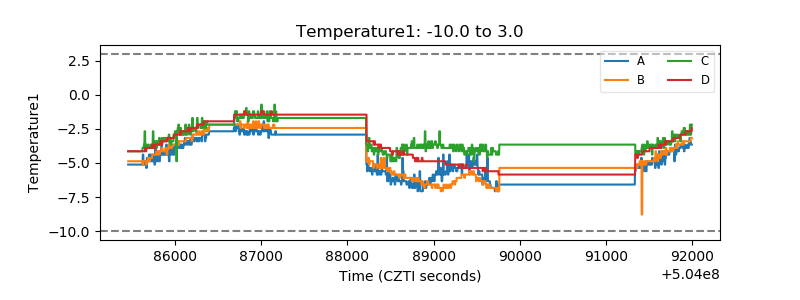 |
| Veto HV Monitor | 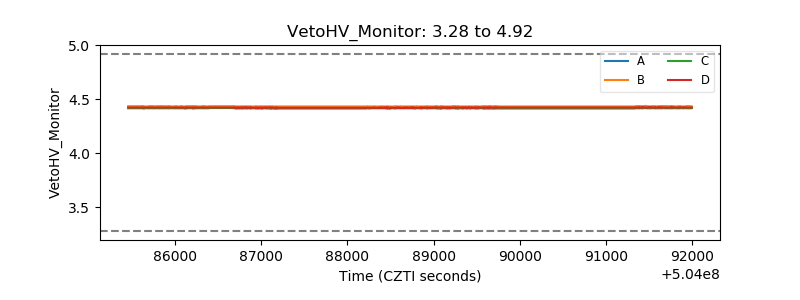 |
| Veto LLD | 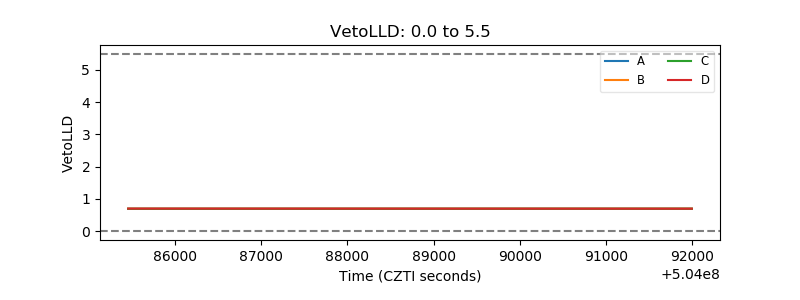 |
| Alpha Counter | 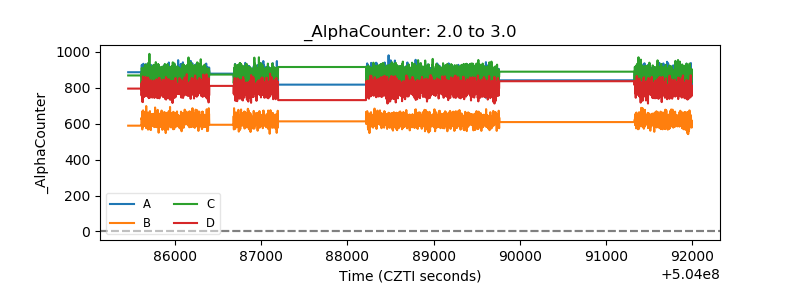 |
| _CPM_Rate | 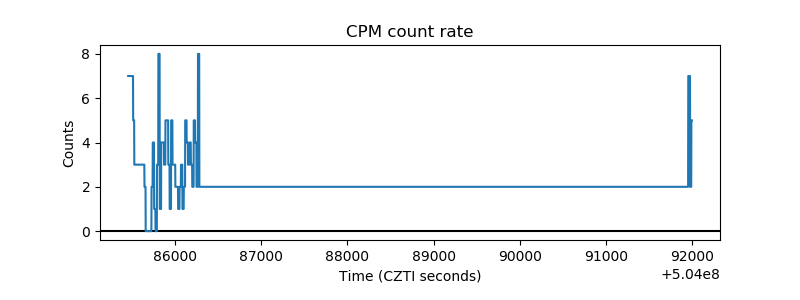 |
| CZT Counter | 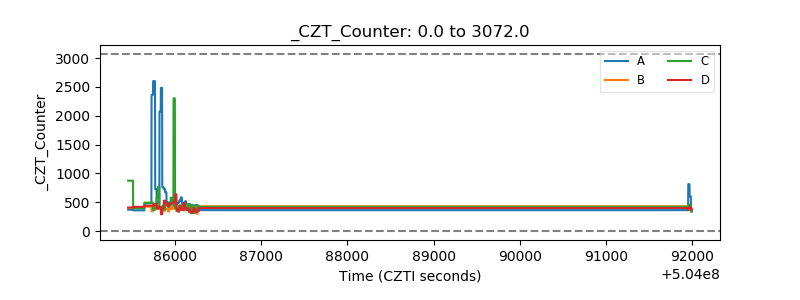 |
| +2.5 Volts monitor | 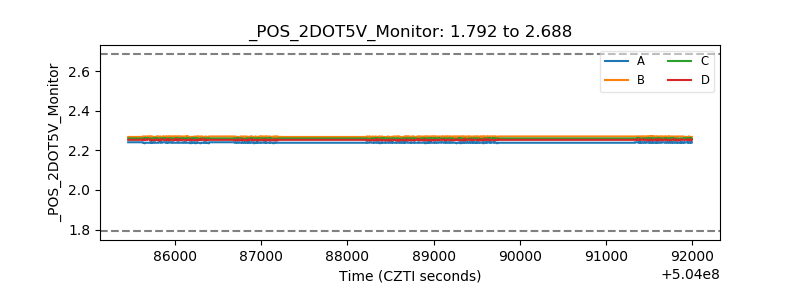 |
| +5 Volts monitor | 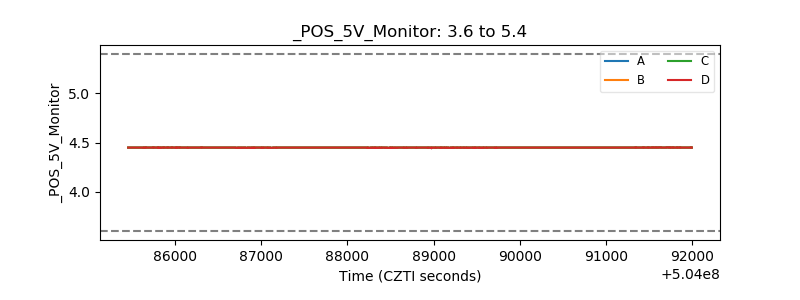 |
| _ROLL_ROT | 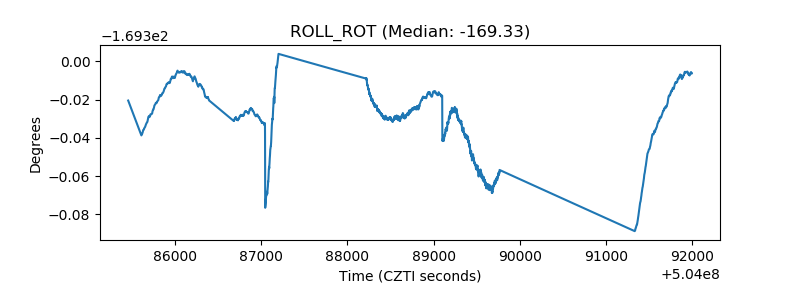 |
| _Roll_DEC | 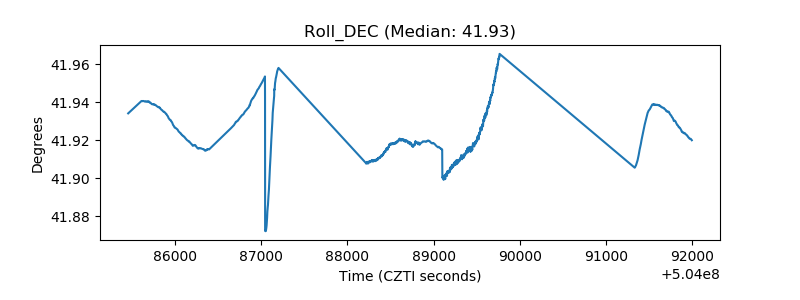 |
| _Roll_RA | 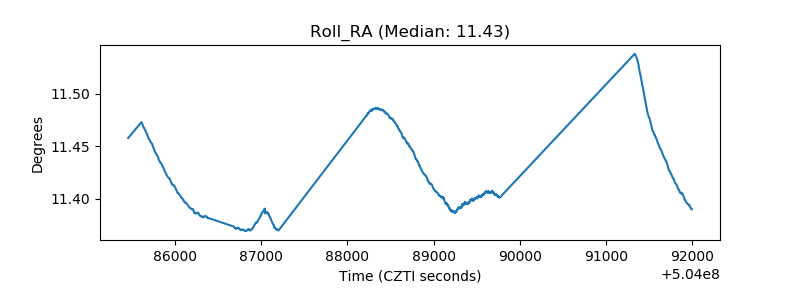 |
| Veto Counter | 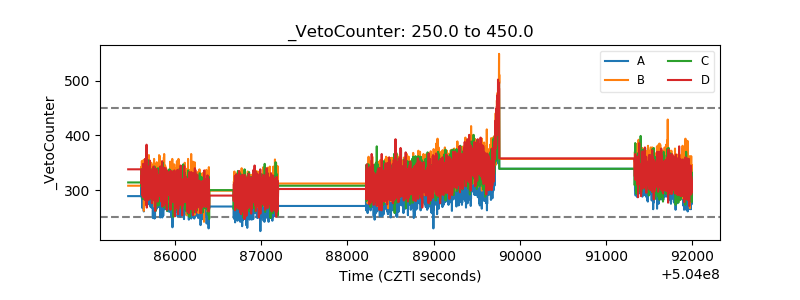 |