| Param | Original file | Final file |
|---|---|---|
| Filename | modeM0/AS1A14_009T01_9000006534_55369cztM0_level2.fits | modeM0/AS1A14_009T01_9000006534_55369cztM0_level2_quad_clean.evt |
| Size (bytes) | 499,849,920 | 99,250,560 |
| Size | 476.7 MB | 94.7 MB |
| Events in quadrant A | 6,051,107 | 628,689 |
| Events in quadrant B | 3,106,480 | 704,617 |
| Events in quadrant C | 5,441,256 | 598,395 |
| Events in quadrant D | 3,384,528 | 607,531 |
| Mode SS | |||
|---|---|---|---|
| Quadrant | BADHDUFLAG | Total packets | Discarded packets |
| A | 0 | 136 | 0 |
| B | 0 | 134 | 0 |
| C | 0 | 134 | 0 |
| D | 0 | 134 | 0 |
| Mode M0 | |||
|---|---|---|---|
| Quadrant | BADHDUFLAG | Total packets | Discarded packets |
| A | 0 | 22648 | 1 |
| B | 0 | 14170 | 1 |
| C | 0 | 21022 | 1 |
| D | 0 | 14795 | 1 |
| Mode M9 | |||
|---|---|---|---|
| Quadrant | BADHDUFLAG | Total packets | Discarded packets |
| A | 0 | 9 | 0 |
| B | 0 | 9 | 0 |
| C | 0 | 9 | 0 |
| D | 0 | 9 | 0 |
| Quadrant | Total seconds | Saturated seconds | Saturation percentage |
|---|---|---|---|
| A | 6690 | 671 | 10.029895% |
| B | 6689 | 125 | 1.868740% |
| C | 6689 | 428 | 6.398565% |
| D | 6690 | 112 | 1.674141% |
Noise dominated data is calculated using 1-second bins in cleaned event files. If a bin has >2000 counts, and if more than 50% of those come from <1% of pixels, then it is considered to be noise-dominated and hence unusable.
| Quadrant | # 1 sec bins | Bins with >0 counts | Bins with >2000 counts | High rate bins dominated by noise | Noise dominated (total time) | Noise dominated (detector-on time) | Marked lightcurve |
|---|---|---|---|---|---|---|---|
| A | 7585 | 6690 | 481 | 481 | 6.34% | 7.19% | 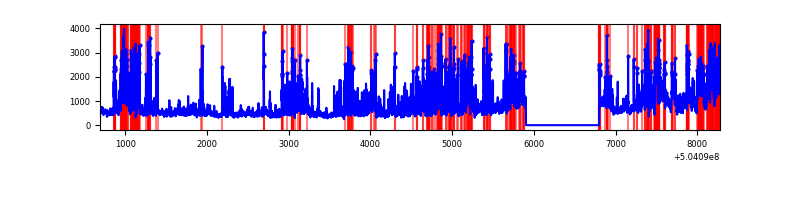 |
| B | 7584 | 6689 | 16 | 16 | 0.21% | 0.24% | 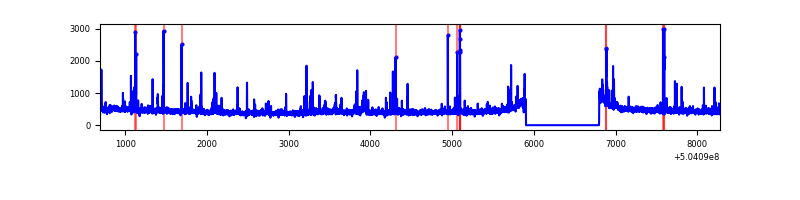 |
| C | 7584 | 6689 | 306 | 306 | 4.03% | 4.57% | 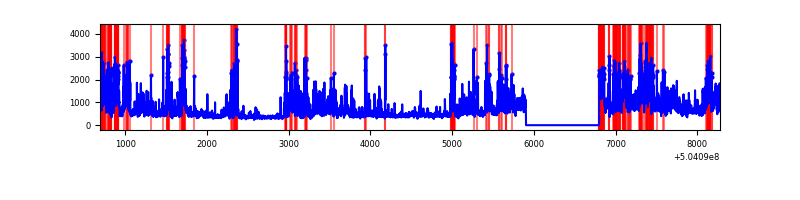 |
| D | 7585 | 6691 | 66 | 66 | 0.87% | 0.99% | 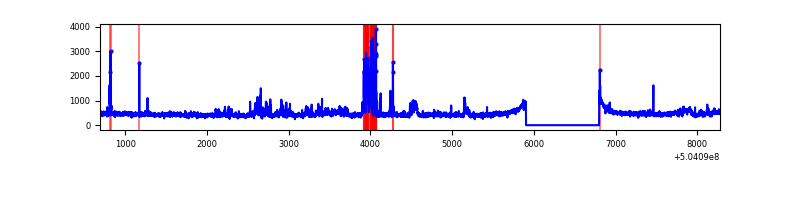 |
Top three noisy pixels from each quadrant. If the there are fewer than three noisy pixels in the level2.evt file, extra rows are filled as -1
| Pixel properties | Quadrant properties | ||||||
|---|---|---|---|---|---|---|---|
| Quadrant | DetID | PixID | Counts | Sigma | Mean | Median | Sigma |
| A | 4 | 159 | 2091889 | 11722.48 | 712 | 695 | 178.4 |
| A | 0 | 8 | 781617 | 4377.57 | 712 | 695 | 178.4 |
| A | 12 | 115 | 346617 | 1939.11 | 712 | 695 | 178.4 |
| B | 5 | 185 | 71816 | 461.8 | 714 | 689 | 154.0 |
| B | 0 | 199 | 60969 | 391.38 | 714 | 689 | 154.0 |
| B | 10 | 247 | 60466 | 388.11 | 714 | 689 | 154.0 |
| C | 9 | 38 | 2370466 | 12374.3 | 686 | 679 | 191.5 |
| C | 12 | 250 | 187808 | 977.13 | 686 | 679 | 191.5 |
| C | 12 | 252 | 69970 | 361.82 | 686 | 679 | 191.5 |
| D | 11 | 129 | 160598 | 788.54 | 708 | 676 | 202.8 |
| D | 10 | 181 | 133600 | 655.42 | 708 | 676 | 202.8 |
| D | 15 | 107 | 116876 | 572.95 | 708 | 676 | 202.8 |
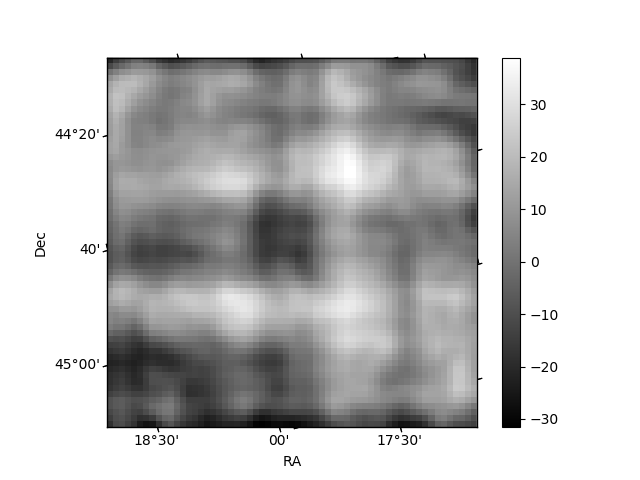
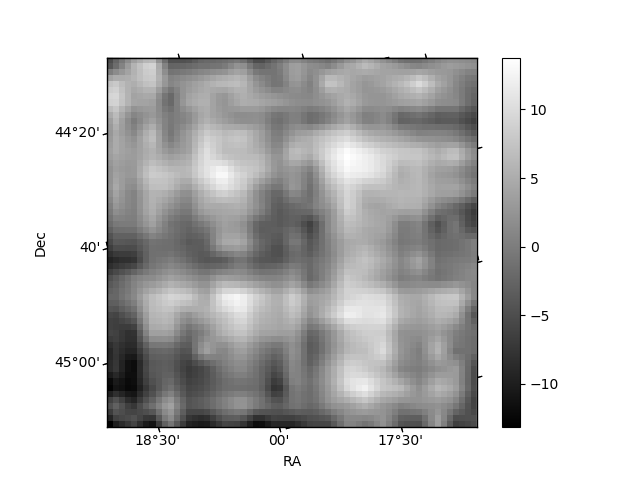
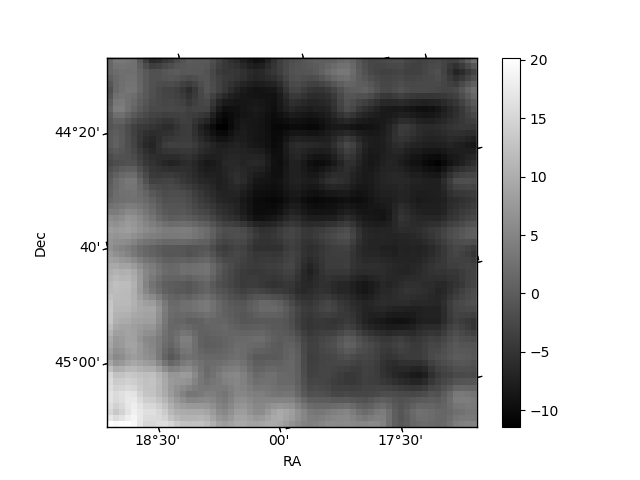
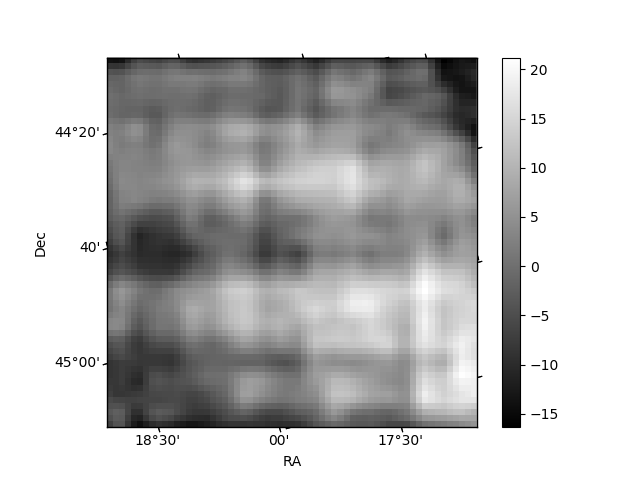
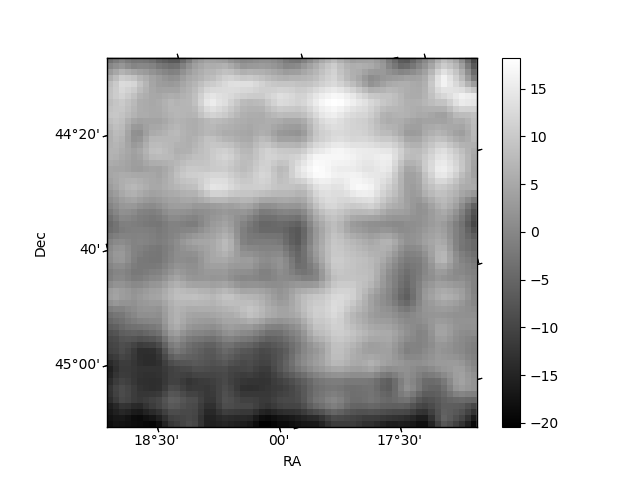
Histogram calculated using DETX and DETY for each event in the final _common_clean file
| Quadrant A | 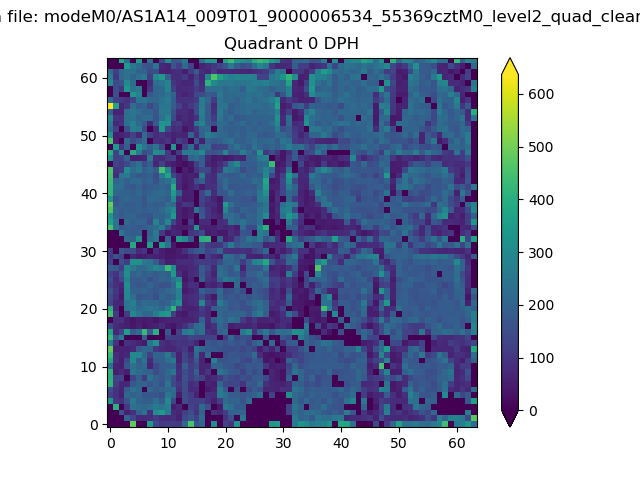 |
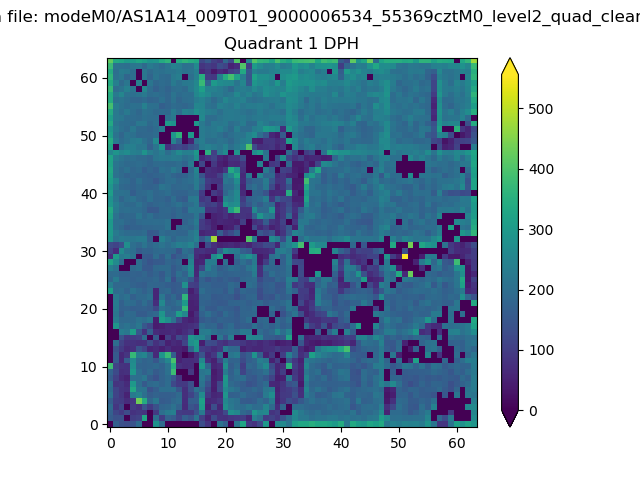 |
Quadrant B |
|---|---|---|---|
| Quadrant D | 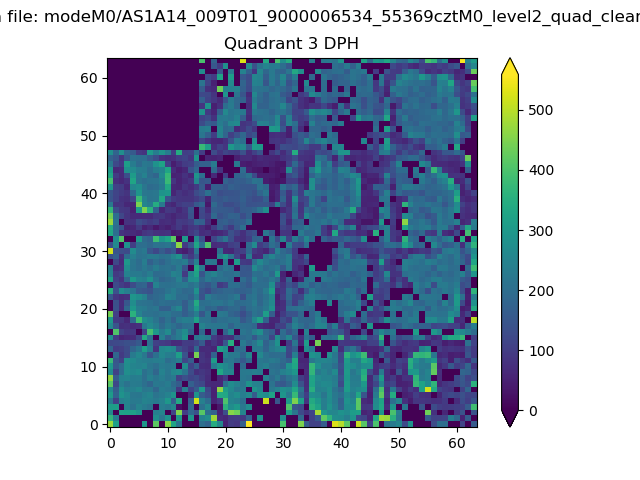 |
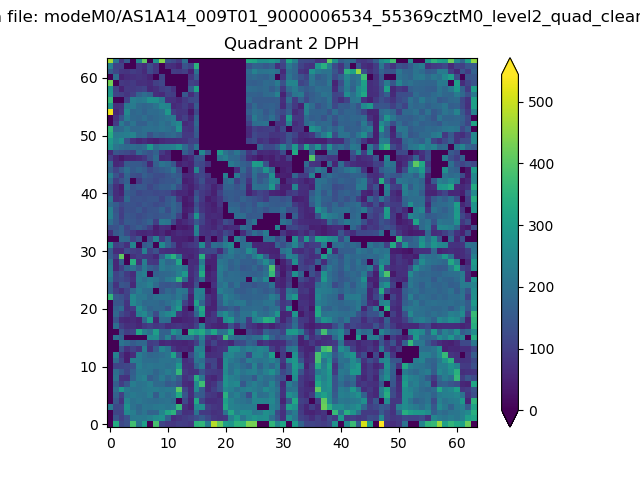 |
Quadrant C |
| Plot type | Count rate plots | Images |
|---|---|---|
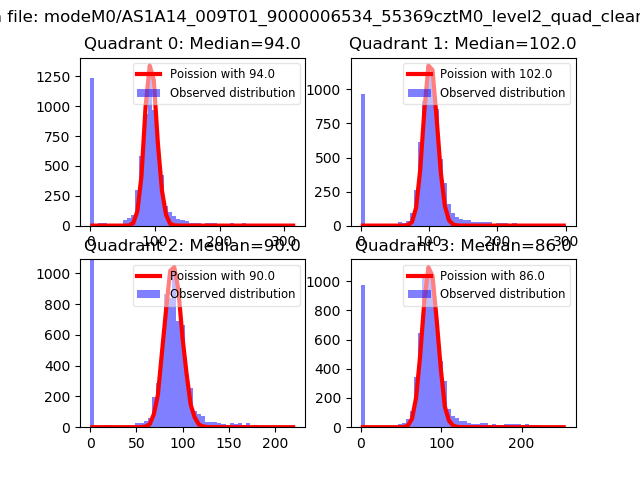
| Comparison with Poisson distribution Blue bars denote a histogram of data divided into 1 sec bins. Red curve is a Poisson curve with rate = median count rate of data. |
 |
 |
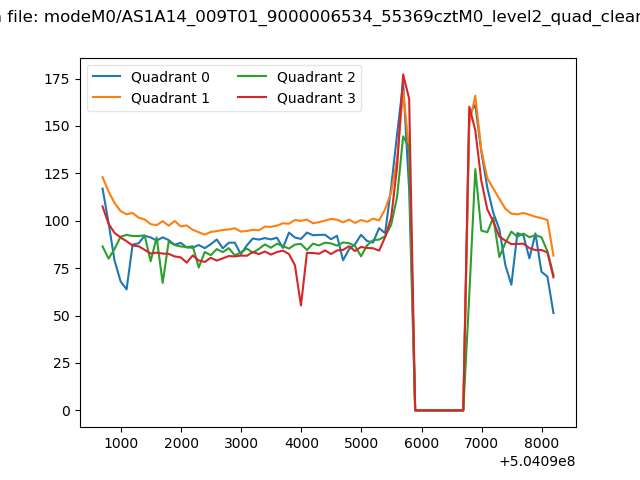
| Quadrant-wise count rates Data is divided into 100 sec bins |
 |
|
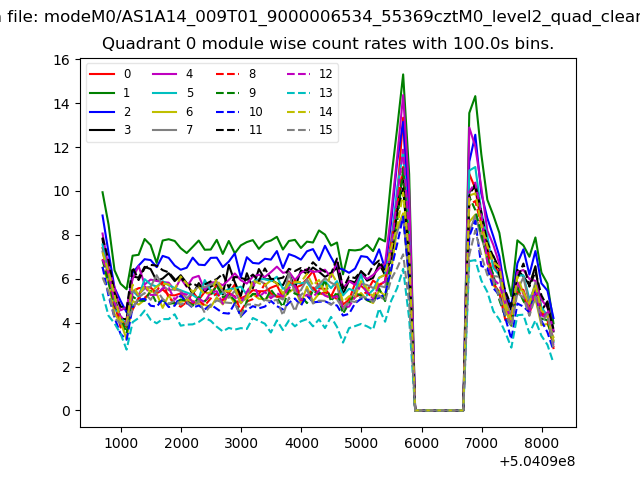
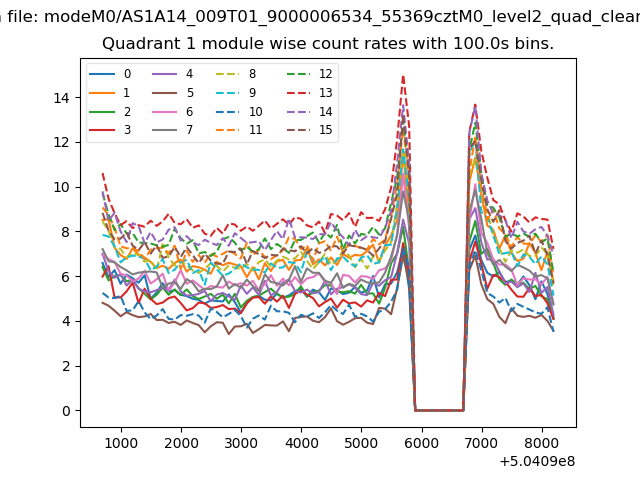
| Module-wise count rates for Quadrant A Data is divided into 100 sec bins |
 |
 |
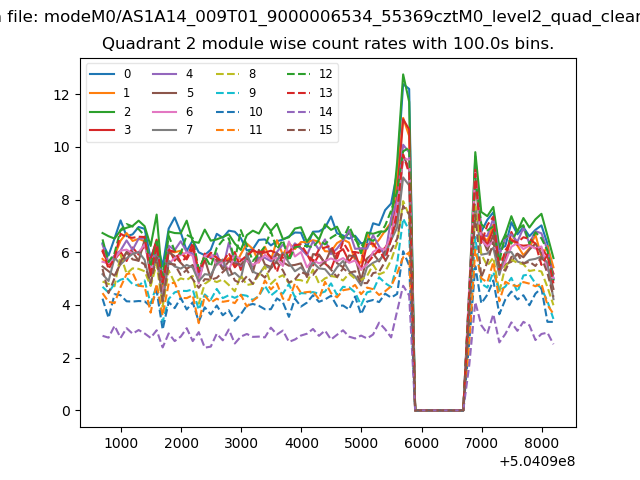
| Module-wise count rates for Quadrant B Data is divided into 100 sec bins |
 |
 |
| Module-wise count rates for Quadrant C Data is divided into 100 sec bins |
 |
 |
| Module-wise count rates for Quadrant D Data is divided into 100 sec bins |
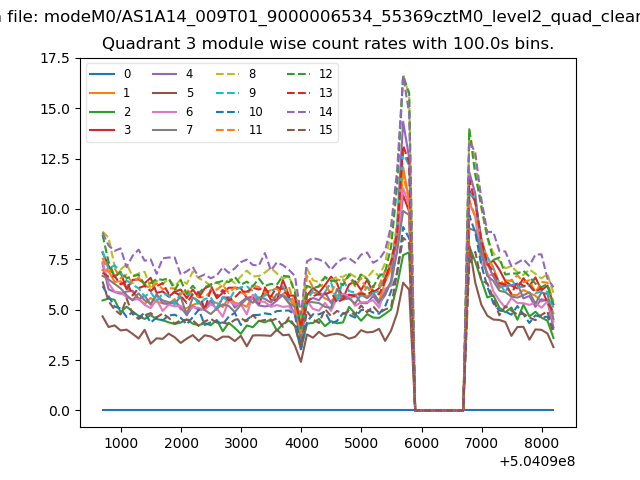 |
 |
| Parameter | Plot |
|---|---|
| CZT HV Monitor |  |
| D_VDD | 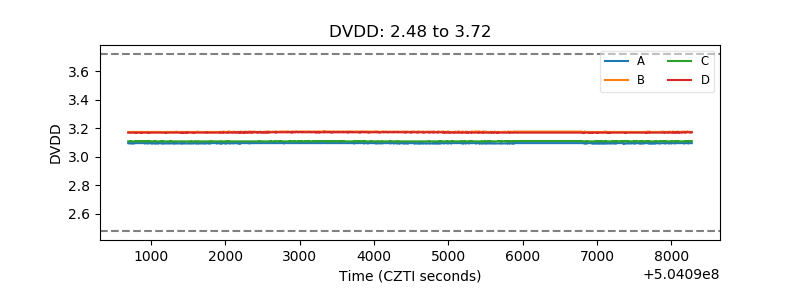 |
| Temperature 1 | 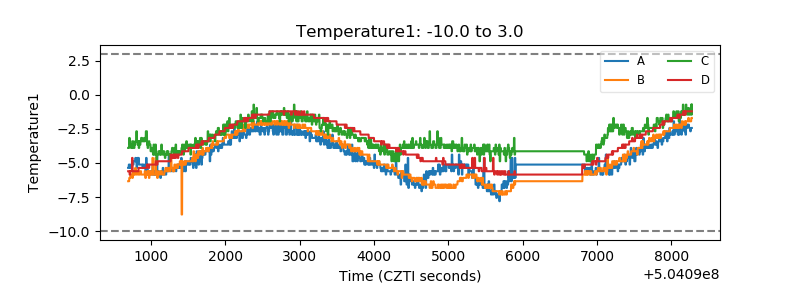 |
| Veto HV Monitor | 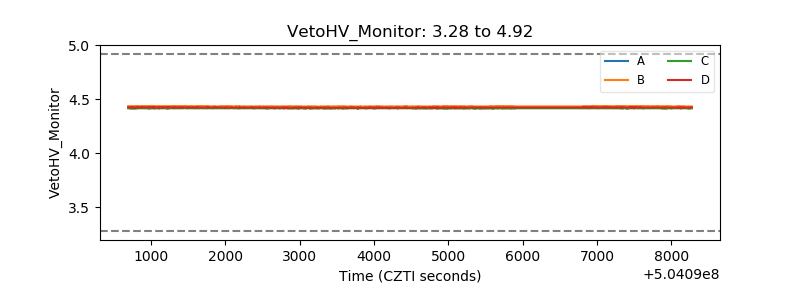 |
| Veto LLD | 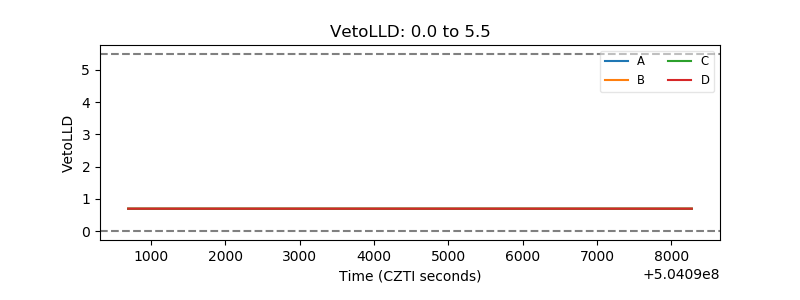 |
| Alpha Counter | 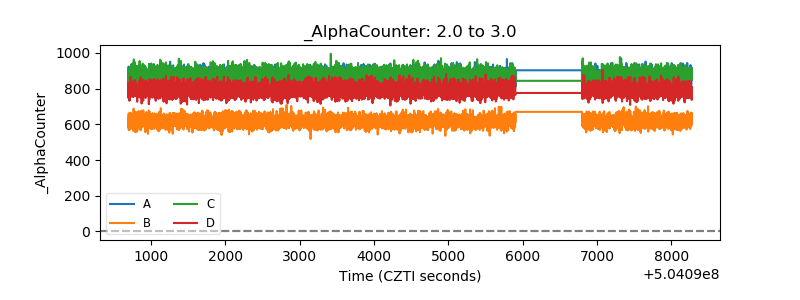 |
| _CPM_Rate | 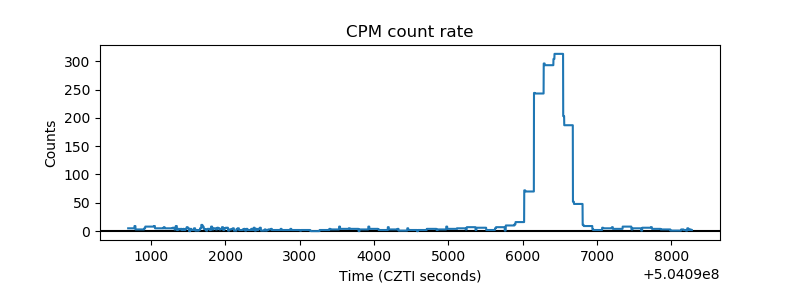 |
| CZT Counter | 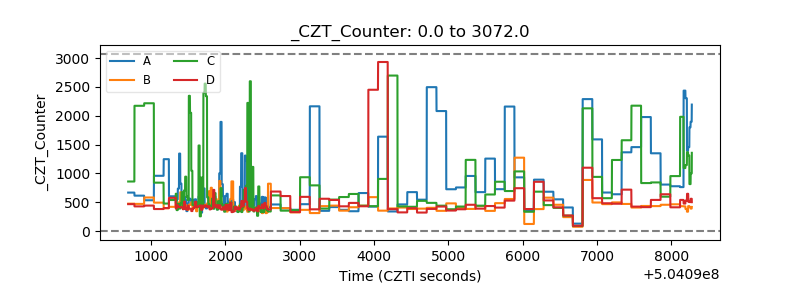 |
| +2.5 Volts monitor | 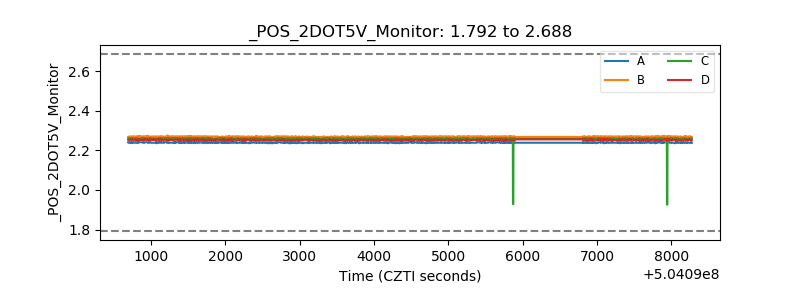 |
| +5 Volts monitor | 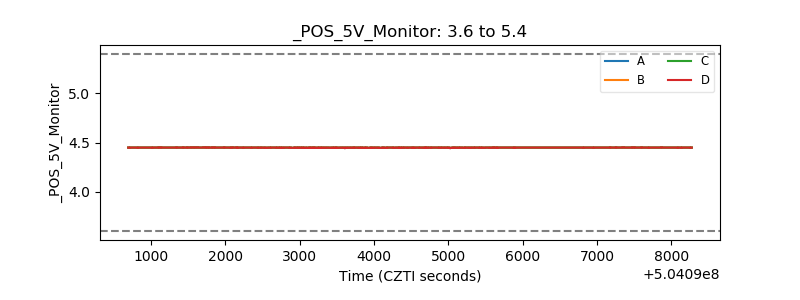 |
| _ROLL_ROT |  |
| _Roll_DEC | 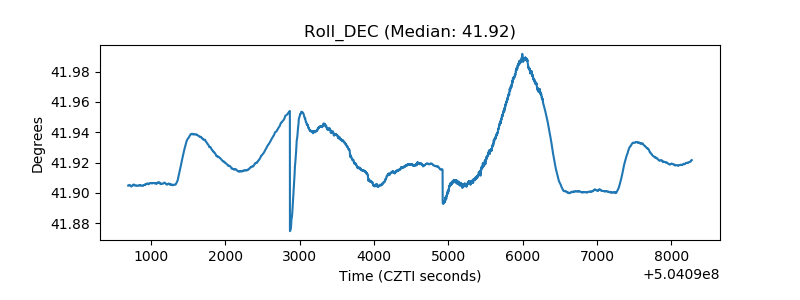 |
| _Roll_RA | 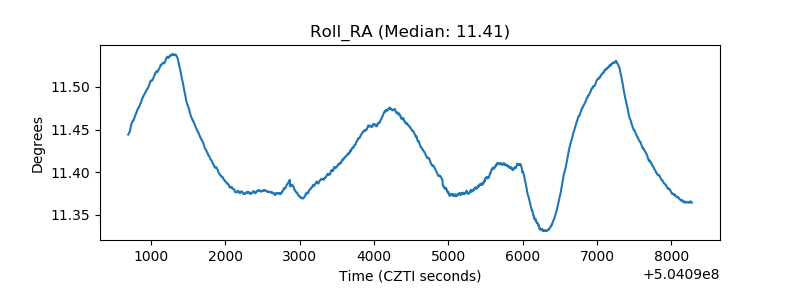 |
| Veto Counter | 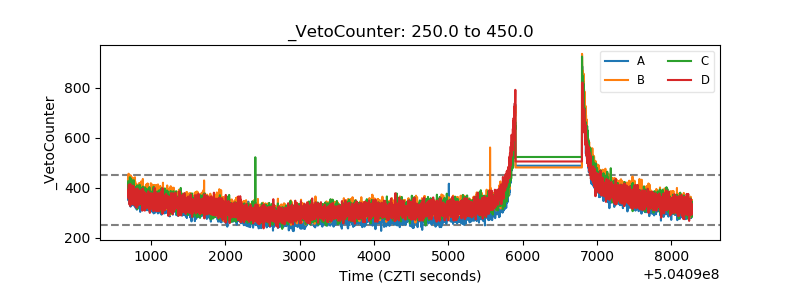 |