| Param | Original file | Final file |
|---|---|---|
| Filename | modeM0/AS1A14_009T01_9000006534_55372cztM0_level2.fits | modeM0/AS1A14_009T01_9000006534_55372cztM0_level2_quad_clean.evt |
| Size (bytes) | 535,688,640 | 93,997,440 |
| Size | 510.9 MB | 89.6 MB |
| Events in quadrant A | 7,592,514 | 553,596 |
| Events in quadrant B | 3,286,595 | 683,622 |
| Events in quadrant C | 4,330,497 | 599,954 |
| Events in quadrant D | 4,116,625 | 556,494 |
| Mode SS | |||
|---|---|---|---|
| Quadrant | BADHDUFLAG | Total packets | Discarded packets |
| A | 0 | 132 | 0 |
| B | 0 | 132 | 0 |
| C | 0 | 132 | 0 |
| D | 0 | 132 | 0 |
| Mode M0 | |||
|---|---|---|---|
| Quadrant | BADHDUFLAG | Total packets | Discarded packets |
| A | 0 | 27013 | 1 |
| B | 0 | 14447 | 1 |
| C | 0 | 17485 | 1 |
| D | 0 | 16814 | 1 |
| Mode M9 | |||
|---|---|---|---|
| Quadrant | BADHDUFLAG | Total packets | Discarded packets |
| A | 0 | 11 | 0 |
| B | 0 | 11 | 0 |
| C | 0 | 11 | 0 |
| D | 0 | 11 | 0 |
| Quadrant | Total seconds | Saturated seconds | Saturation percentage |
|---|---|---|---|
| A | 6485 | 1127 | 17.378566% |
| B | 6485 | 96 | 1.480339% |
| C | 6485 | 232 | 3.577487% |
| D | 6485 | 390 | 6.013878% |
Noise dominated data is calculated using 1-second bins in cleaned event files. If a bin has >2000 counts, and if more than 50% of those come from <1% of pixels, then it is considered to be noise-dominated and hence unusable.
| Quadrant | # 1 sec bins | Bins with >0 counts | Bins with >2000 counts | High rate bins dominated by noise | Noise dominated (total time) | Noise dominated (detector-on time) | Marked lightcurve |
|---|---|---|---|---|---|---|---|
| A | 7615 | 6485 | 876 | 876 | 11.50% | 13.51% | 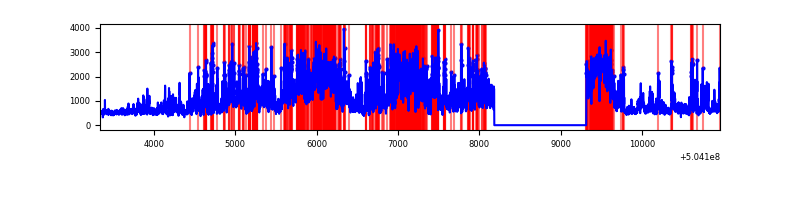 |
| B | 7615 | 6486 | 21 | 21 | 0.28% | 0.32% | 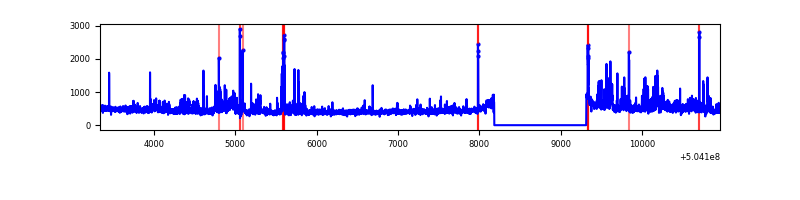 |
| C | 7615 | 6486 | 177 | 177 | 2.32% | 2.73% | 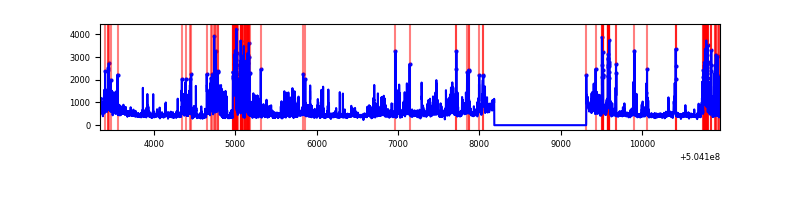 |
| D | 7615 | 6486 | 343 | 343 | 4.50% | 5.29% | 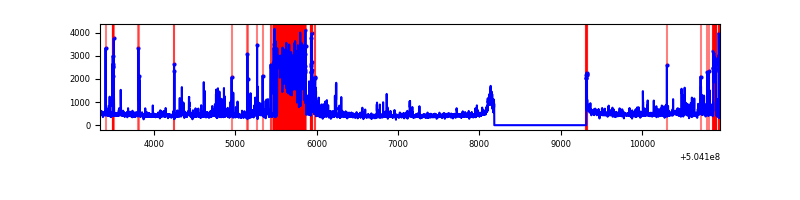 |
Top three noisy pixels from each quadrant. If the there are fewer than three noisy pixels in the level2.evt file, extra rows are filled as -1
| Pixel properties | Quadrant properties | ||||||
|---|---|---|---|---|---|---|---|
| Quadrant | DetID | PixID | Counts | Sigma | Mean | Median | Sigma |
| A | 4 | 159 | 3365941 | 20455.3 | 666 | 651 | 164.5 |
| A | 12 | 115 | 1236808 | 7513.75 | 666 | 651 | 164.5 |
| A | 0 | 8 | 113740 | 687.39 | 666 | 651 | 164.5 |
| B | 0 | 199 | 248563 | 1682.22 | 688 | 663 | 147.4 |
| B | 5 | 185 | 167353 | 1131.14 | 688 | 663 | 147.4 |
| B | 4 | 81 | 59057 | 396.25 | 688 | 663 | 147.4 |
| C | 9 | 38 | 951195 | 5159.17 | 671 | 666 | 184.2 |
| C | 13 | 3 | 607073 | 3291.39 | 671 | 666 | 184.2 |
| C | 12 | 250 | 106706 | 575.55 | 671 | 666 | 184.2 |
| D | 11 | 176 | 861690 | 4551.17 | 672 | 644 | 189.2 |
| D | 2 | 249 | 121425 | 638.4 | 672 | 644 | 189.2 |
| D | 10 | 181 | 112668 | 592.12 | 672 | 644 | 189.2 |
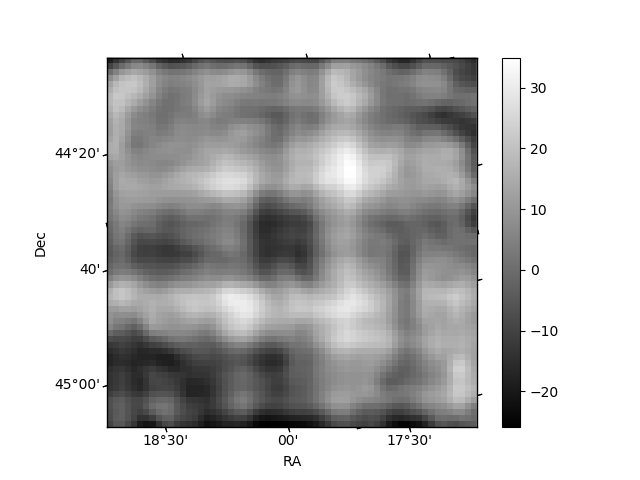
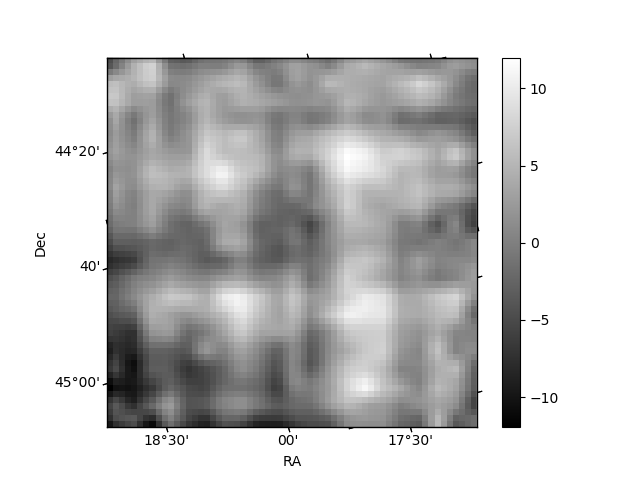
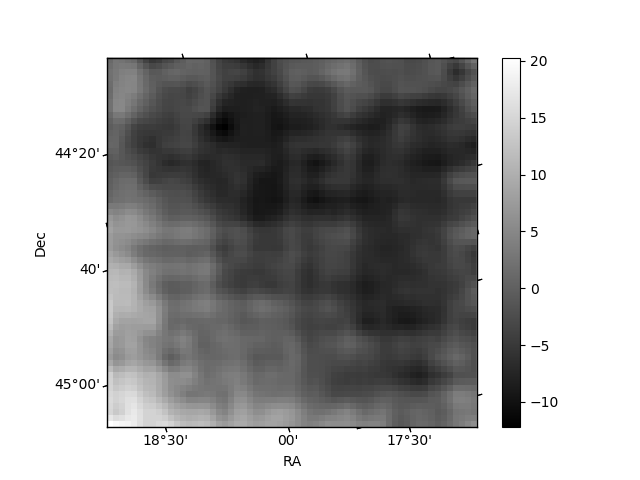
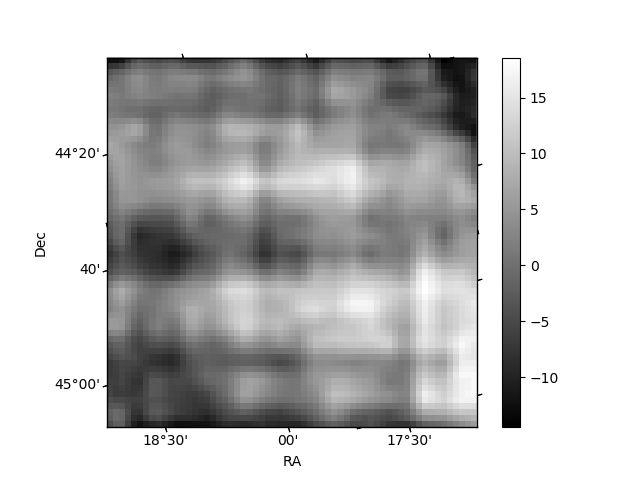
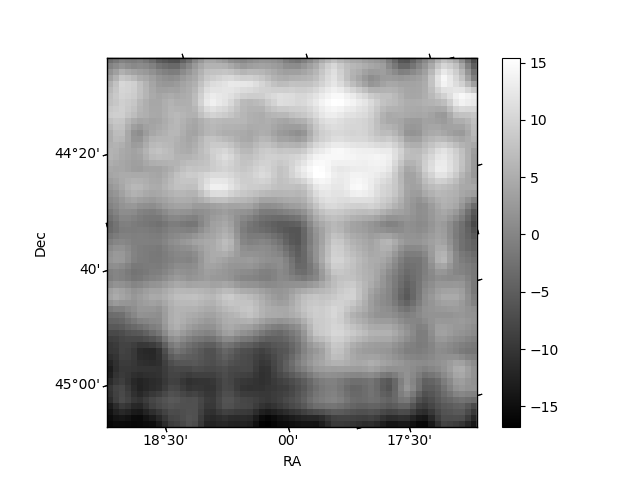
Histogram calculated using DETX and DETY for each event in the final _common_clean file
| Quadrant A | 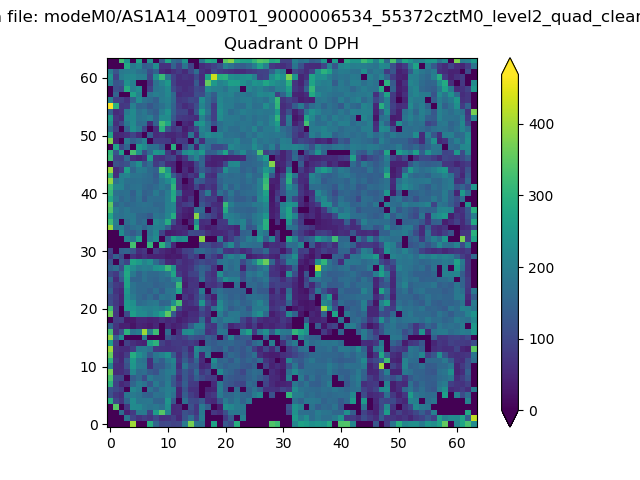 |
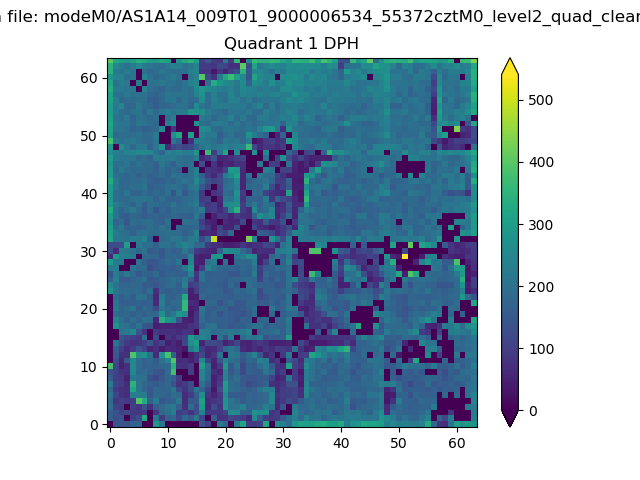 |
Quadrant B |
|---|---|---|---|
| Quadrant D | 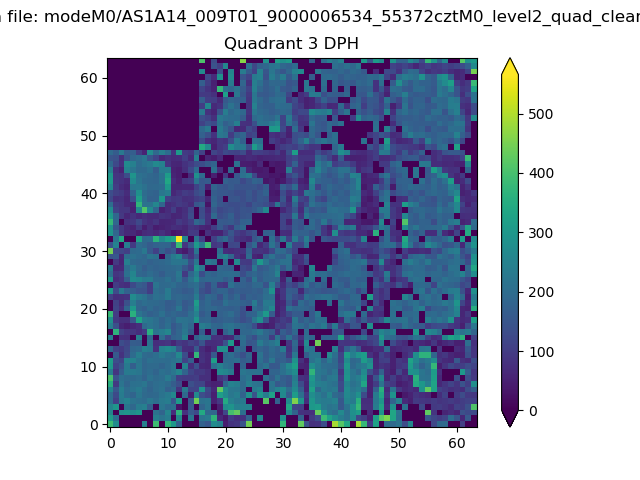 |
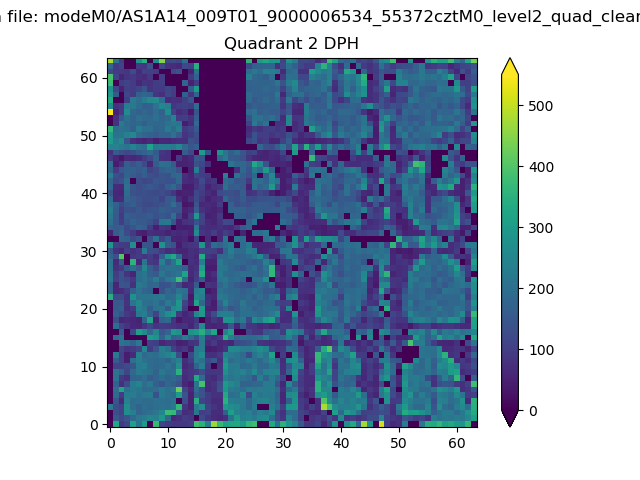 |
Quadrant C |
| Plot type | Count rate plots | Images |
|---|---|---|
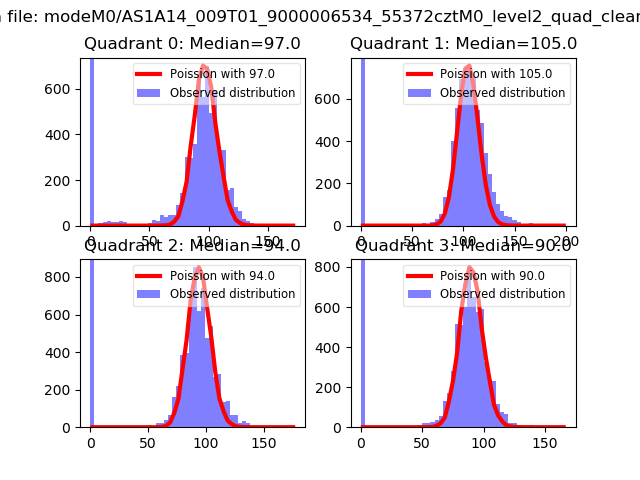
| Comparison with Poisson distribution Blue bars denote a histogram of data divided into 1 sec bins. Red curve is a Poisson curve with rate = median count rate of data. |
 |
 |
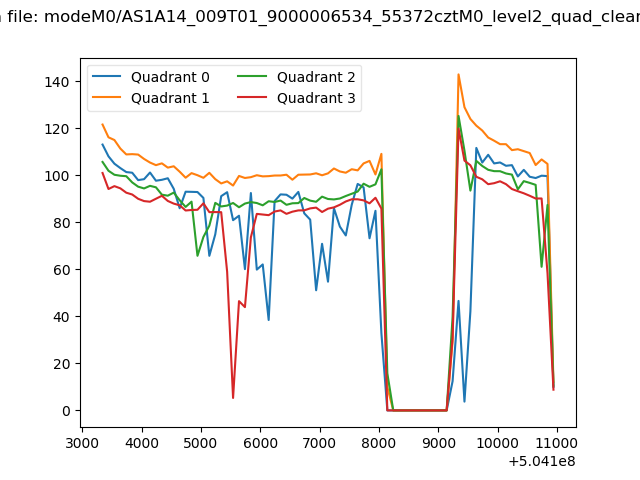
| Quadrant-wise count rates Data is divided into 100 sec bins |
 |
|
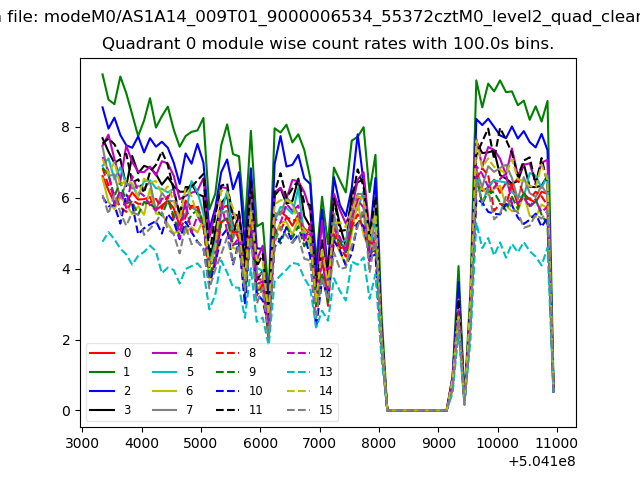
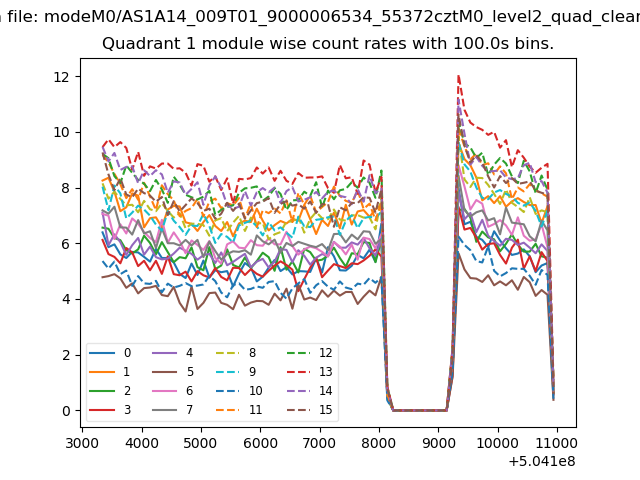
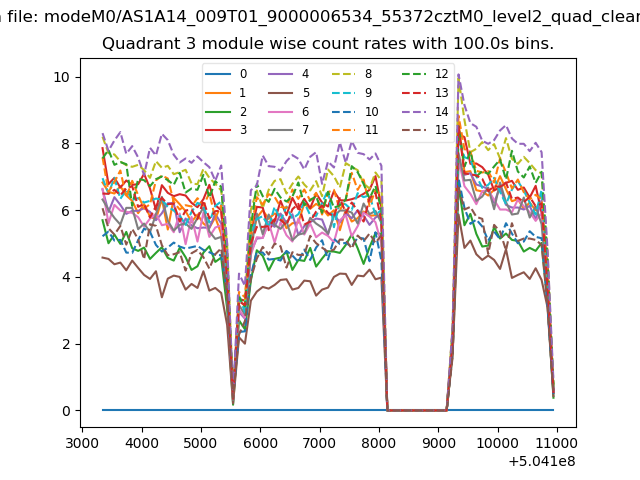
| Module-wise count rates for Quadrant A Data is divided into 100 sec bins |
 |
 |
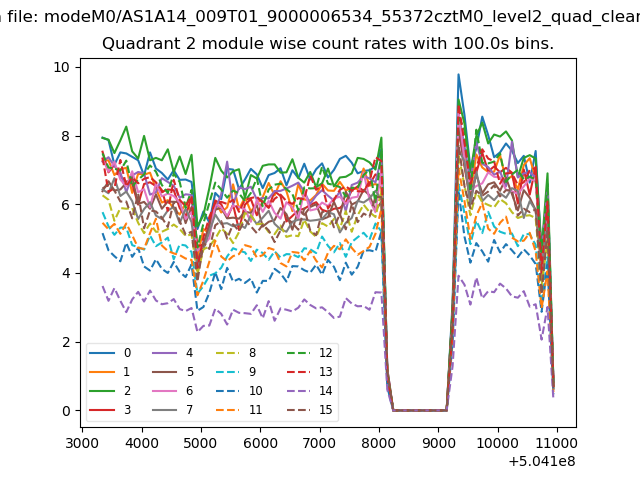
| Module-wise count rates for Quadrant B Data is divided into 100 sec bins |
 |
 |
| Module-wise count rates for Quadrant C Data is divided into 100 sec bins |
 |
 |
| Module-wise count rates for Quadrant D Data is divided into 100 sec bins |
 |
 |
| Parameter | Plot |
|---|---|
| CZT HV Monitor | 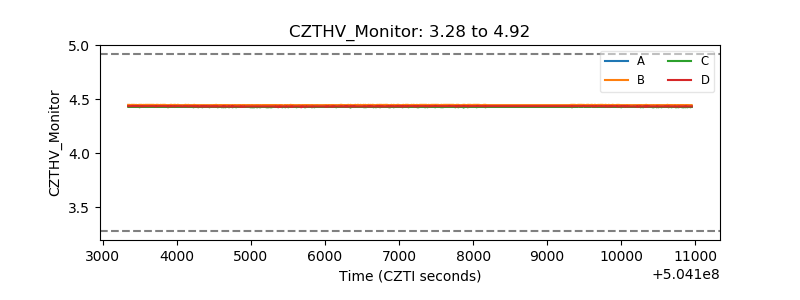 |
| D_VDD | 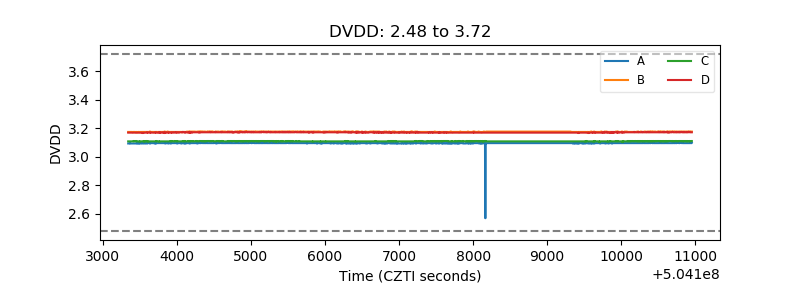 |
| Temperature 1 | 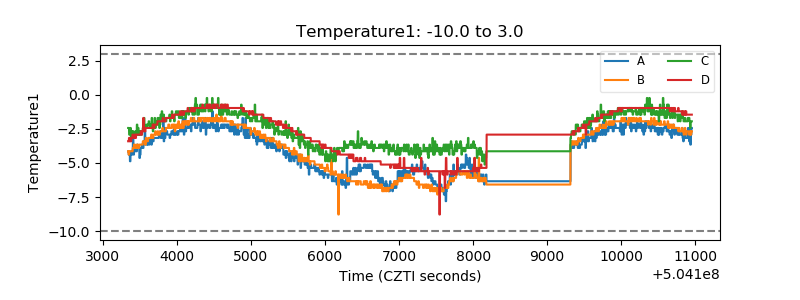 |
| Veto HV Monitor | 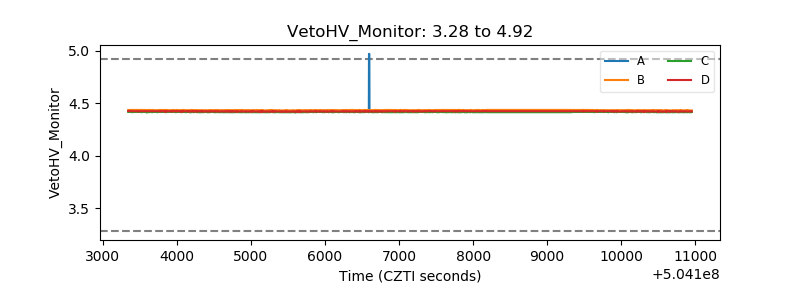 |
| Veto LLD | 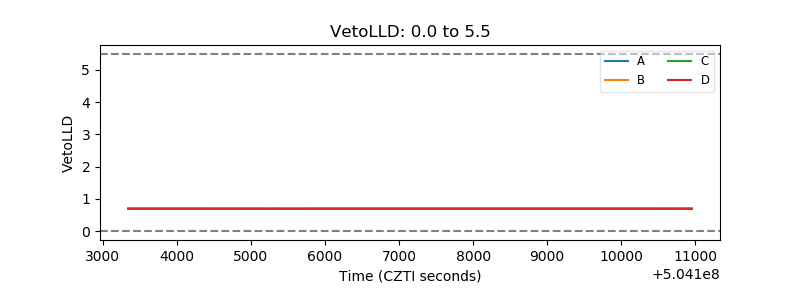 |
| Alpha Counter | 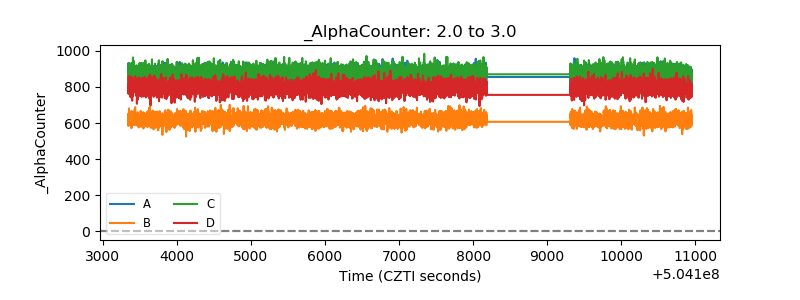 |
| _CPM_Rate | 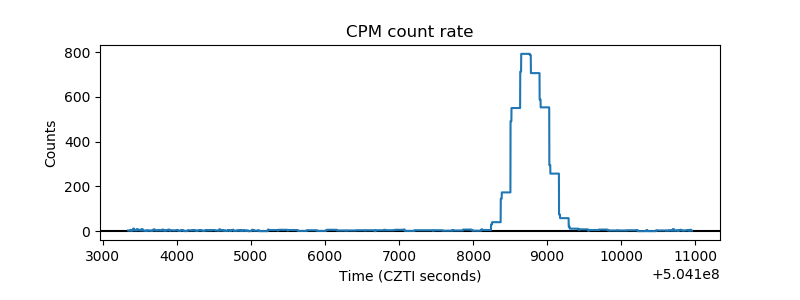 |
| CZT Counter | 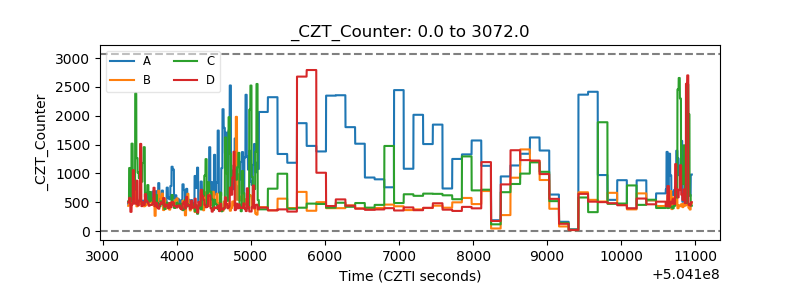 |
| +2.5 Volts monitor |  |
| +5 Volts monitor |  |
| _ROLL_ROT | 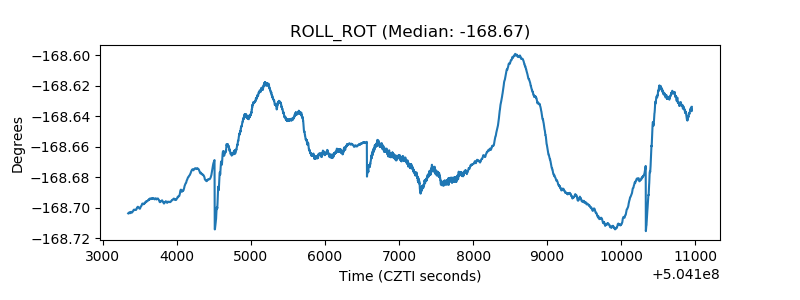 |
| _Roll_DEC | 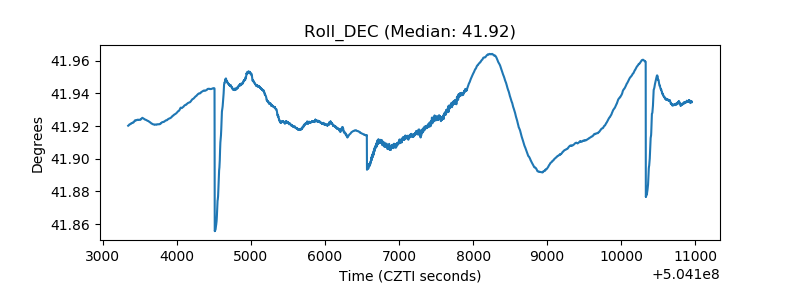 |
| _Roll_RA | 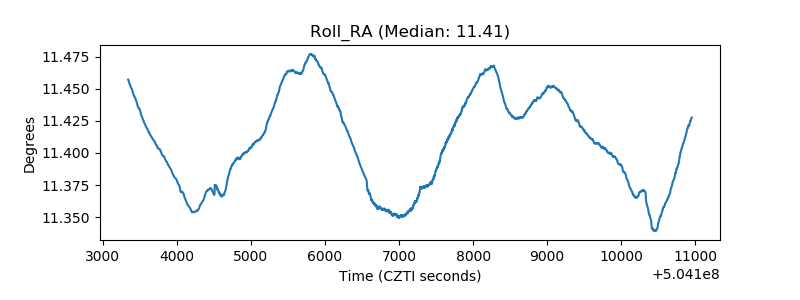 |
| Veto Counter | 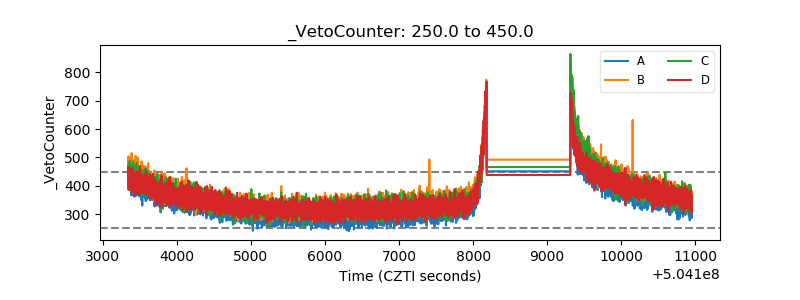 |