| Param | Original file | Final file |
|---|---|---|
| Filename | modeM0/AS1A14_009T01_9000006534_55373cztM0_level2.fits | modeM0/AS1A14_009T01_9000006534_55373cztM0_level2_quad_clean.evt |
| Size (bytes) | 3,287,456,640 | 630,642,240 |
| Size | 3.1 GB | 601.4 MB |
| Events in quadrant A | 40,924,533 | 3,806,435 |
| Events in quadrant B | 21,165,279 | 4,500,417 |
| Events in quadrant C | 30,387,902 | 3,928,059 |
| Events in quadrant D | 25,775,691 | 3,803,062 |
| Mode SS | |||
|---|---|---|---|
| Quadrant | BADHDUFLAG | Total packets | Discarded packets |
| A | 0 | 906 | 0 |
| B | 0 | 906 | 0 |
| C | 0 | 906 | 0 |
| D | 0 | 906 | 0 |
| Mode M0 | |||
|---|---|---|---|
| Quadrant | BADHDUFLAG | Total packets | Discarded packets |
| A | 0 | 153272 | 13 |
| B | 0 | 96184 | 6 |
| C | 0 | 122732 | 6 |
| D | 0 | 108450 | 6 |
| Mode M9 | |||
|---|---|---|---|
| Quadrant | BADHDUFLAG | Total packets | Discarded packets |
| A | 0 | 54 | 0 |
| B | 0 | 54 | 0 |
| C | 0 | 54 | 0 |
| D | 0 | 54 | 0 |
| Quadrant | Total seconds | Saturated seconds | Saturation percentage |
|---|---|---|---|
| A | 44507 | 5832 | 13.103557% |
| B | 44508 | 856 | 1.923250% |
| C | 44508 | 2189 | 4.918217% |
| D | 44509 | 1291 | 2.900537% |
Noise dominated data is calculated using 1-second bins in cleaned event files. If a bin has >2000 counts, and if more than 50% of those come from <1% of pixels, then it is considered to be noise-dominated and hence unusable.
| Quadrant | # 1 sec bins | Bins with >0 counts | Bins with >2000 counts | High rate bins dominated by noise | Noise dominated (total time) | Noise dominated (detector-on time) | Marked lightcurve |
|---|---|---|---|---|---|---|---|
| A | 50597 | 44508 | 4440 | 4440 | 8.78% | 9.98% | 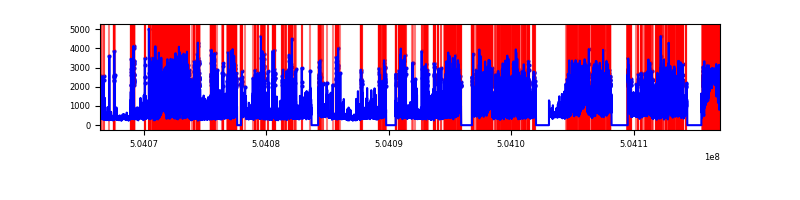 |
| B | 50597 | 44512 | 189 | 189 | 0.37% | 0.42% | 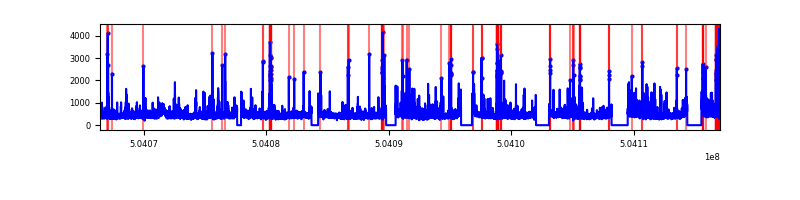 |
| C | 50597 | 44514 | 1680 | 1680 | 3.32% | 3.77% | 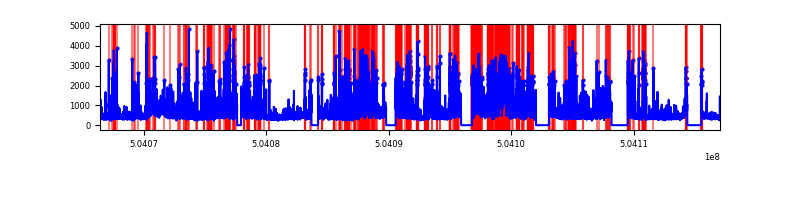 |
| D | 50598 | 44515 | 969 | 969 | 1.92% | 2.18% | 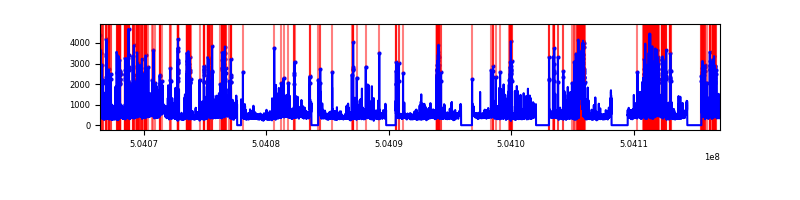 |
Top three noisy pixels from each quadrant. If the there are fewer than three noisy pixels in the level2.evt file, extra rows are filled as -1
| Pixel properties | Quadrant properties | ||||||
|---|---|---|---|---|---|---|---|
| Quadrant | DetID | PixID | Counts | Sigma | Mean | Median | Sigma |
| A | 4 | 159 | 14117693 | 12704.8 | 4520 | 4421 | 1110.9 |
| A | 12 | 115 | 4637915 | 4171.08 | 4520 | 4421 | 1110.9 |
| A | 0 | 8 | 2304467 | 2070.51 | 4520 | 4421 | 1110.9 |
| B | 0 | 199 | 988629 | 992.67 | 4664 | 4483 | 991.4 |
| B | 5 | 185 | 944222 | 947.88 | 4664 | 4483 | 991.4 |
| B | 10 | 247 | 290751 | 288.75 | 4664 | 4483 | 991.4 |
| C | 9 | 38 | 8966701 | 7263.19 | 4543 | 4500 | 1233.9 |
| C | 13 | 3 | 1931630 | 1561.79 | 4543 | 4500 | 1233.9 |
| C | 12 | 252 | 632123 | 508.64 | 4543 | 4500 | 1233.9 |
| D | 11 | 176 | 1701191 | 1316.03 | 4599 | 4396 | 1289.3 |
| D | 11 | 129 | 1597260 | 1235.42 | 4599 | 4396 | 1289.3 |
| D | 2 | 249 | 693796 | 534.7 | 4599 | 4396 | 1289.3 |
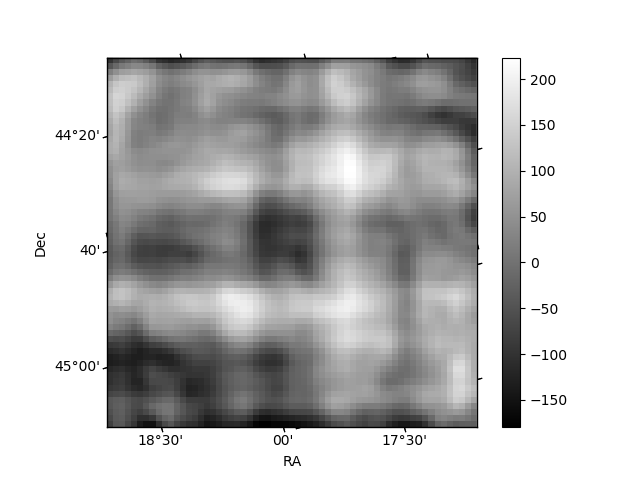
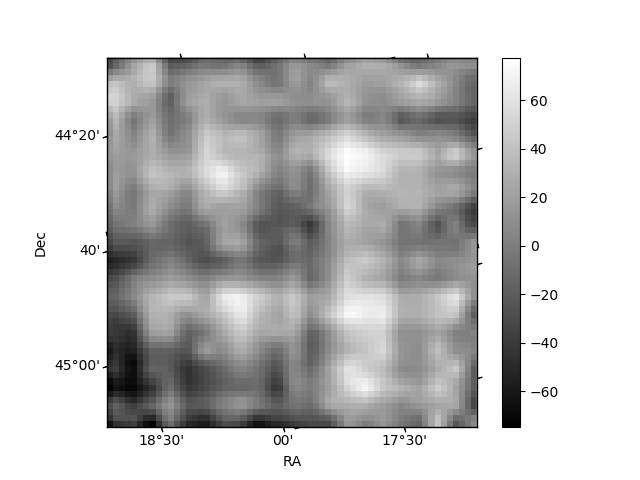
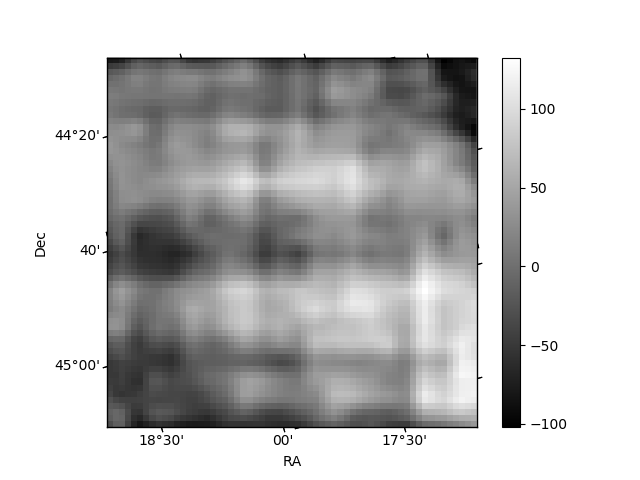
Histogram calculated using DETX and DETY for each event in the final _common_clean file
| Quadrant A | 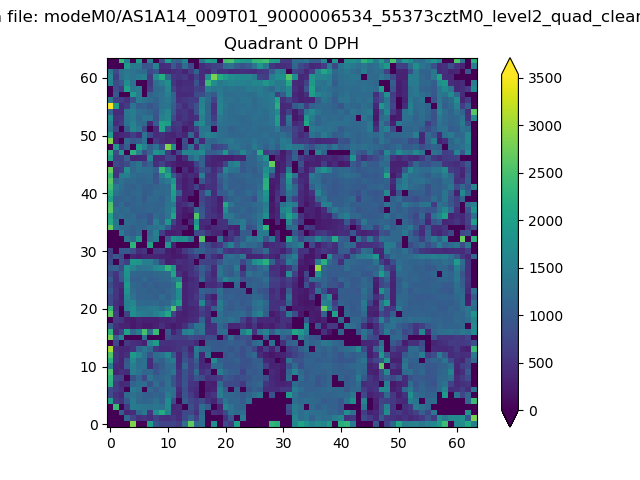 |
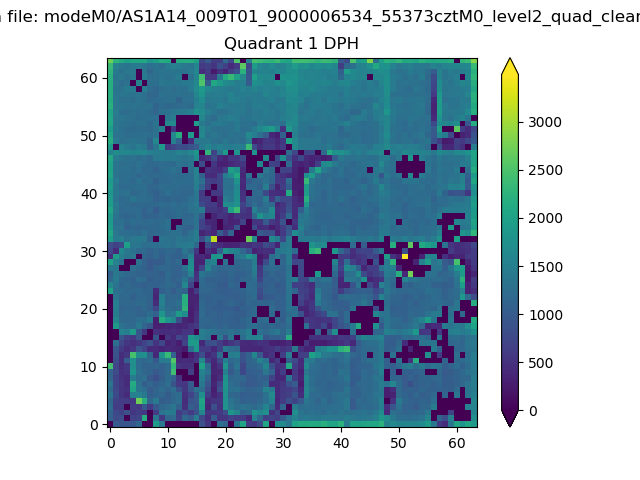 |
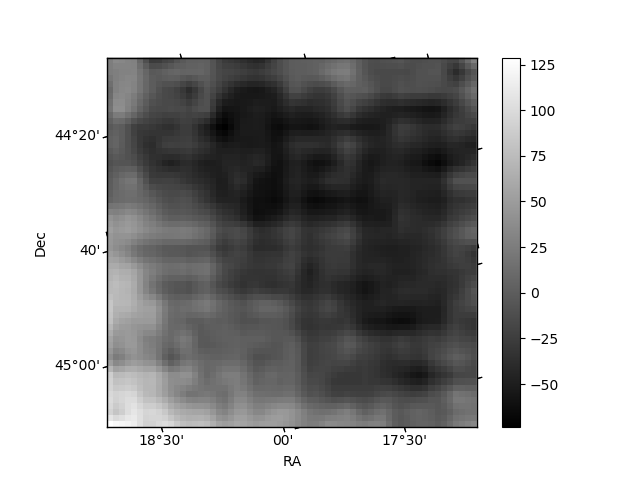
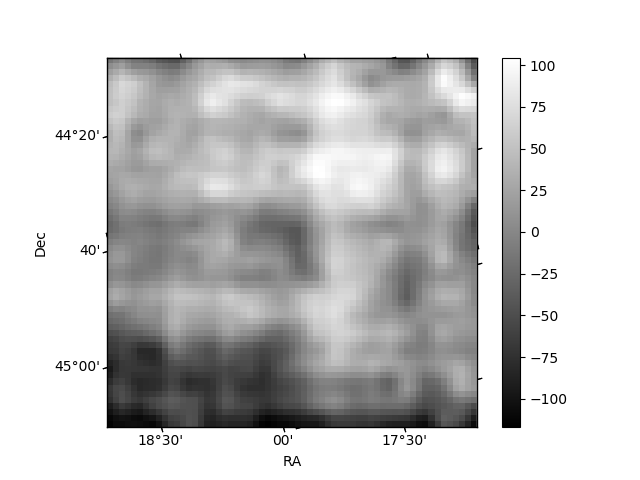
Quadrant B |
|---|---|---|---|
| Quadrant D | 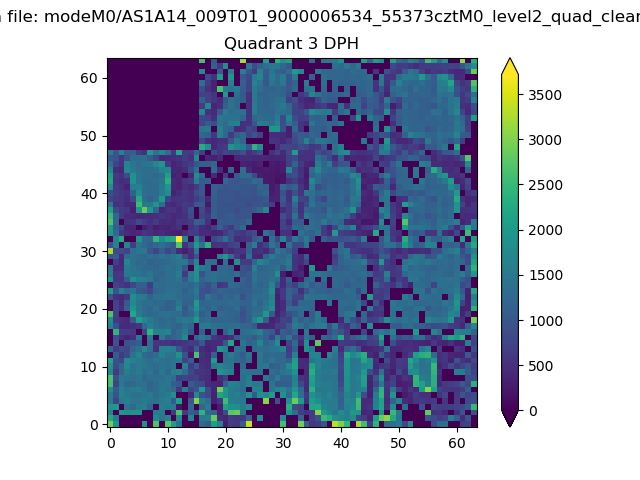 |
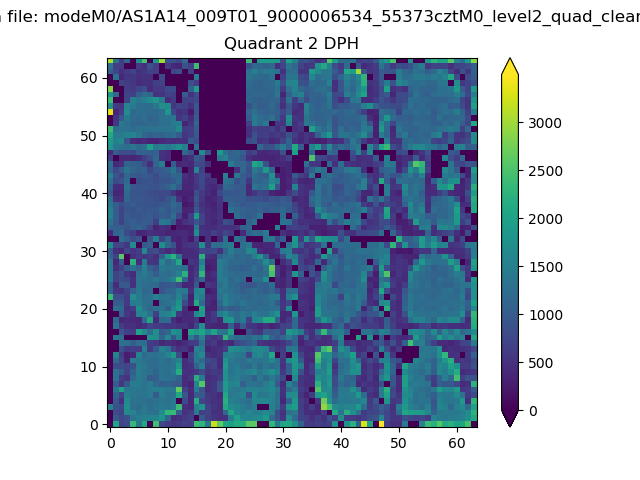 |
Quadrant C |
| Plot type | Count rate plots | Images |
|---|---|---|
| Comparison with Poisson distribution Blue bars denote a histogram of data divided into 1 sec bins. Red curve is a Poisson curve with rate = median count rate of data. |
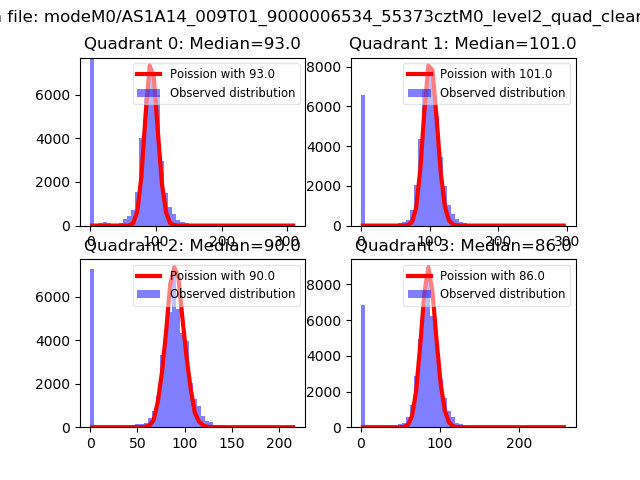 |
 |
| Quadrant-wise count rates Data is divided into 100 sec bins |
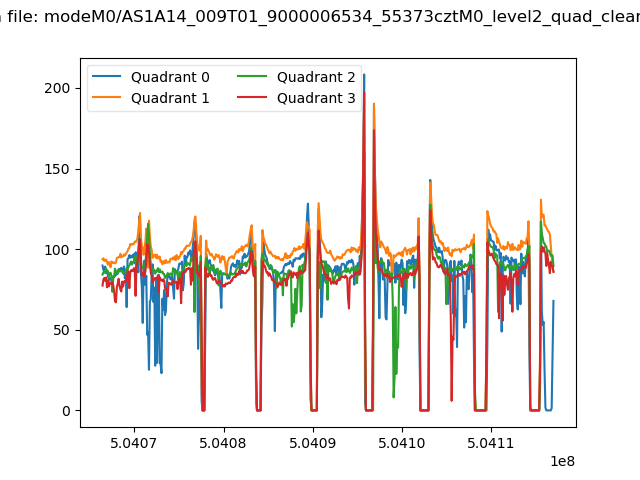 |
|
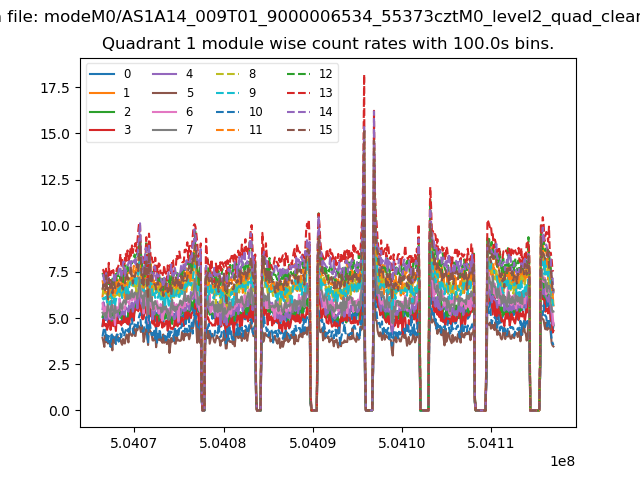
| Module-wise count rates for Quadrant A Data is divided into 100 sec bins |
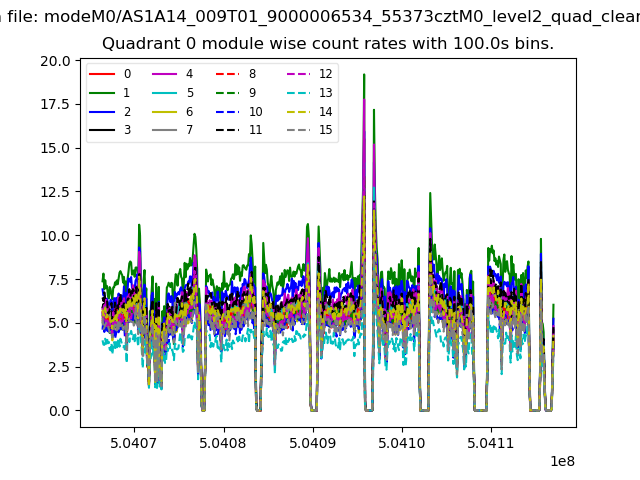 |
 |
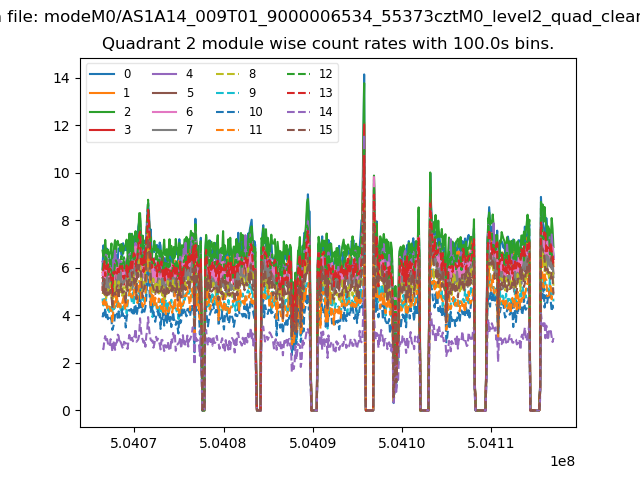
| Module-wise count rates for Quadrant B Data is divided into 100 sec bins |
 |
 |
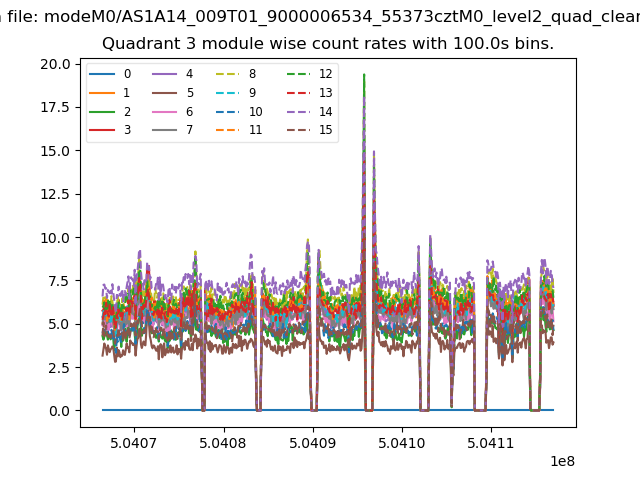
| Module-wise count rates for Quadrant C Data is divided into 100 sec bins |
 |
 |
| Module-wise count rates for Quadrant D Data is divided into 100 sec bins |
 |
 |
| Parameter | Plot |
|---|---|
| CZT HV Monitor | 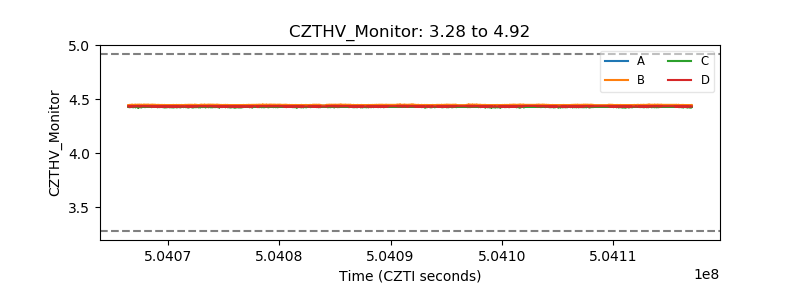 |
| D_VDD | 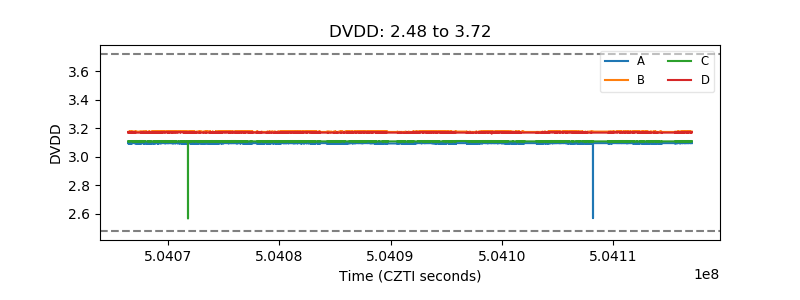 |
| Temperature 1 | 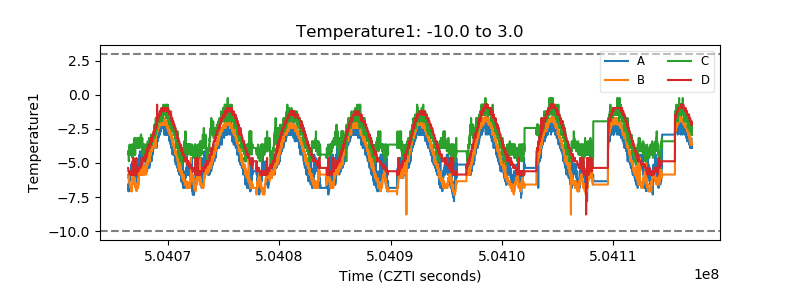 |
| Veto HV Monitor | 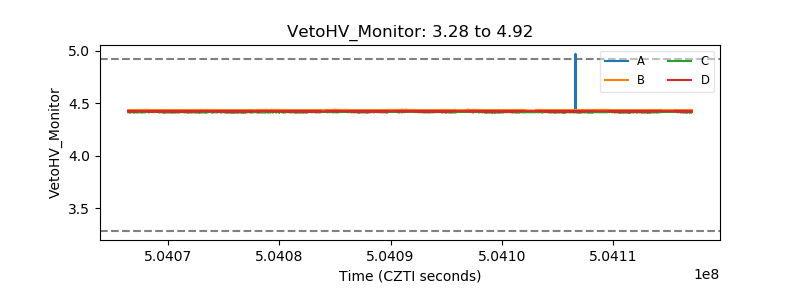 |
| Veto LLD | 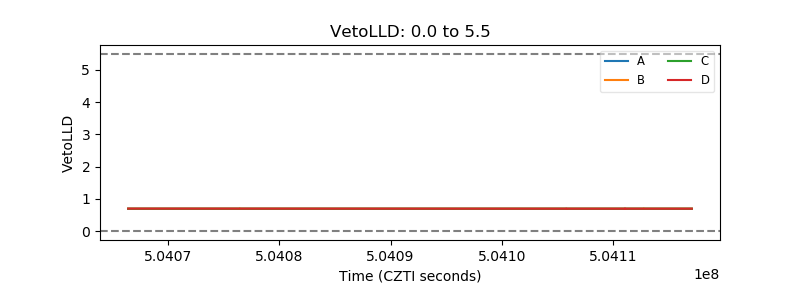 |
| Alpha Counter | 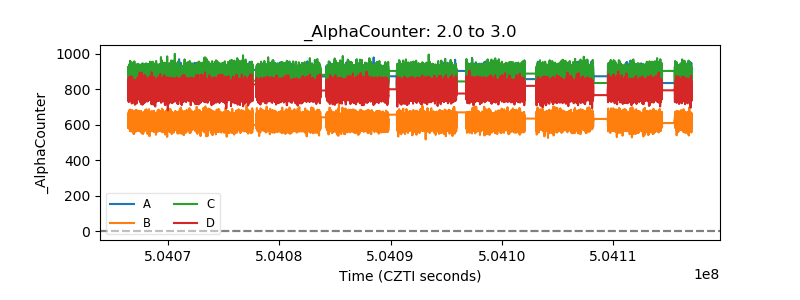 |
| _CPM_Rate | 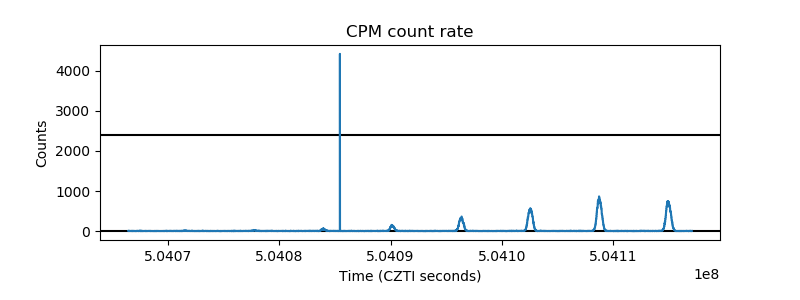 |
| CZT Counter | 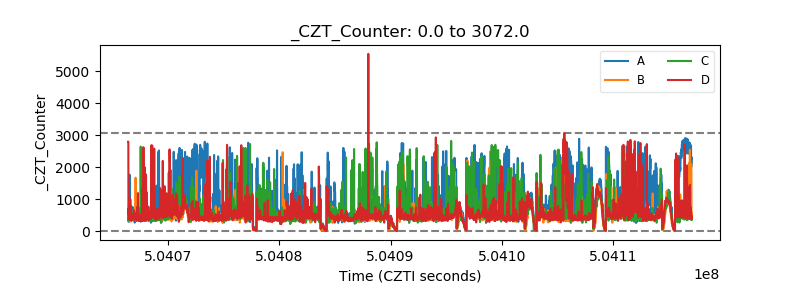 |
| +2.5 Volts monitor |  |
| +5 Volts monitor |  |
| _ROLL_ROT | 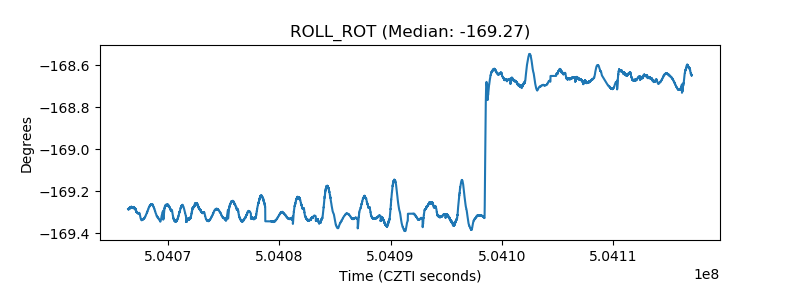 |
| _Roll_DEC | 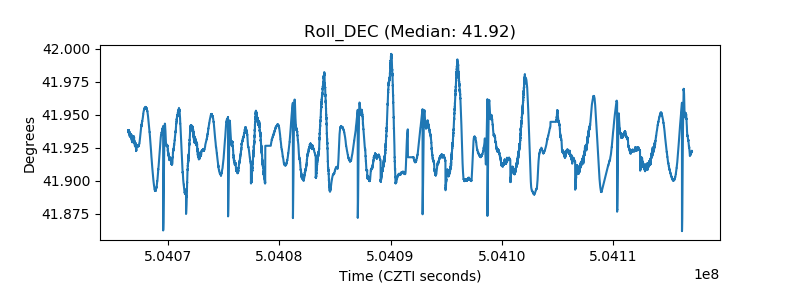 |
| _Roll_RA | 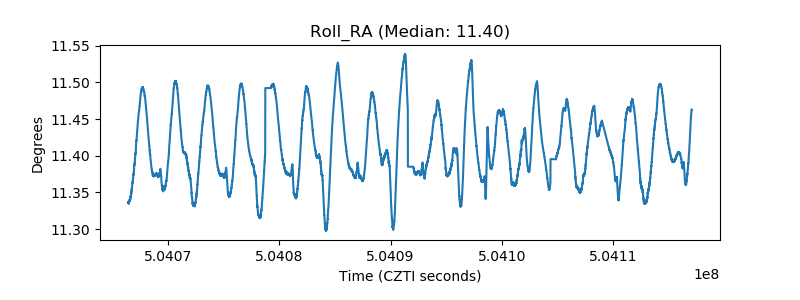 |
| Veto Counter | 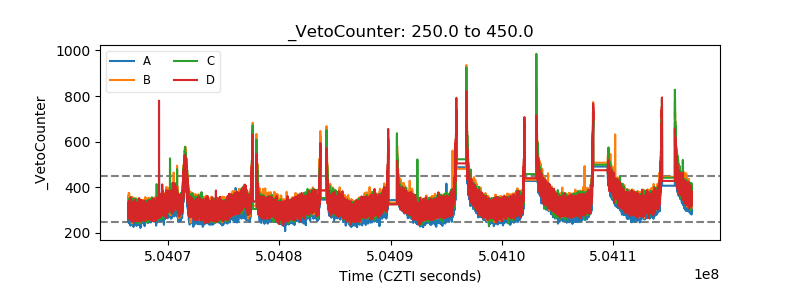 |