| Param | Original file | Final file |
|---|---|---|
| Filename | modeM0/AS1A14_009T01_9000006534_55374cztM0_level2.fits | modeM0/AS1A14_009T01_9000006534_55374cztM0_level2_quad_clean.evt |
| Size (bytes) | 529,496,640 | 90,250,560 |
| Size | 505.0 MB | 86.1 MB |
| Events in quadrant A | 8,573,571 | 457,574 |
| Events in quadrant B | 3,550,477 | 666,369 |
| Events in quadrant C | 3,133,682 | 600,849 |
| Events in quadrant D | 3,846,347 | 562,451 |
| Mode SS | |||
|---|---|---|---|
| Quadrant | BADHDUFLAG | Total packets | Discarded packets |
| A | 0 | 130 | 0 |
| B | 0 | 130 | 0 |
| C | 0 | 130 | 0 |
| D | 0 | 130 | 0 |
| Mode M0 | |||
|---|---|---|---|
| Quadrant | BADHDUFLAG | Total packets | Discarded packets |
| A | 0 | 29967 | 2 |
| B | 0 | 15251 | 1 |
| C | 0 | 14167 | 1 |
| D | 0 | 16062 | 1 |
| Mode M9 | |||
|---|---|---|---|
| Quadrant | BADHDUFLAG | Total packets | Discarded packets |
| A | 0 | 11 | 0 |
| B | 0 | 11 | 0 |
| C | 0 | 11 | 0 |
| D | 0 | 11 | 0 |
| Quadrant | Total seconds | Saturated seconds | Saturation percentage |
|---|---|---|---|
| A | 6384 | 1927 | 30.184837% |
| B | 6384 | 173 | 2.709900% |
| C | 6385 | 120 | 1.879405% |
| D | 6385 | 229 | 3.586531% |
Noise dominated data is calculated using 1-second bins in cleaned event files. If a bin has >2000 counts, and if more than 50% of those come from <1% of pixels, then it is considered to be noise-dominated and hence unusable.
| Quadrant | # 1 sec bins | Bins with >0 counts | Bins with >2000 counts | High rate bins dominated by noise | Noise dominated (total time) | Noise dominated (detector-on time) | Marked lightcurve |
|---|---|---|---|---|---|---|---|
| A | 7504 | 6384 | 1723 | 1723 | 22.96% | 26.99% | 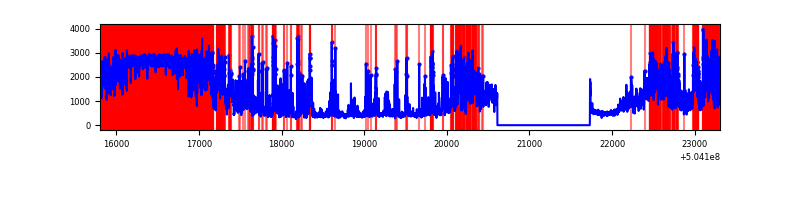 |
| B | 7504 | 6384 | 77 | 77 | 1.03% | 1.21% | 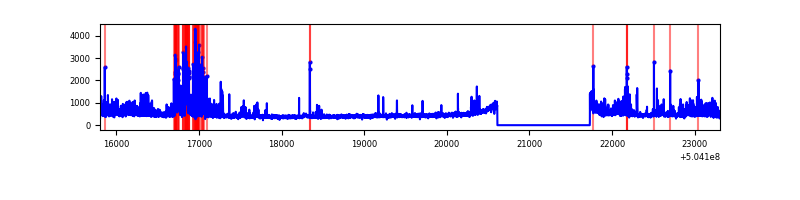 |
| C | 7505 | 6385 | 73 | 73 | 0.97% | 1.14% | 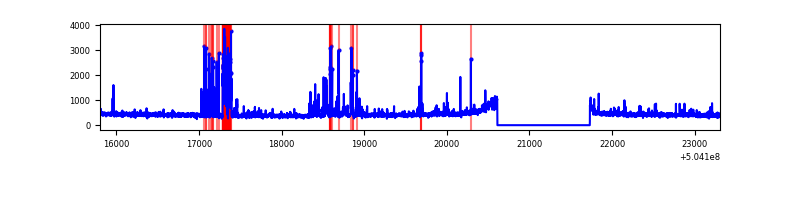 |
| D | 7505 | 6385 | 158 | 158 | 2.11% | 2.47% | 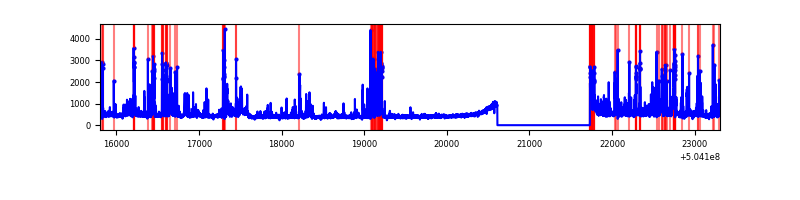 |
Top three noisy pixels from each quadrant. If the there are fewer than three noisy pixels in the level2.evt file, extra rows are filled as -1
| Pixel properties | Quadrant properties | ||||||
|---|---|---|---|---|---|---|---|
| Quadrant | DetID | PixID | Counts | Sigma | Mean | Median | Sigma |
| A | 12 | 115 | 2920018 | 19462.9 | 603 | 588 | 150.0 |
| A | 4 | 159 | 2814202 | 18757.46 | 603 | 588 | 150.0 |
| A | 0 | 8 | 398517 | 2652.86 | 603 | 588 | 150.0 |
| B | 0 | 199 | 517497 | 3569.16 | 678 | 652 | 144.8 |
| B | 5 | 185 | 233139 | 1605.48 | 678 | 652 | 144.8 |
| B | 10 | 247 | 51011 | 347.76 | 678 | 652 | 144.8 |
| C | 12 | 249 | 322673 | 1741.13 | 676 | 667 | 184.9 |
| C | 13 | 3 | 54953 | 293.53 | 676 | 667 | 184.9 |
| C | 14 | 254 | 41745 | 222.11 | 676 | 667 | 184.9 |
| D | 2 | 249 | 298801 | 1603.2 | 670 | 642 | 186.0 |
| D | 11 | 176 | 294726 | 1581.28 | 670 | 642 | 186.0 |
| D | 8 | 160 | 144899 | 775.67 | 670 | 642 | 186.0 |
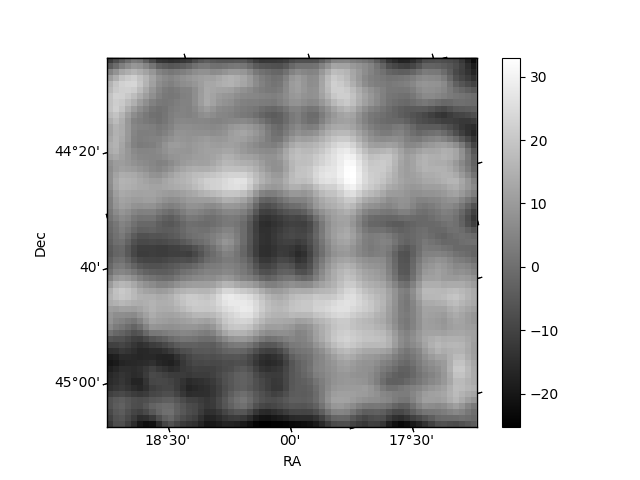
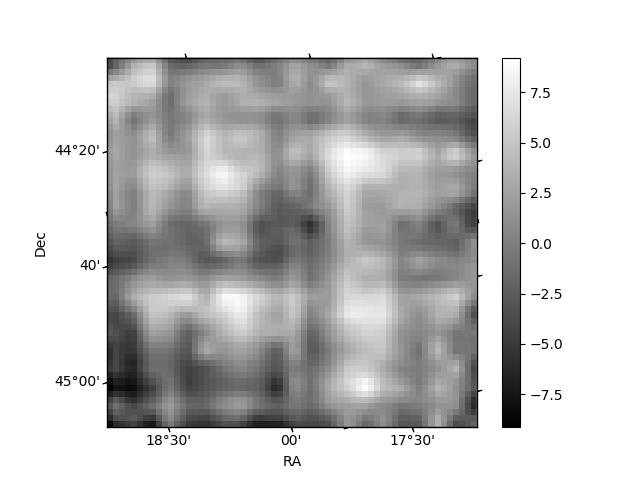
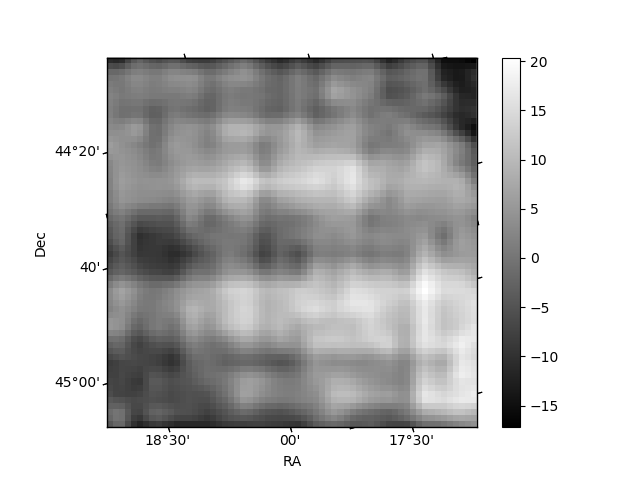
Histogram calculated using DETX and DETY for each event in the final _common_clean file
| Quadrant A | 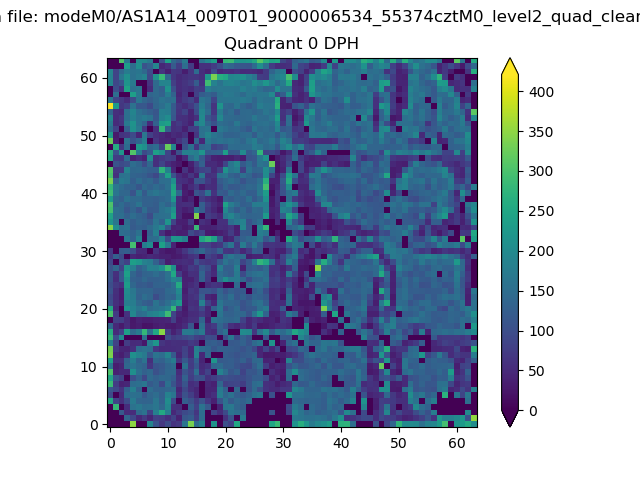 |
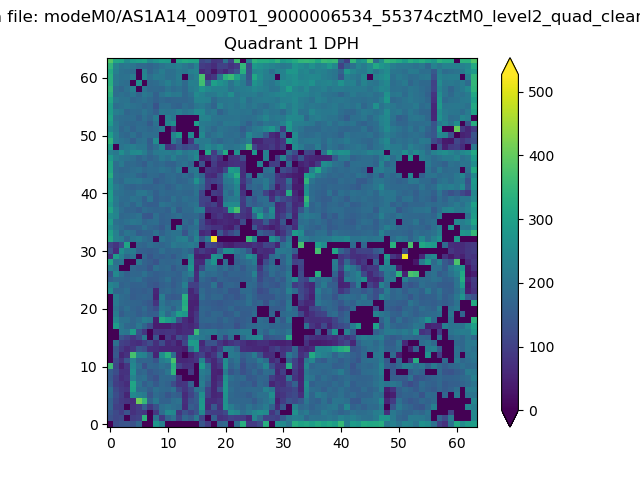 |
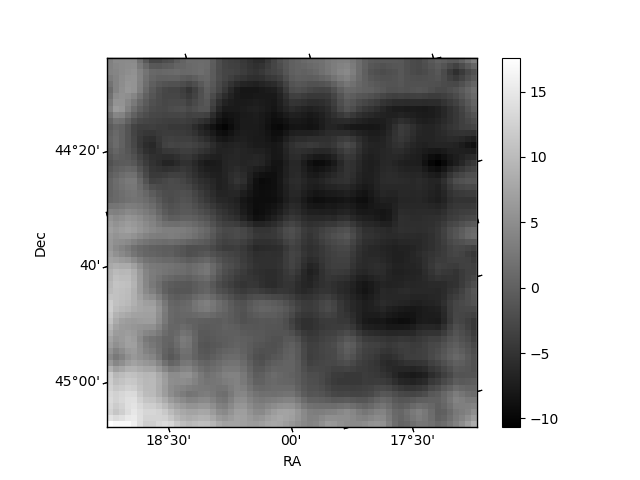
Quadrant B |
|---|---|---|---|
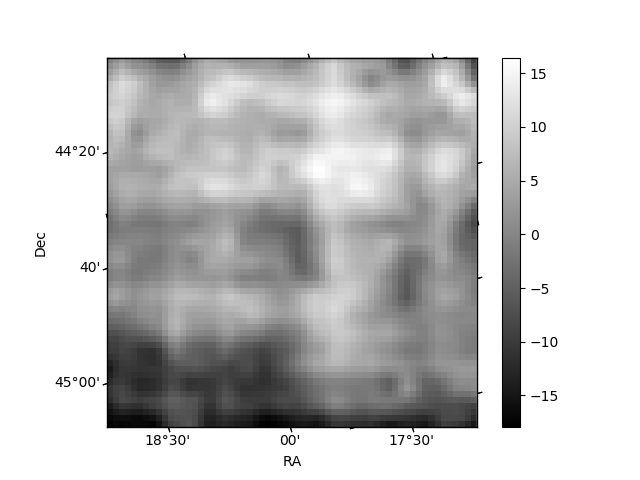
| Quadrant D | 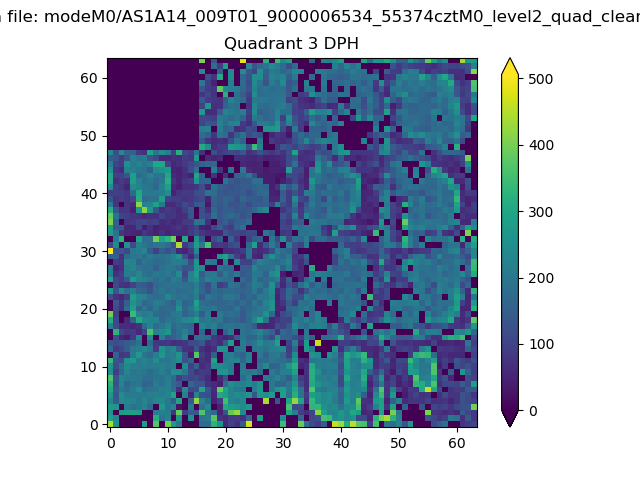 |
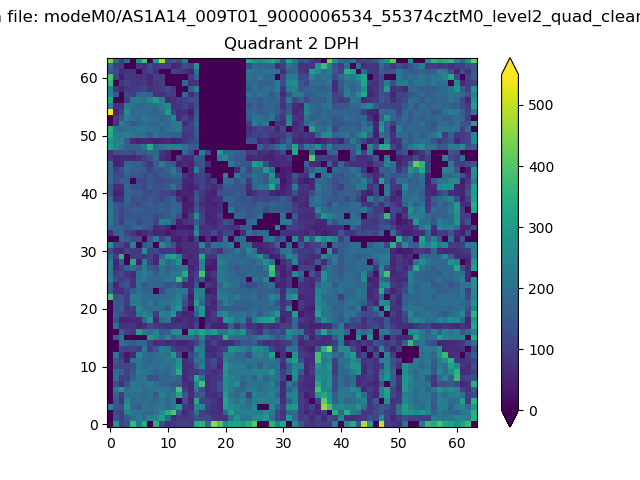 |
Quadrant C |
| Plot type | Count rate plots | Images |
|---|---|---|
| Comparison with Poisson distribution Blue bars denote a histogram of data divided into 1 sec bins. Red curve is a Poisson curve with rate = median count rate of data. |
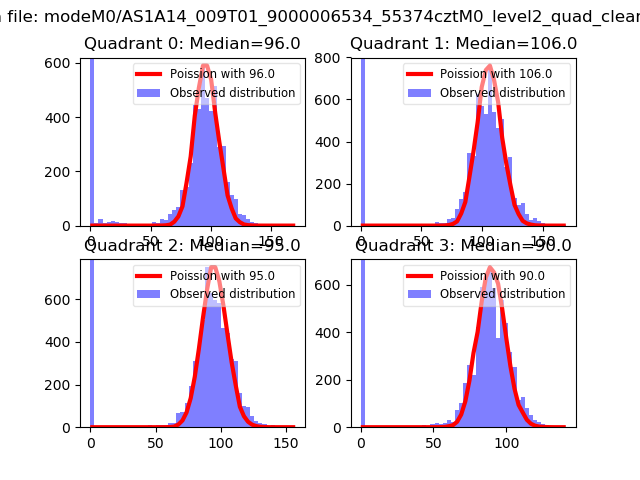 |
 |
| Quadrant-wise count rates Data is divided into 100 sec bins |
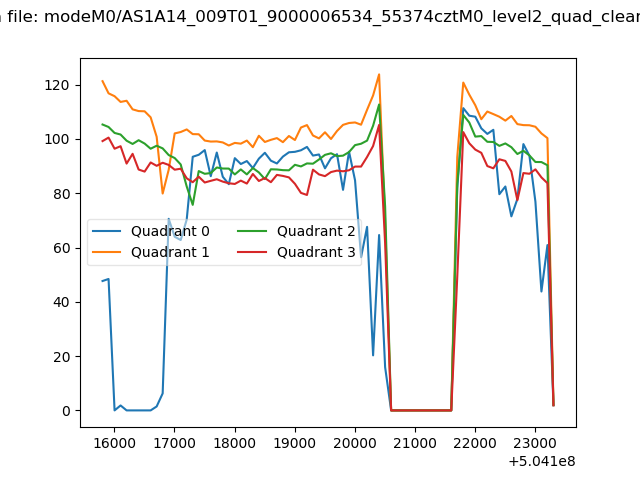 |
|
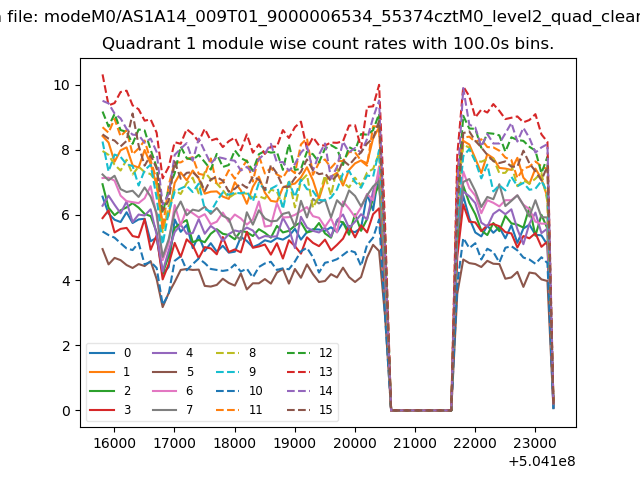
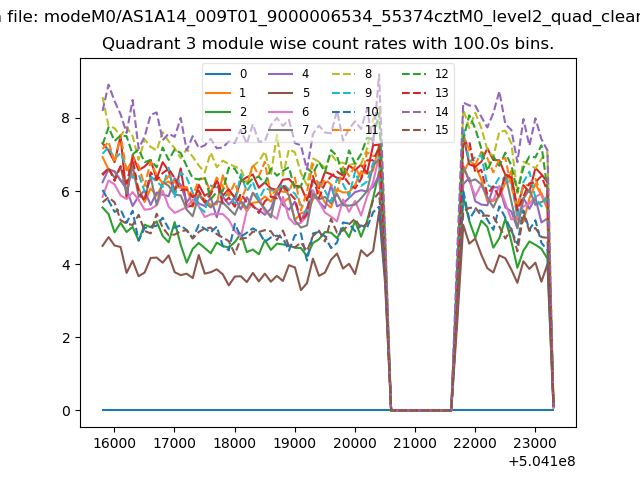
| Module-wise count rates for Quadrant A Data is divided into 100 sec bins |
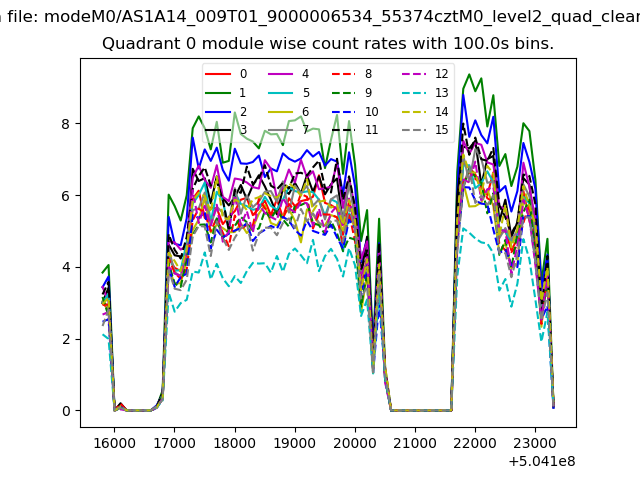 |
 |
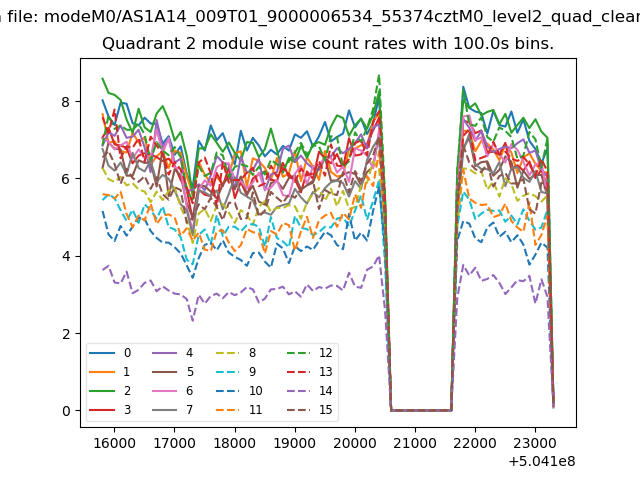
| Module-wise count rates for Quadrant B Data is divided into 100 sec bins |
 |
 |
| Module-wise count rates for Quadrant C Data is divided into 100 sec bins |
 |
 |
| Module-wise count rates for Quadrant D Data is divided into 100 sec bins |
 |
 |
| Parameter | Plot |
|---|---|
| CZT HV Monitor | 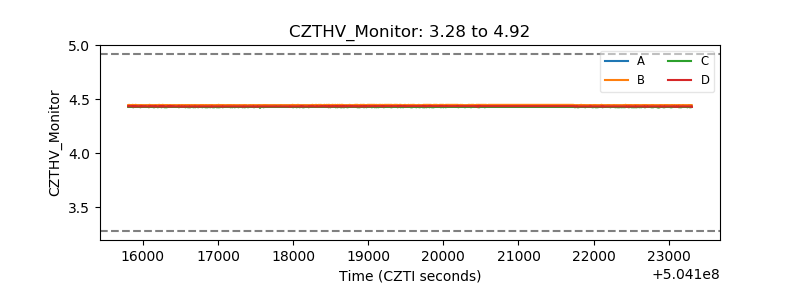 |
| D_VDD | 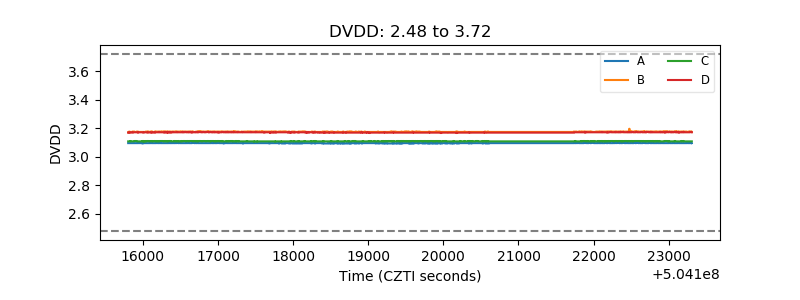 |
| Temperature 1 | 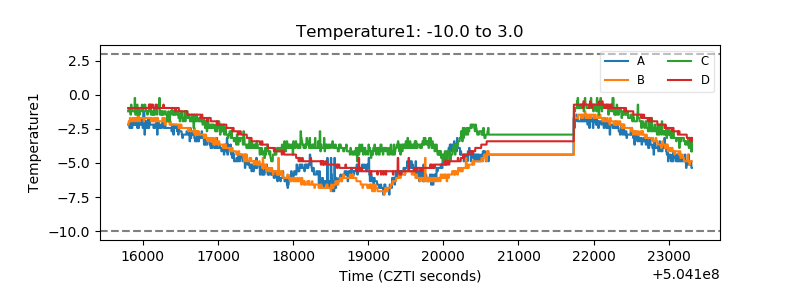 |
| Veto HV Monitor | 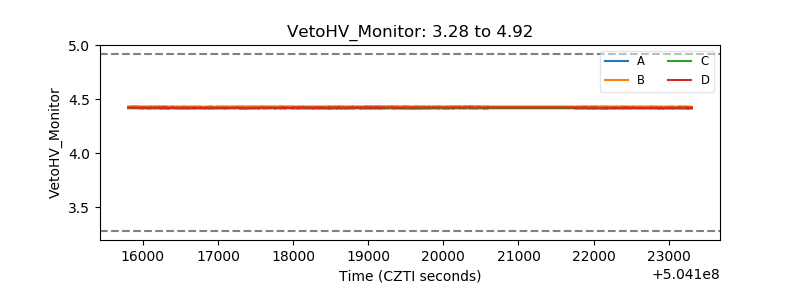 |
| Veto LLD | 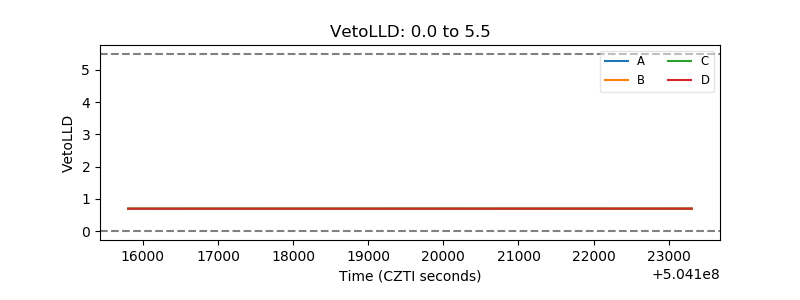 |
| Alpha Counter | 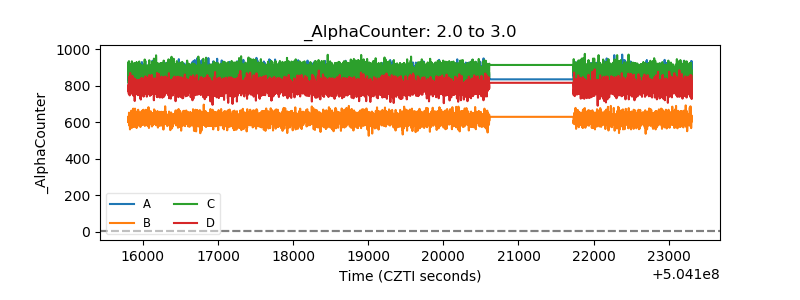 |
| _CPM_Rate | 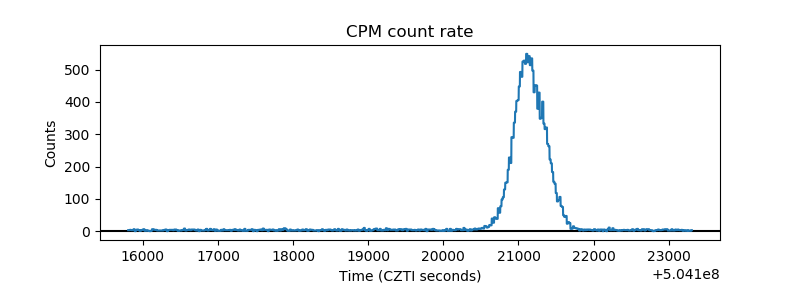 |
| CZT Counter | 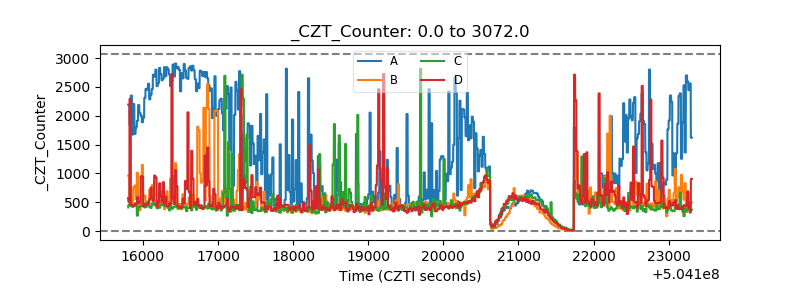 |
| +2.5 Volts monitor |  |
| +5 Volts monitor | 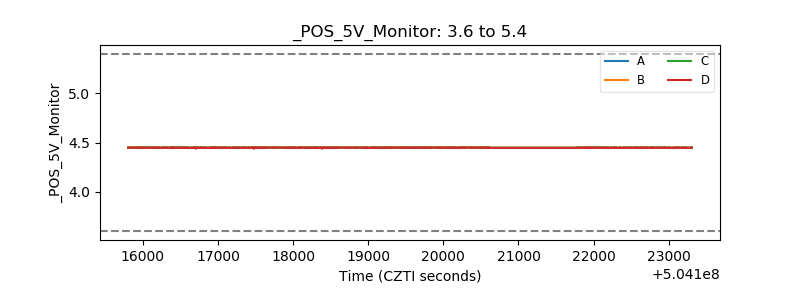 |
| _ROLL_ROT | 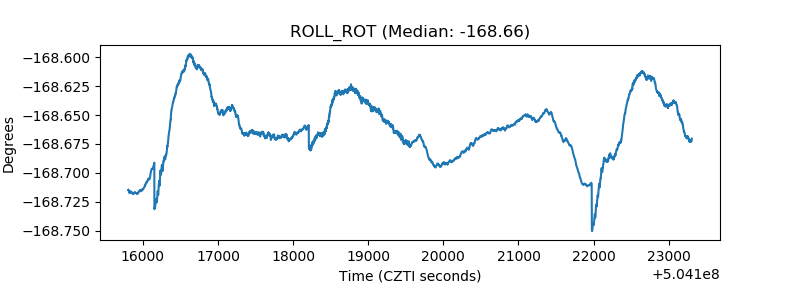 |
| _Roll_DEC | 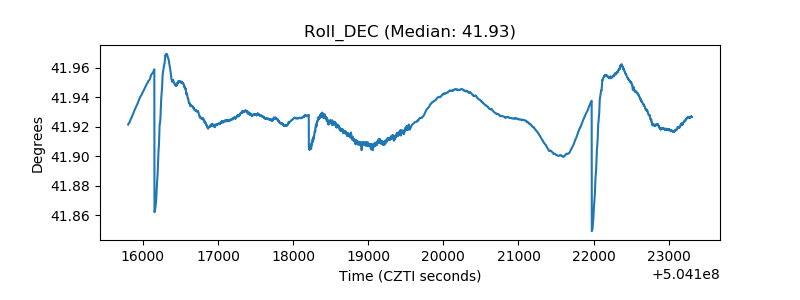 |
| _Roll_RA | 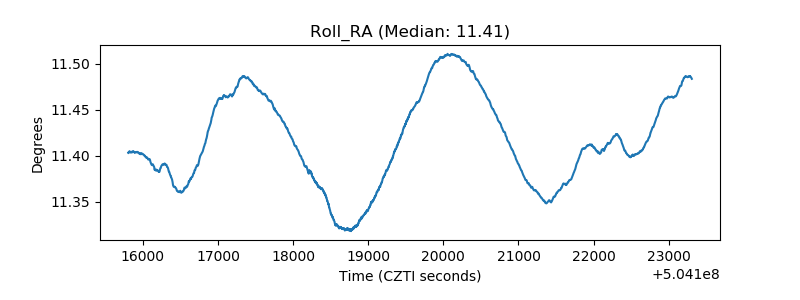 |
| Veto Counter | 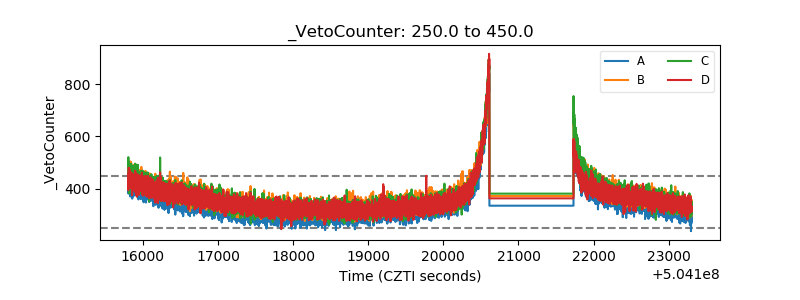 |