| Param | Original file | Final file |
|---|---|---|
| Filename | modeM0/AS1A14_009T01_9000006534_55375cztM0_level2.fits | modeM0/AS1A14_009T01_9000006534_55375cztM0_level2_quad_clean.evt |
| Size (bytes) | 486,069,120 | 96,730,560 |
| Size | 463.6 MB | 92.2 MB |
| Events in quadrant A | 7,079,145 | 583,310 |
| Events in quadrant B | 3,369,389 | 686,784 |
| Events in quadrant C | 3,032,175 | 617,882 |
| Events in quadrant D | 3,994,094 | 576,491 |
| Mode SS | |||
|---|---|---|---|
| Quadrant | BADHDUFLAG | Total packets | Discarded packets |
| A | 0 | 134 | 0 |
| B | 0 | 134 | 0 |
| C | 0 | 134 | 0 |
| D | 0 | 134 | 0 |
| Mode M0 | |||
|---|---|---|---|
| Quadrant | BADHDUFLAG | Total packets | Discarded packets |
| A | 0 | 25643 | 2 |
| B | 0 | 14964 | 2 |
| C | 0 | 14233 | 2 |
| D | 0 | 16655 | 2 |
| Mode M9 | |||
|---|---|---|---|
| Quadrant | BADHDUFLAG | Total packets | Discarded packets |
| A | 0 | 16 | 0 |
| B | 0 | 16 | 0 |
| C | 0 | 17 | 0 |
| D | 0 | 17 | 0 |
| Quadrant | Total seconds | Saturated seconds | Saturation percentage |
|---|---|---|---|
| A | 6667 | 882 | 13.229339% |
| B | 6667 | 97 | 1.454927% |
| C | 6667 | 89 | 1.334933% |
| D | 6667 | 203 | 3.044848% |
Noise dominated data is calculated using 1-second bins in cleaned event files. If a bin has >2000 counts, and if more than 50% of those come from <1% of pixels, then it is considered to be noise-dominated and hence unusable.
| Quadrant | # 1 sec bins | Bins with >0 counts | Bins with >2000 counts | High rate bins dominated by noise | Noise dominated (total time) | Noise dominated (detector-on time) | Marked lightcurve |
|---|---|---|---|---|---|---|---|
| A | 7642 | 6667 | 688 | 688 | 9.00% | 10.32% | 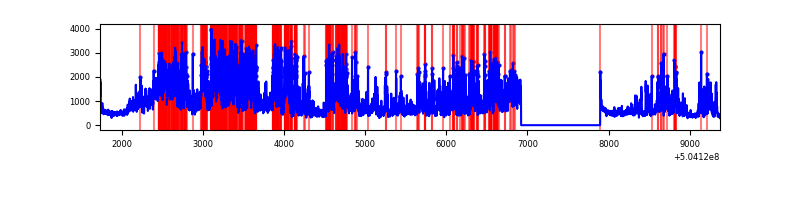 |
| B | 7642 | 6668 | 19 | 19 | 0.25% | 0.28% | 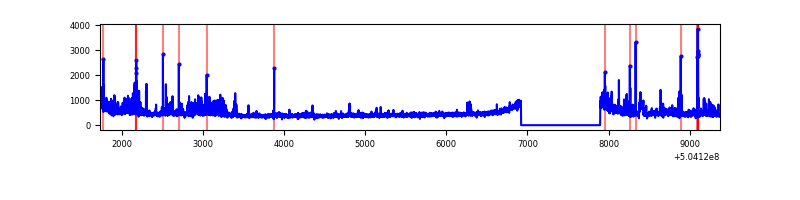 |
| C | 7642 | 6668 | 32 | 32 | 0.42% | 0.48% | 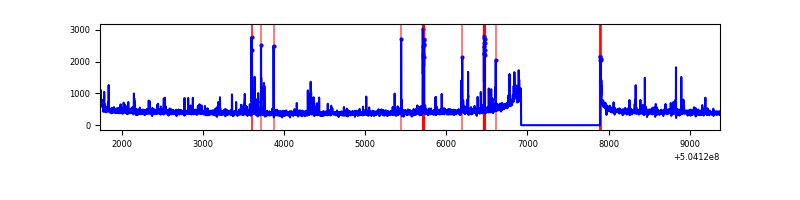 |
| D | 7642 | 6668 | 113 | 113 | 1.48% | 1.69% | 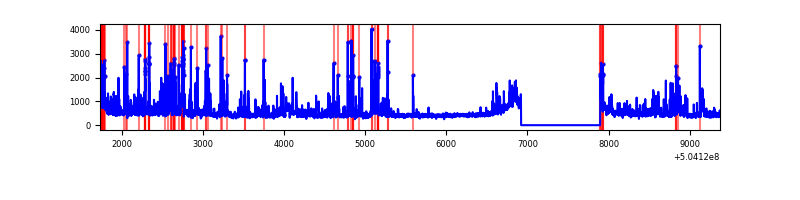 |
Top three noisy pixels from each quadrant. If the there are fewer than three noisy pixels in the level2.evt file, extra rows are filled as -1
| Pixel properties | Quadrant properties | ||||||
|---|---|---|---|---|---|---|---|
| Quadrant | DetID | PixID | Counts | Sigma | Mean | Median | Sigma |
| A | 4 | 159 | 3763477 | 22069.95 | 690 | 675 | 170.5 |
| A | 0 | 8 | 458862 | 2687.4 | 690 | 675 | 170.5 |
| A | 12 | 115 | 83553 | 486.1 | 690 | 675 | 170.5 |
| B | 0 | 199 | 333239 | 2195.33 | 708 | 681 | 151.5 |
| B | 10 | 247 | 107406 | 704.53 | 708 | 681 | 151.5 |
| B | 5 | 185 | 73322 | 479.53 | 708 | 681 | 151.5 |
| C | 12 | 249 | 101310 | 517.41 | 707 | 699 | 194.5 |
| C | 13 | 3 | 65037 | 330.87 | 707 | 699 | 194.5 |
| C | 12 | 250 | 25468 | 127.38 | 707 | 699 | 194.5 |
| D | 11 | 176 | 377413 | 1922.25 | 699 | 670 | 196.0 |
| D | 2 | 249 | 230854 | 1174.46 | 699 | 670 | 196.0 |
| D | 3 | 12 | 109532 | 555.44 | 699 | 670 | 196.0 |
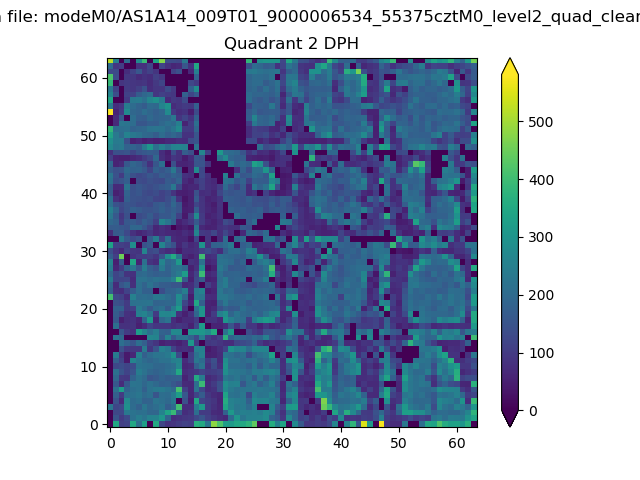
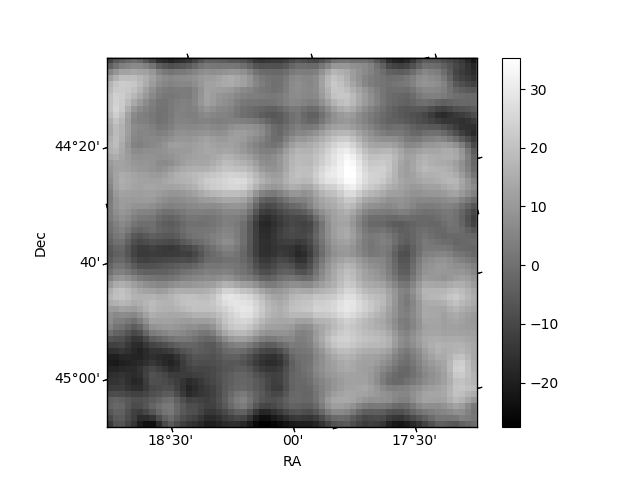
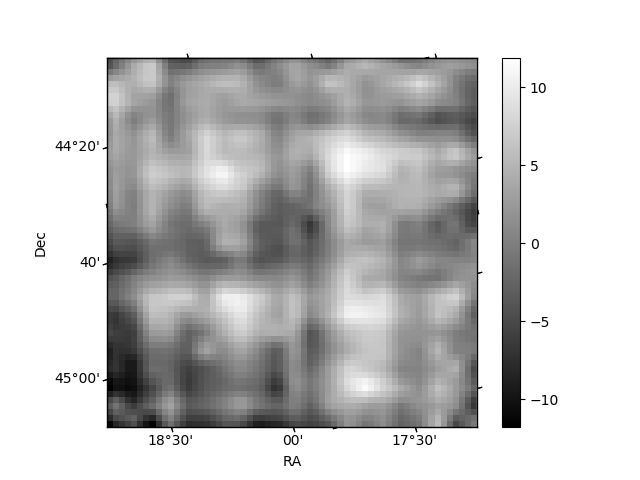
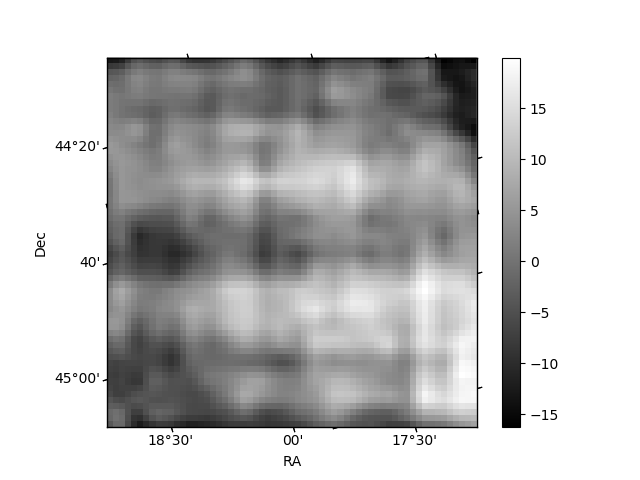
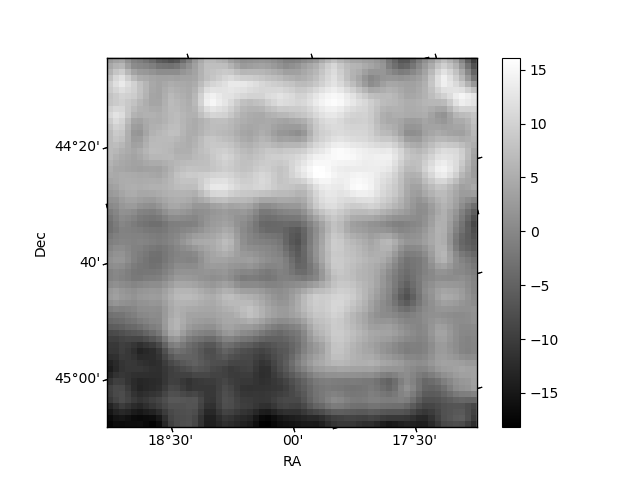
Histogram calculated using DETX and DETY for each event in the final _common_clean file
| Quadrant A | 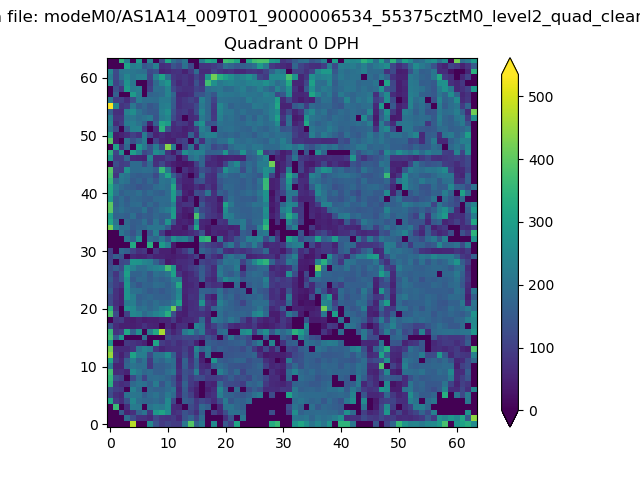 |
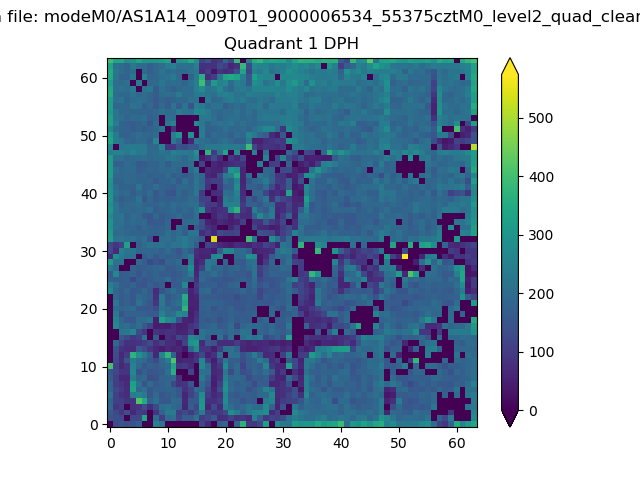 |
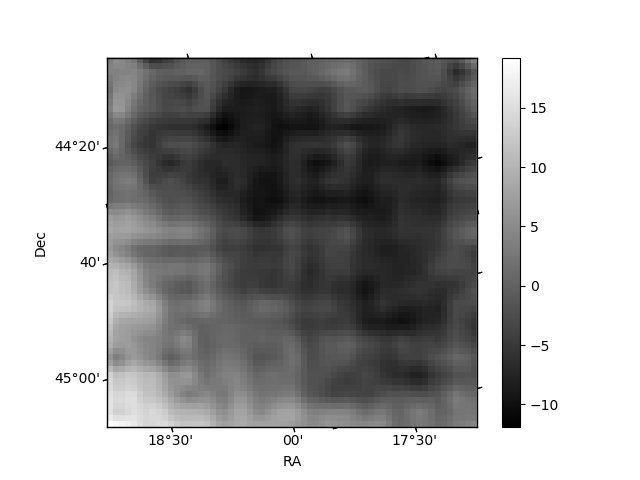
Quadrant B |
|---|---|---|---|
| Quadrant D | 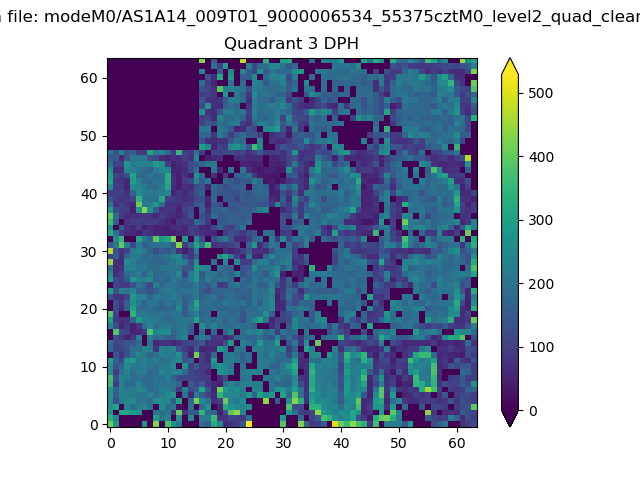 |
 |
Quadrant C |
| Plot type | Count rate plots | Images |
|---|---|---|
| Comparison with Poisson distribution Blue bars denote a histogram of data divided into 1 sec bins. Red curve is a Poisson curve with rate = median count rate of data. |
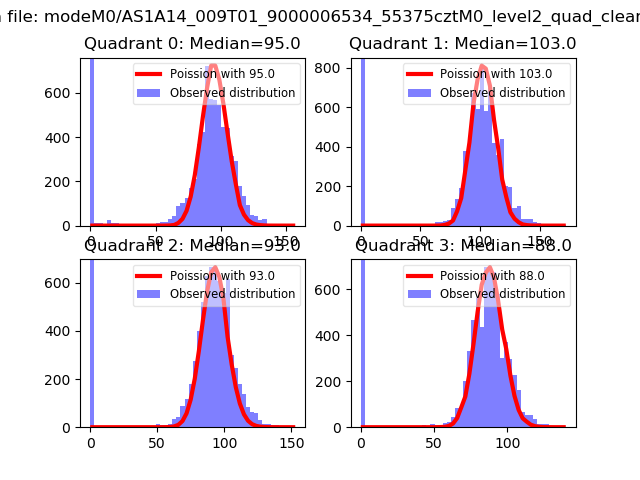 |
 |
| Quadrant-wise count rates Data is divided into 100 sec bins |
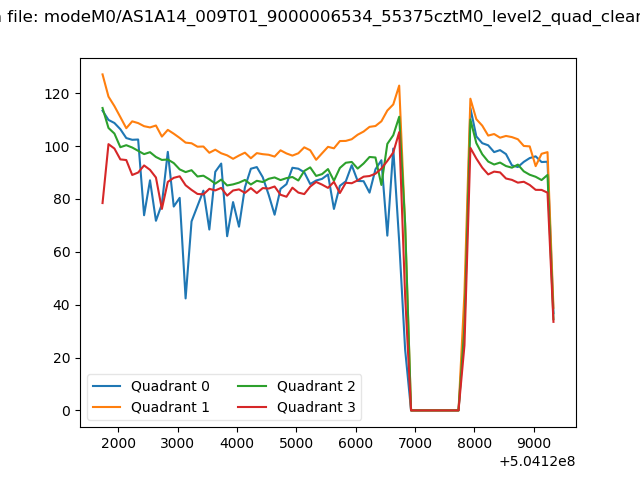 |
|
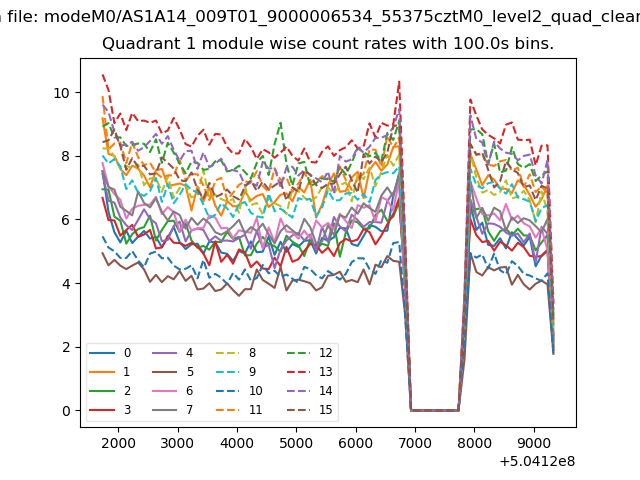
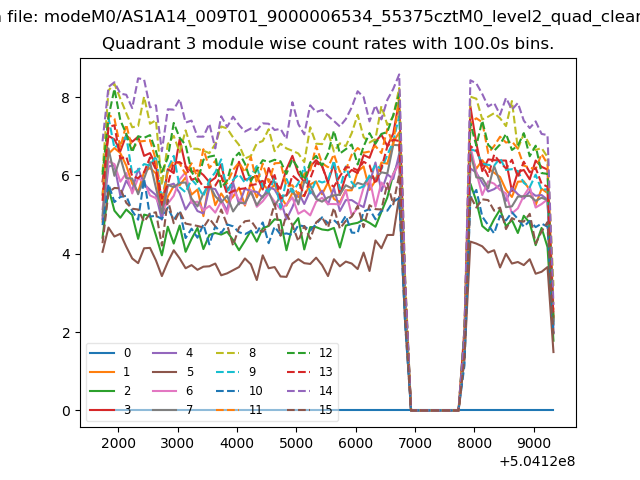
| Module-wise count rates for Quadrant A Data is divided into 100 sec bins |
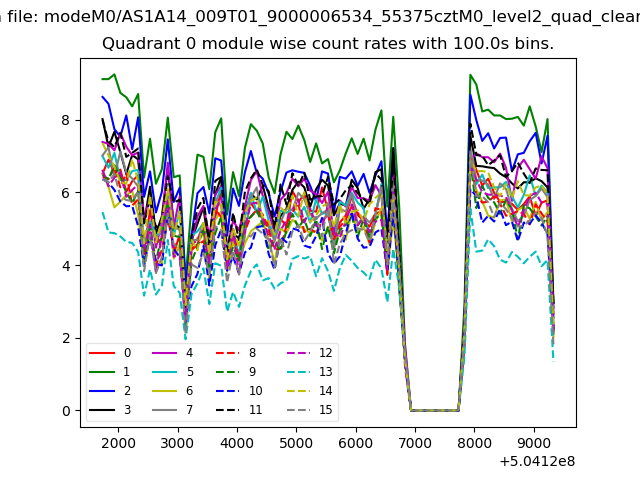 |
 |
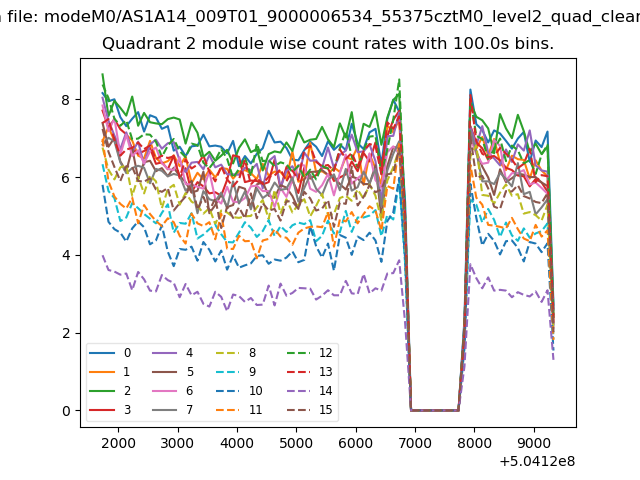
| Module-wise count rates for Quadrant B Data is divided into 100 sec bins |
 |
 |
| Module-wise count rates for Quadrant C Data is divided into 100 sec bins |
 |
 |
| Module-wise count rates for Quadrant D Data is divided into 100 sec bins |
 |
 |
| Parameter | Plot |
|---|---|
| CZT HV Monitor | 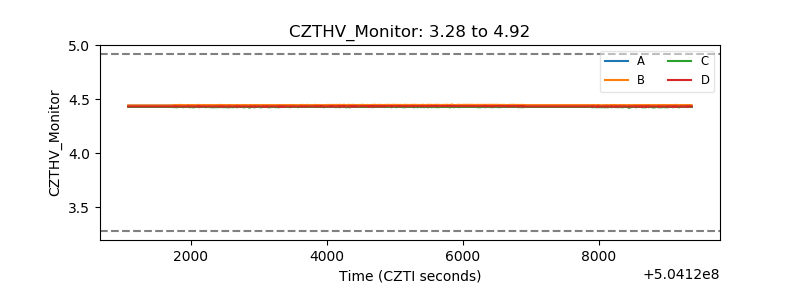 |
| D_VDD | 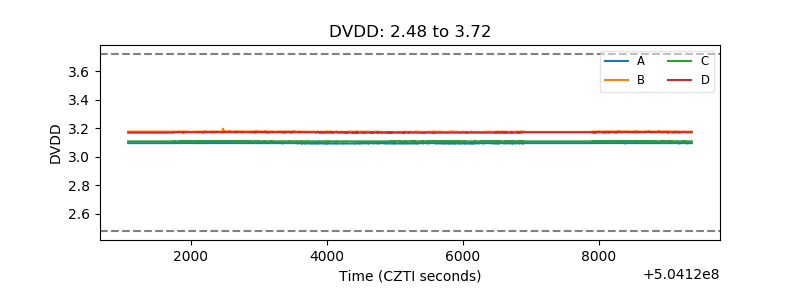 |
| Temperature 1 | 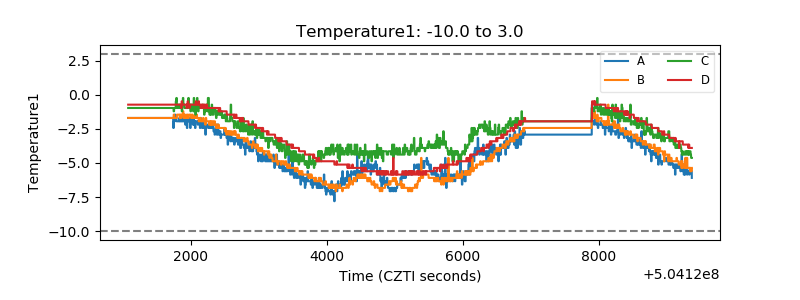 |
| Veto HV Monitor |  |
| Veto LLD | 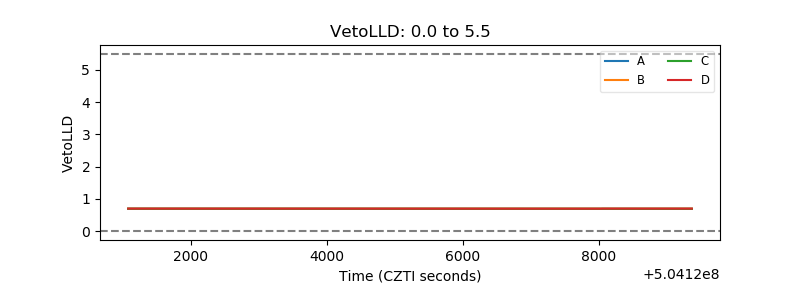 |
| Alpha Counter | 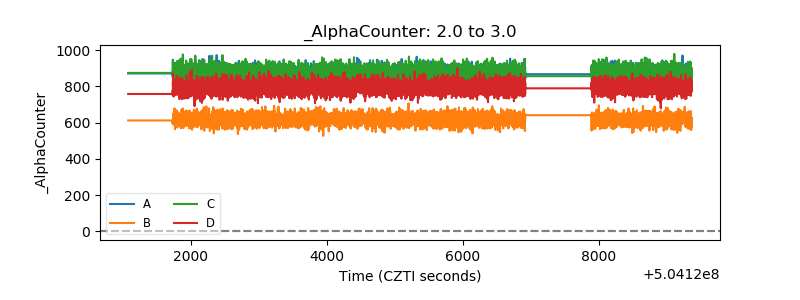 |
| _CPM_Rate | 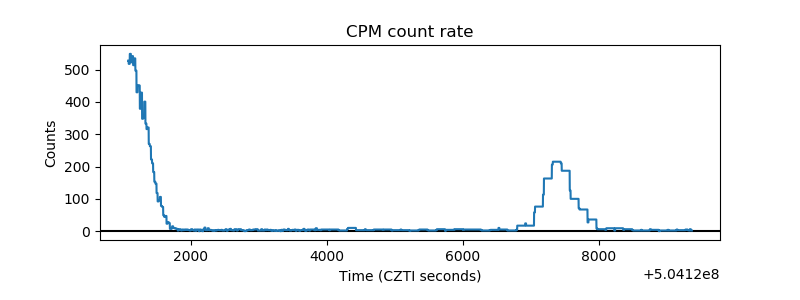 |
| CZT Counter | 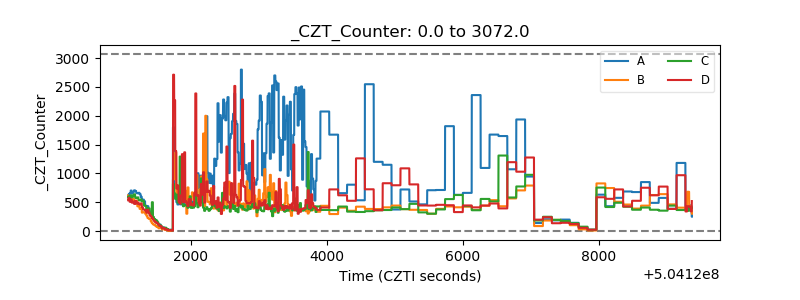 |
| +2.5 Volts monitor |  |
| +5 Volts monitor |  |
| _ROLL_ROT | 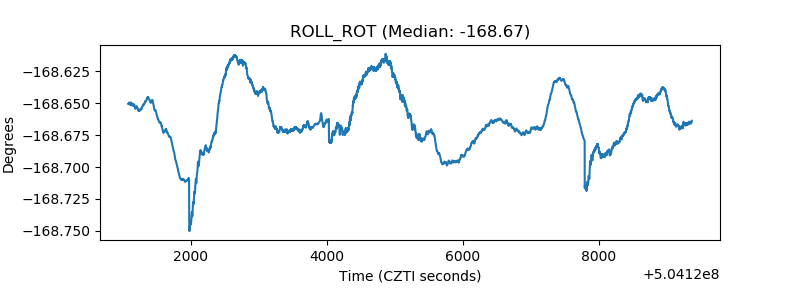 |
| _Roll_DEC | 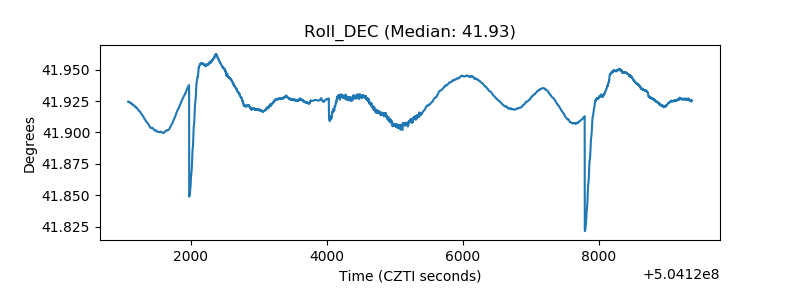 |
| _Roll_RA | 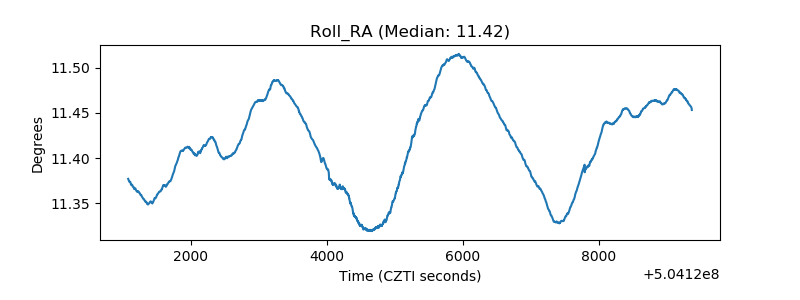 |
| Veto Counter | 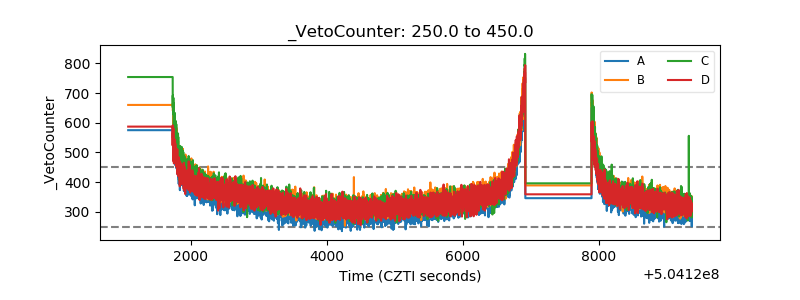 |