| Param | Original file | Final file |
|---|---|---|
| Filename | modeM0/AS1A14_009T01_9000006534_55376cztM0_level2.fits | modeM0/AS1A14_009T01_9000006534_55376cztM0_level2_quad_clean.evt |
| Size (bytes) | 446,878,080 | 101,050,560 |
| Size | 426.2 MB | 96.4 MB |
| Events in quadrant A | 5,560,739 | 630,477 |
| Events in quadrant B | 3,513,728 | 704,255 |
| Events in quadrant C | 3,144,406 | 639,579 |
| Events in quadrant D | 3,779,621 | 598,385 |
| Mode SS | |||
|---|---|---|---|
| Quadrant | BADHDUFLAG | Total packets | Discarded packets |
| A | 0 | 142 | 0 |
| B | 0 | 142 | 0 |
| C | 0 | 142 | 0 |
| D | 0 | 142 | 0 |
| Mode M0 | |||
|---|---|---|---|
| Quadrant | BADHDUFLAG | Total packets | Discarded packets |
| A | 0 | 21439 | 2 |
| B | 0 | 15716 | 2 |
| C | 0 | 14875 | 2 |
| D | 0 | 16487 | 2 |
| Mode M9 | |||
|---|---|---|---|
| Quadrant | BADHDUFLAG | Total packets | Discarded packets |
| A | 0 | 12 | 0 |
| B | 0 | 13 | 0 |
| C | 0 | 13 | 0 |
| D | 0 | 13 | 0 |
| Quadrant | Total seconds | Saturated seconds | Saturation percentage |
|---|---|---|---|
| A | 6991 | 409 | 5.850379% |
| B | 6991 | 160 | 2.288657% |
| C | 6991 | 63 | 0.901159% |
| D | 6991 | 163 | 2.331569% |
Noise dominated data is calculated using 1-second bins in cleaned event files. If a bin has >2000 counts, and if more than 50% of those come from <1% of pixels, then it is considered to be noise-dominated and hence unusable.
| Quadrant | # 1 sec bins | Bins with >0 counts | Bins with >2000 counts | High rate bins dominated by noise | Noise dominated (total time) | Noise dominated (detector-on time) | Marked lightcurve |
|---|---|---|---|---|---|---|---|
| A | 7691 | 6991 | 290 | 290 | 3.77% | 4.15% | 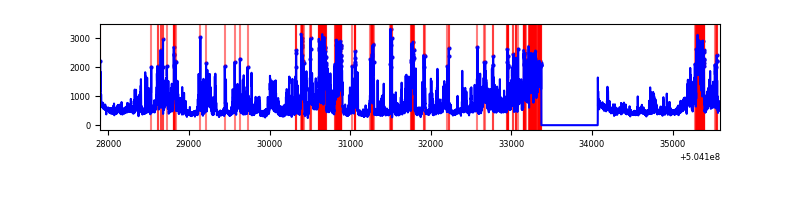 |
| B | 7691 | 6992 | 39 | 39 | 0.51% | 0.56% | 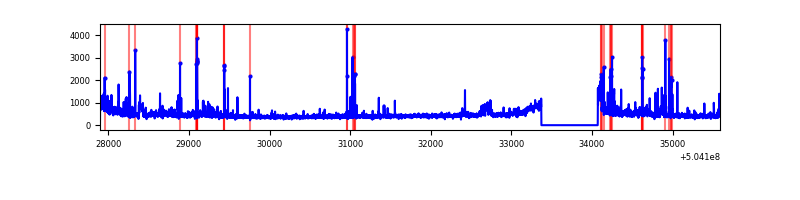 |
| C | 7691 | 6992 | 23 | 23 | 0.30% | 0.33% | 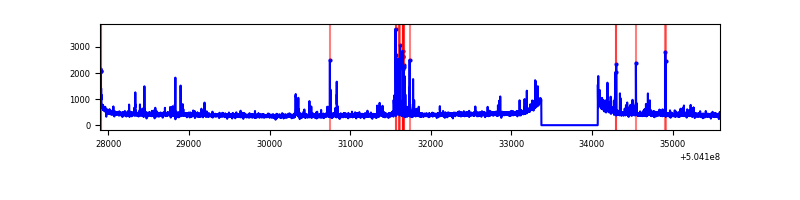 |
| D | 7691 | 6992 | 101 | 101 | 1.31% | 1.44% | 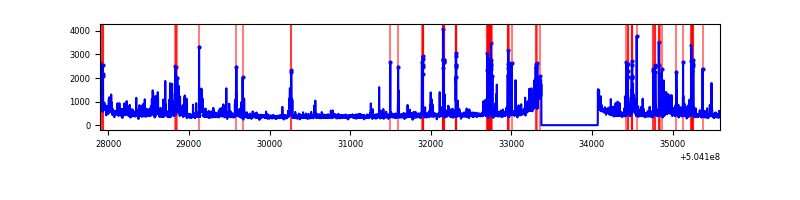 |
Top three noisy pixels from each quadrant. If the there are fewer than three noisy pixels in the level2.evt file, extra rows are filled as -1
| Pixel properties | Quadrant properties | ||||||
|---|---|---|---|---|---|---|---|
| Quadrant | DetID | PixID | Counts | Sigma | Mean | Median | Sigma |
| A | 4 | 159 | 2226800 | 12312.21 | 726 | 709 | 180.8 |
| A | 12 | 115 | 325785 | 1797.95 | 726 | 709 | 180.8 |
| A | 0 | 8 | 124867 | 686.7 | 726 | 709 | 180.8 |
| B | 0 | 199 | 246483 | 1569.94 | 732 | 706 | 156.6 |
| B | 5 | 185 | 164407 | 1045.67 | 732 | 706 | 156.6 |
| B | 10 | 247 | 103646 | 657.55 | 732 | 706 | 156.6 |
| C | 13 | 3 | 169860 | 841.98 | 729 | 719 | 200.9 |
| C | 12 | 249 | 26967 | 130.66 | 729 | 719 | 200.9 |
| C | 9 | 38 | 26290 | 127.29 | 729 | 719 | 200.9 |
| D | 11 | 129 | 250728 | 1220.03 | 724 | 693 | 204.9 |
| D | 2 | 249 | 133094 | 646.04 | 724 | 693 | 204.9 |
| D | 11 | 176 | 124515 | 604.18 | 724 | 693 | 204.9 |
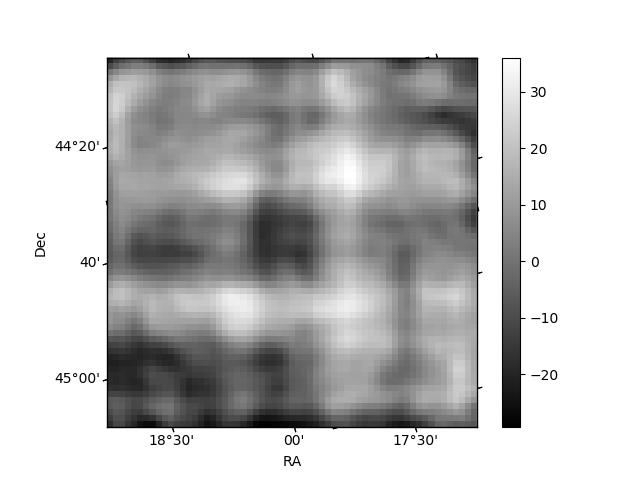
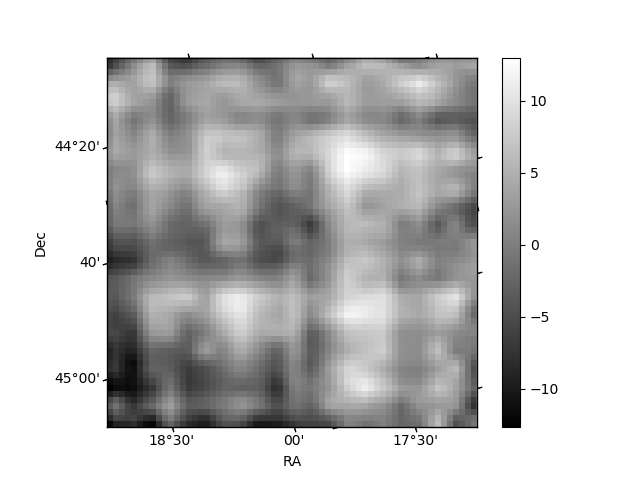
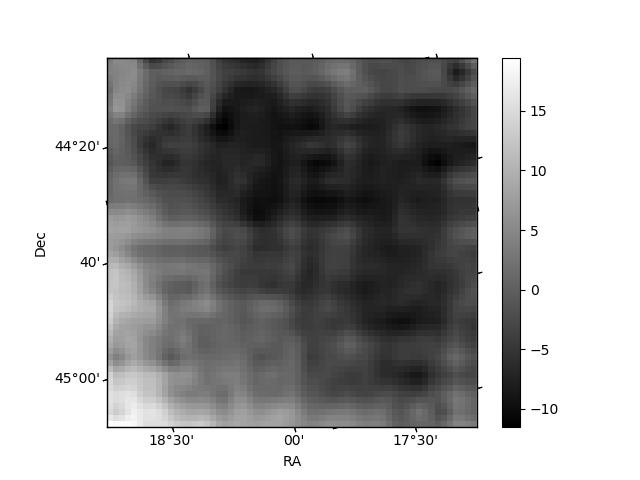
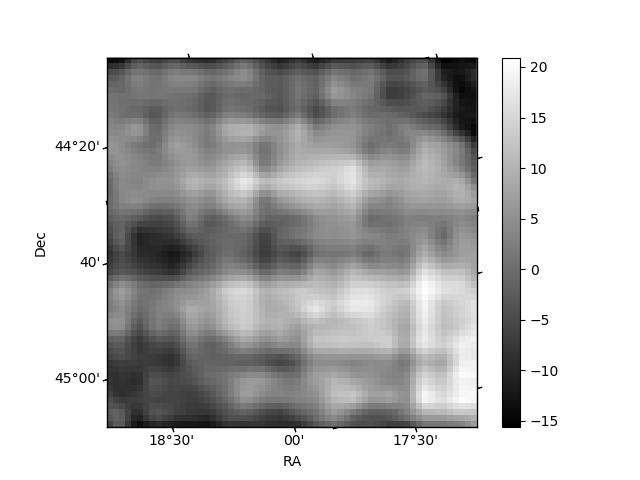
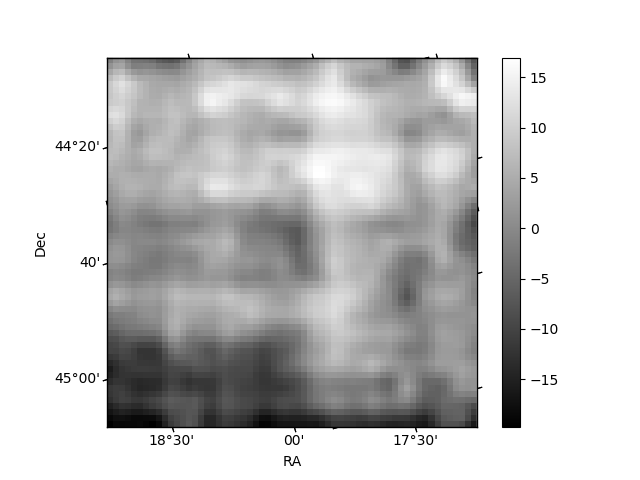
Histogram calculated using DETX and DETY for each event in the final _common_clean file
| Quadrant A | 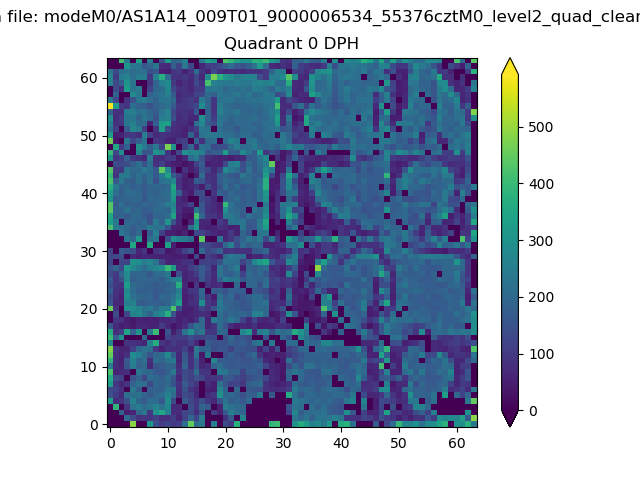 |
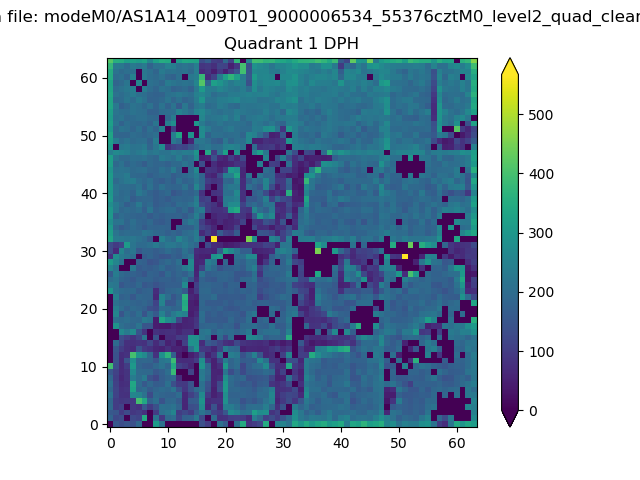 |
Quadrant B |
|---|---|---|---|
| Quadrant D | 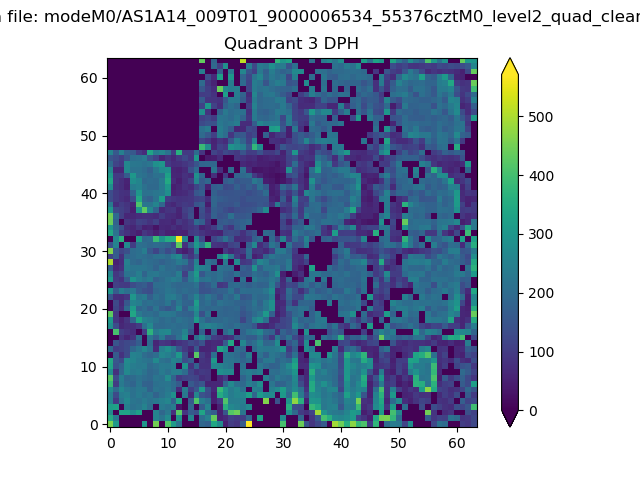 |
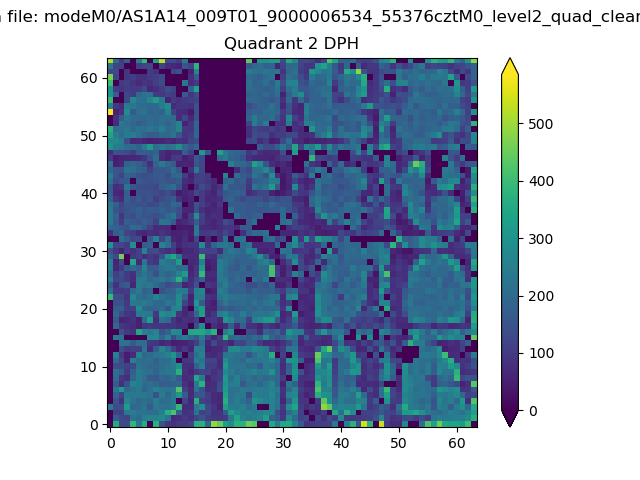 |
Quadrant C |
| Plot type | Count rate plots | Images |
|---|---|---|
| Comparison with Poisson distribution Blue bars denote a histogram of data divided into 1 sec bins. Red curve is a Poisson curve with rate = median count rate of data. |
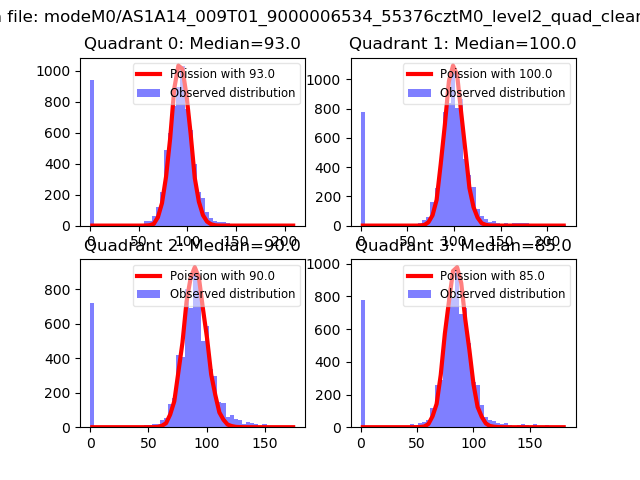 |
 |
| Quadrant-wise count rates Data is divided into 100 sec bins |
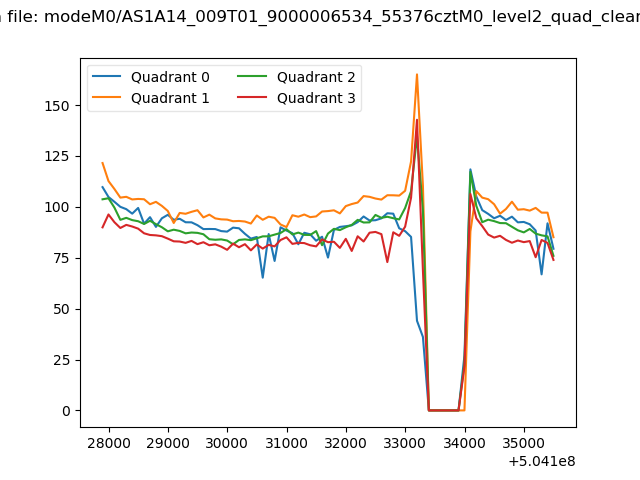 |
|
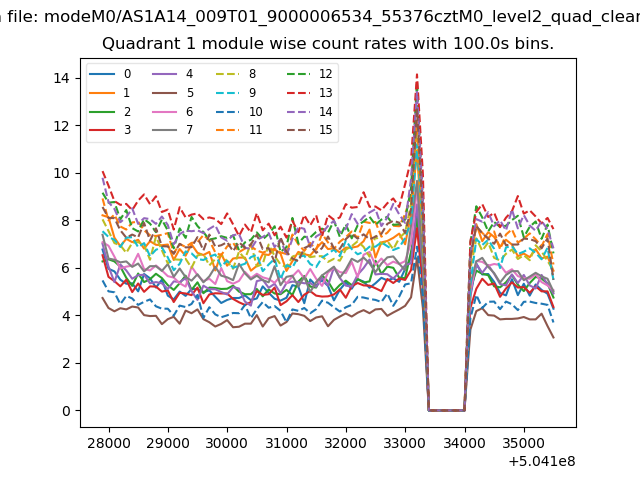
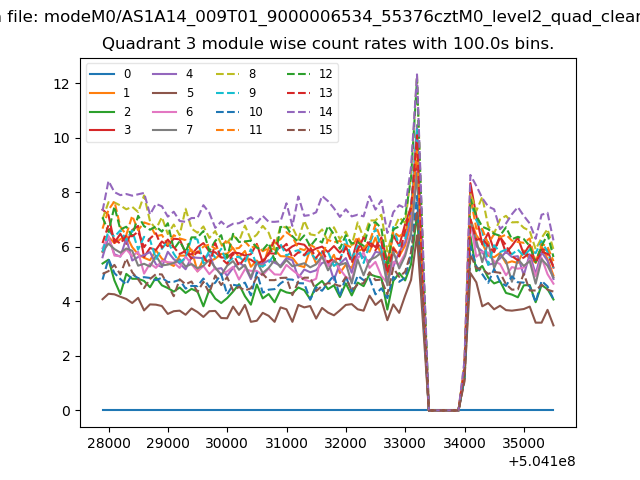
| Module-wise count rates for Quadrant A Data is divided into 100 sec bins |
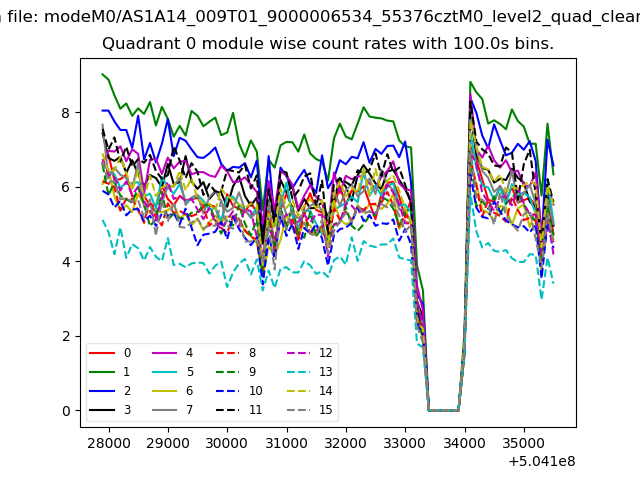 |
 |
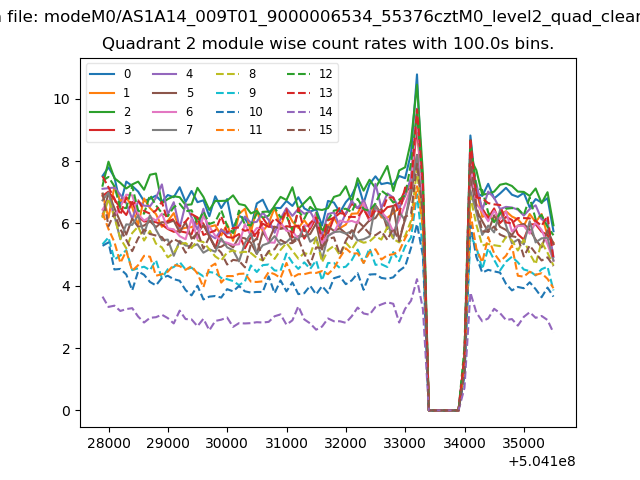
| Module-wise count rates for Quadrant B Data is divided into 100 sec bins |
 |
 |
| Module-wise count rates for Quadrant C Data is divided into 100 sec bins |
 |
 |
| Module-wise count rates for Quadrant D Data is divided into 100 sec bins |
 |
 |
| Parameter | Plot |
|---|---|
| CZT HV Monitor | 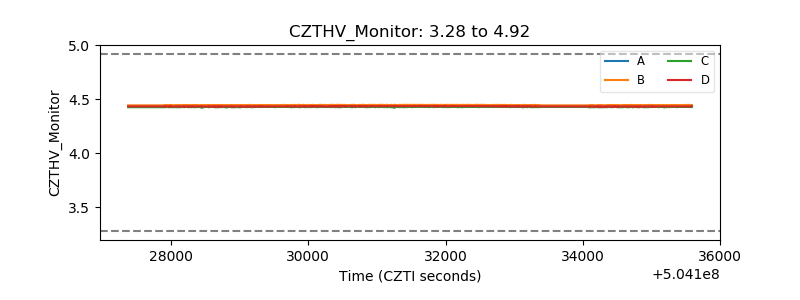 |
| D_VDD | 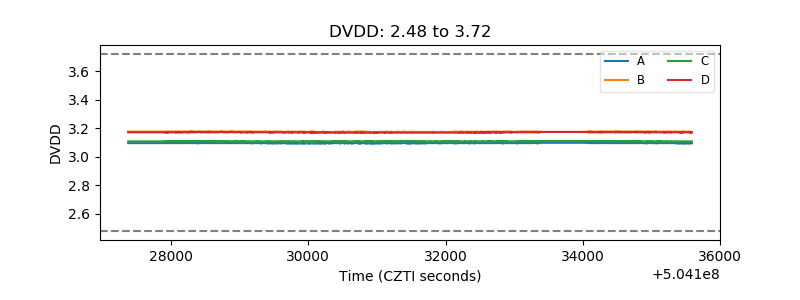 |
| Temperature 1 | 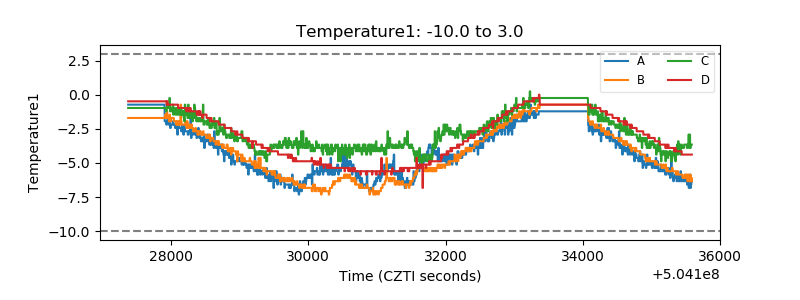 |
| Veto HV Monitor | 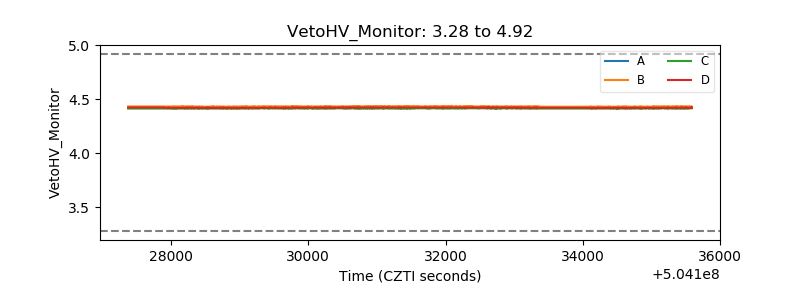 |
| Veto LLD | 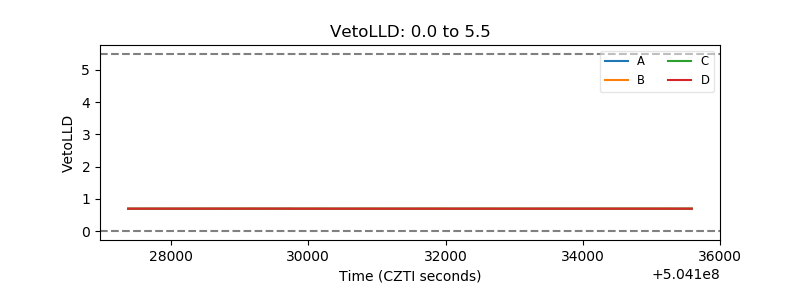 |
| Alpha Counter | 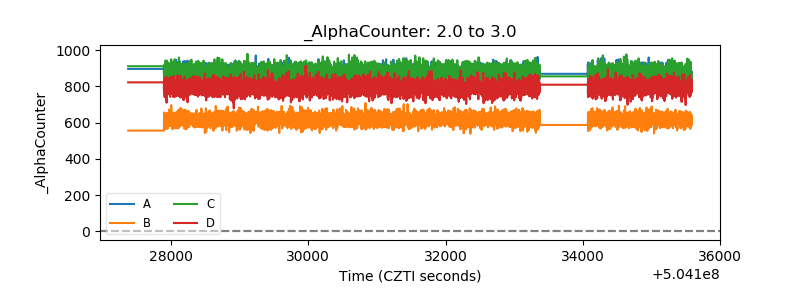 |
| _CPM_Rate | 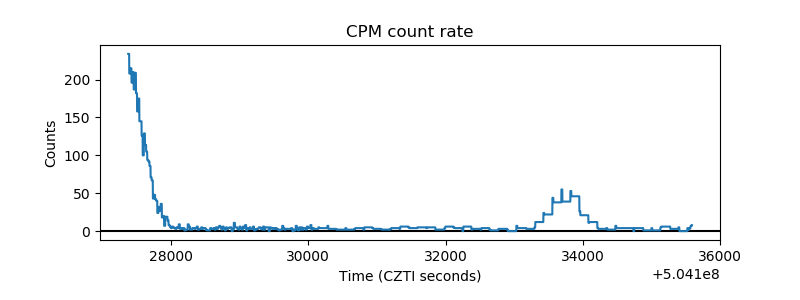 |
| CZT Counter | 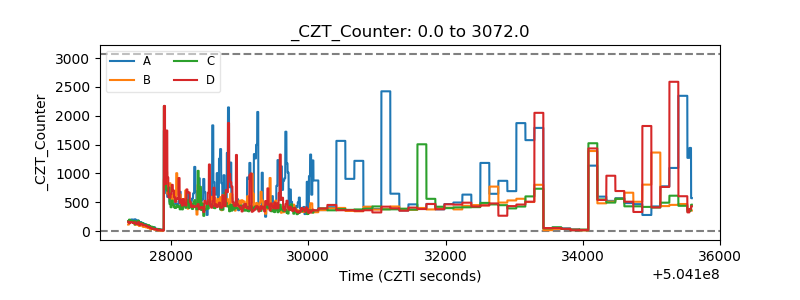 |
| +2.5 Volts monitor |  |
| +5 Volts monitor |  |
| _ROLL_ROT | 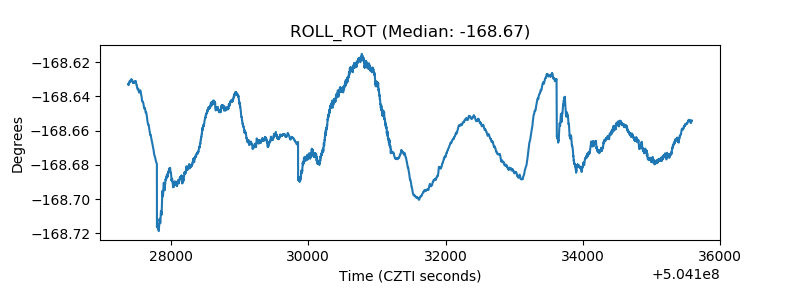 |
| _Roll_DEC | 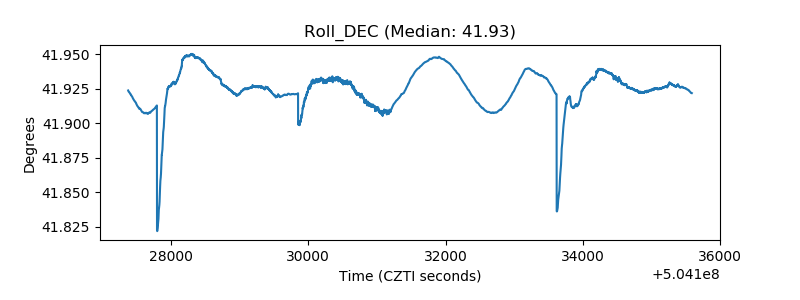 |
| _Roll_RA | 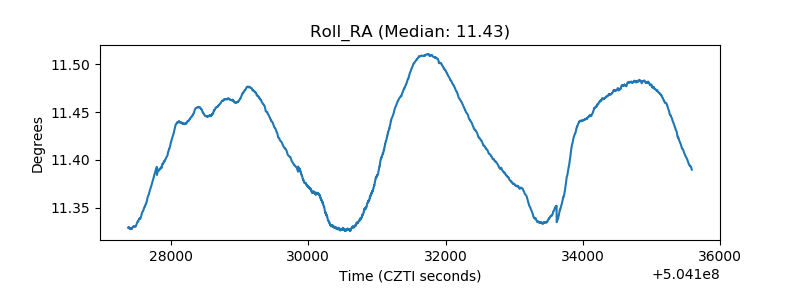 |
| Veto Counter | 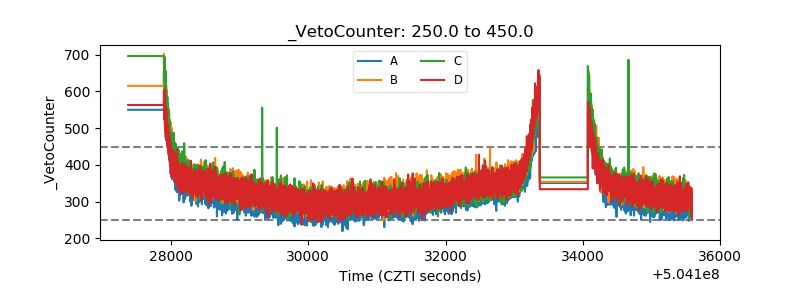 |