| Param | Original file | Final file |
|---|---|---|
| Filename | modeM0/AS1A14_009T01_9000006534_55377cztM0_level2.fits | modeM0/AS1A14_009T01_9000006534_55377cztM0_level2_quad_clean.evt |
| Size (bytes) | 509,244,480 | 109,788,480 |
| Size | 485.7 MB | 104.7 MB |
| Events in quadrant A | 5,723,076 | 697,158 |
| Events in quadrant B | 4,164,960 | 758,531 |
| Events in quadrant C | 3,595,351 | 699,844 |
| Events in quadrant D | 4,765,128 | 629,720 |
| Mode SS | |||
|---|---|---|---|
| Quadrant | BADHDUFLAG | Total packets | Discarded packets |
| A | 0 | 156 | 0 |
| B | 0 | 156 | 0 |
| C | 0 | 156 | 0 |
| D | 0 | 156 | 0 |
| Mode M0 | |||
|---|---|---|---|
| Quadrant | BADHDUFLAG | Total packets | Discarded packets |
| A | 0 | 22630 | 130 |
| B | 0 | 18254 | 43 |
| C | 0 | 16910 | 96 |
| D | 0 | 19846 | 40 |
| Mode M9 | |||
|---|---|---|---|
| Quadrant | BADHDUFLAG | Total packets | Discarded packets |
| A | 0 | 2 | 0 |
| B | 0 | 3 | 0 |
| C | 0 | 3 | 0 |
| D | 0 | 3 | 0 |
| Quadrant | Total seconds | Saturated seconds | Saturation percentage |
|---|---|---|---|
| A | 7740 | 447 | 5.775194% |
| B | 7748 | 303 | 3.910687% |
| C | 7747 | 81 | 1.045566% |
| D | 7751 | 447 | 5.766998% |
Noise dominated data is calculated using 1-second bins in cleaned event files. If a bin has >2000 counts, and if more than 50% of those come from <1% of pixels, then it is considered to be noise-dominated and hence unusable.
| Quadrant | # 1 sec bins | Bins with >0 counts | Bins with >2000 counts | High rate bins dominated by noise | Noise dominated (total time) | Noise dominated (detector-on time) | Marked lightcurve |
|---|---|---|---|---|---|---|---|
| A | 7803 | 7746 | 256 | 256 | 3.28% | 3.30% | 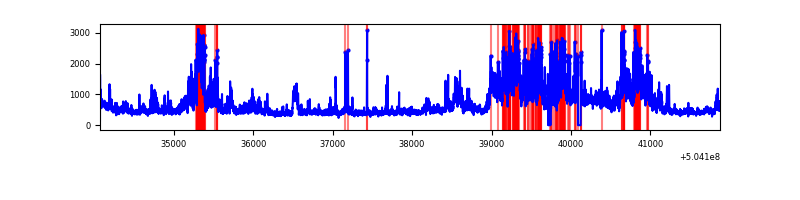 |
| B | 7803 | 7754 | 150 | 150 | 1.92% | 1.93% | 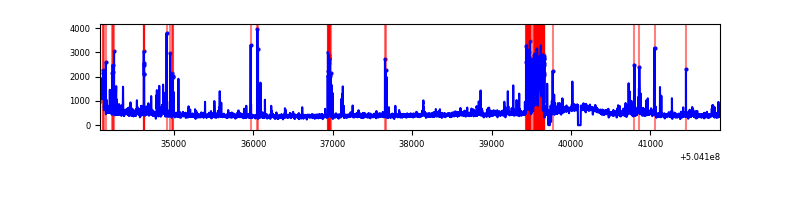 |
| C | 7803 | 7754 | 32 | 32 | 0.41% | 0.41% | 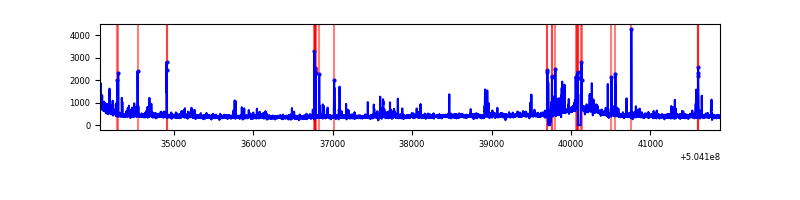 |
| D | 7803 | 7756 | 297 | 297 | 3.81% | 3.83% | 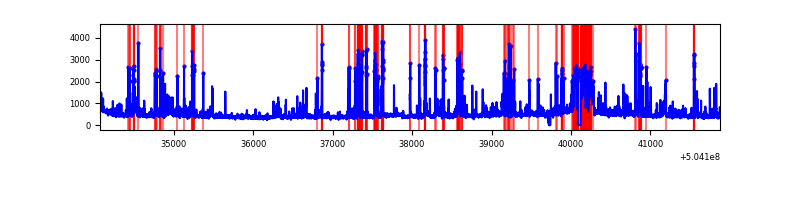 |
Top three noisy pixels from each quadrant. If the there are fewer than three noisy pixels in the level2.evt file, extra rows are filled as -1
| Pixel properties | Quadrant properties | ||||||
|---|---|---|---|---|---|---|---|
| Quadrant | DetID | PixID | Counts | Sigma | Mean | Median | Sigma |
| A | 4 | 159 | 1739646 | 8539.22 | 820 | 800 | 203.6 |
| A | 12 | 115 | 431620 | 2115.69 | 820 | 800 | 203.6 |
| A | 11 | 31 | 157730 | 770.66 | 820 | 800 | 203.6 |
| B | 5 | 185 | 439987 | 2515.91 | 814 | 785 | 174.6 |
| B | 0 | 199 | 195434 | 1115.02 | 814 | 785 | 174.6 |
| B | 2 | 249 | 75316 | 426.94 | 814 | 785 | 174.6 |
| C | 12 | 249 | 138056 | 613.34 | 814 | 807 | 223.8 |
| C | 13 | 3 | 81502 | 360.61 | 814 | 807 | 223.8 |
| C | 12 | 250 | 63766 | 281.35 | 814 | 807 | 223.8 |
| D | 11 | 129 | 530301 | 2430.85 | 769 | 735 | 217.9 |
| D | 15 | 107 | 436311 | 1999.41 | 769 | 735 | 217.9 |
| D | 2 | 249 | 168315 | 769.24 | 769 | 735 | 217.9 |
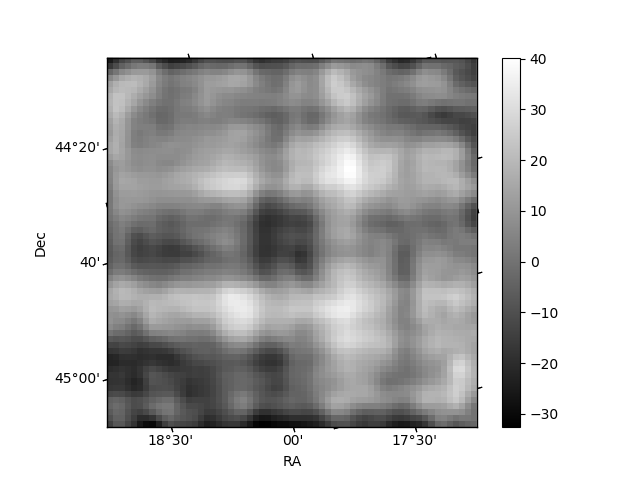
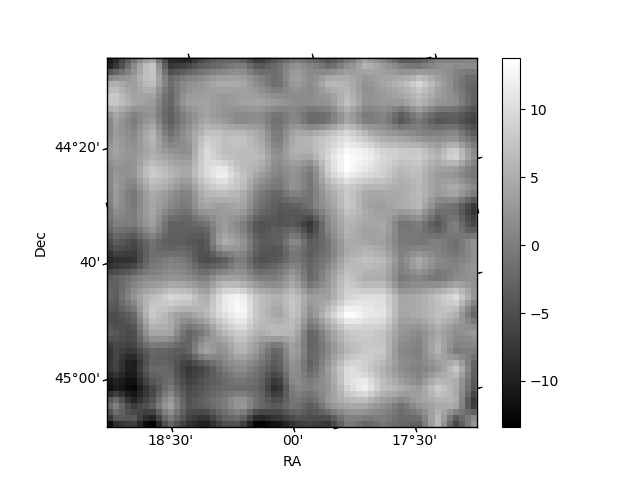
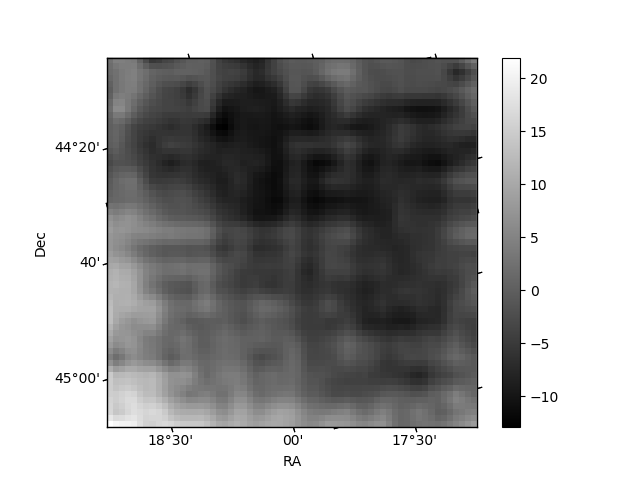
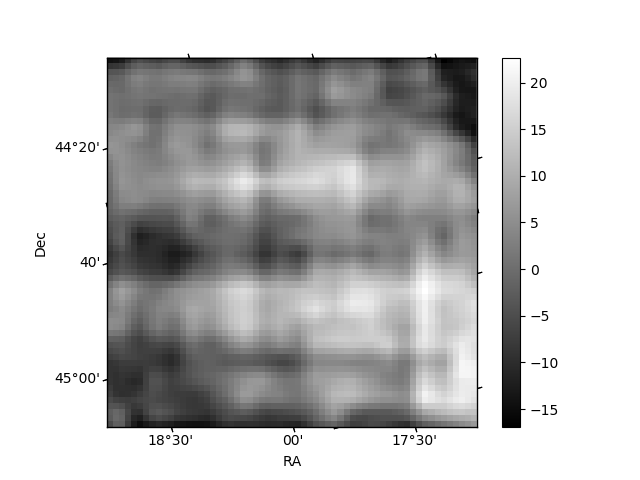
Histogram calculated using DETX and DETY for each event in the final _common_clean file
| Quadrant A | 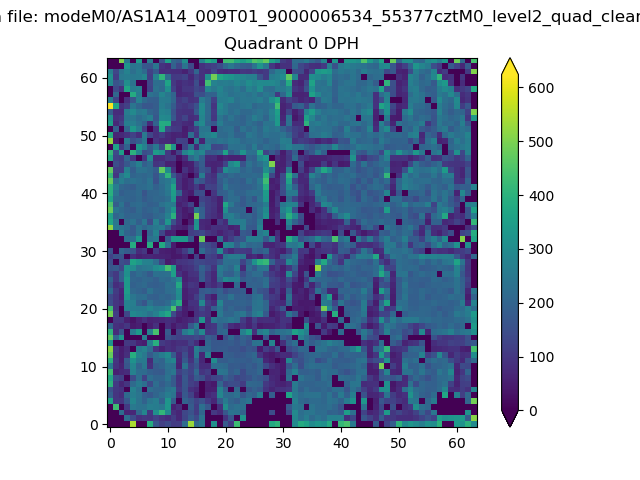 |
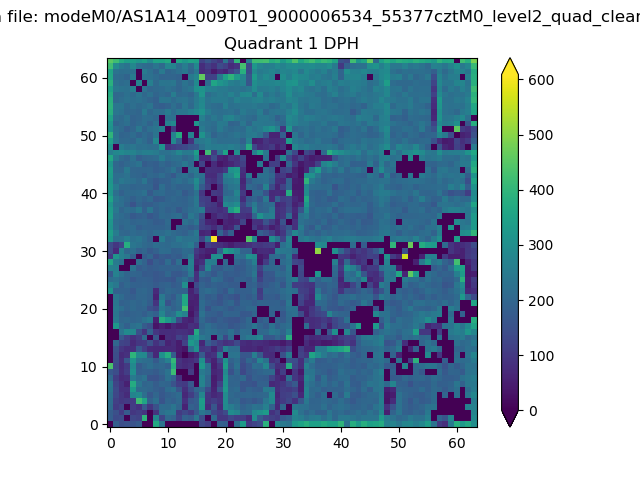 |
Quadrant B |
|---|---|---|---|
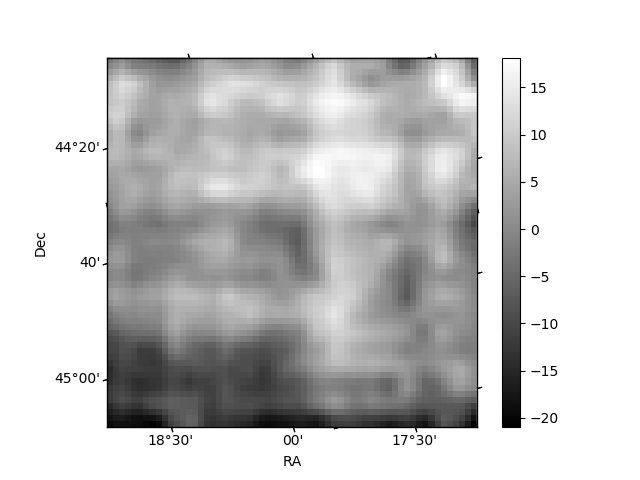
| Quadrant D | 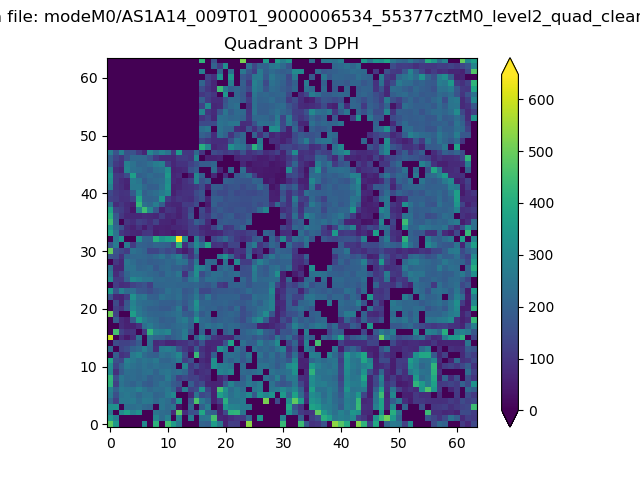 |
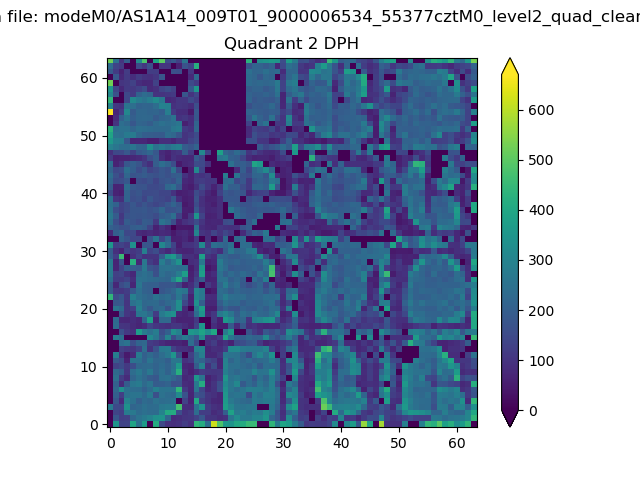 |
Quadrant C |
| Plot type | Count rate plots | Images |
|---|---|---|
| Comparison with Poisson distribution Blue bars denote a histogram of data divided into 1 sec bins. Red curve is a Poisson curve with rate = median count rate of data. |
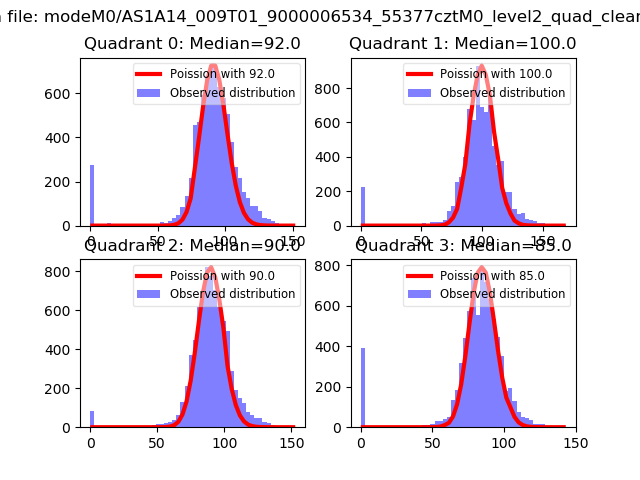 |
 |
| Quadrant-wise count rates Data is divided into 100 sec bins |
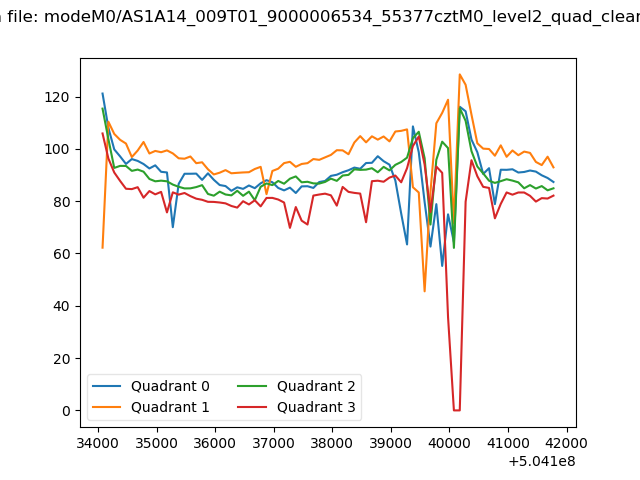 |
|
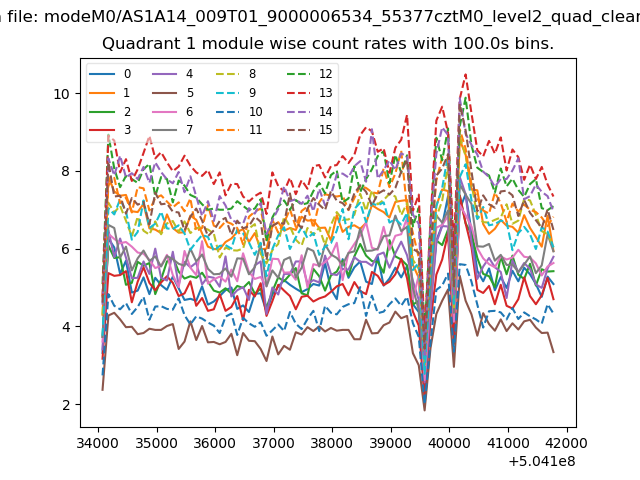
| Module-wise count rates for Quadrant A Data is divided into 100 sec bins |
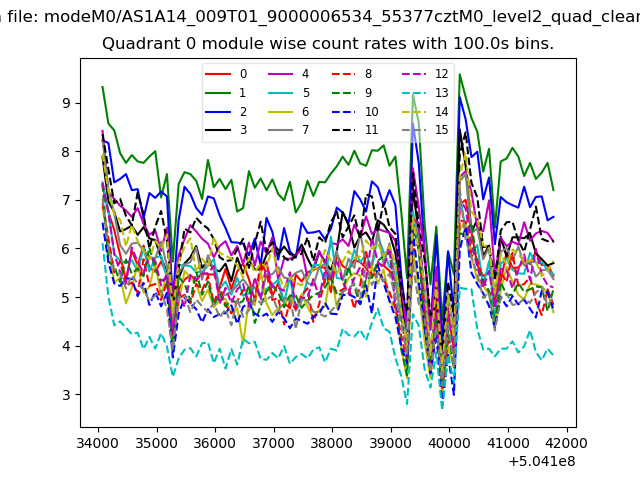 |
 |
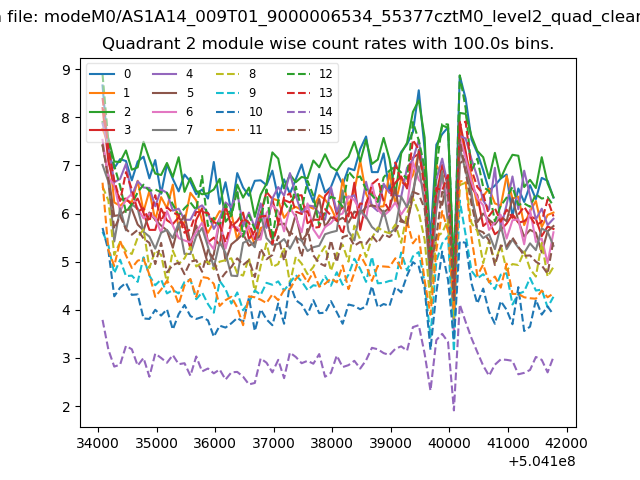
| Module-wise count rates for Quadrant B Data is divided into 100 sec bins |
 |
 |
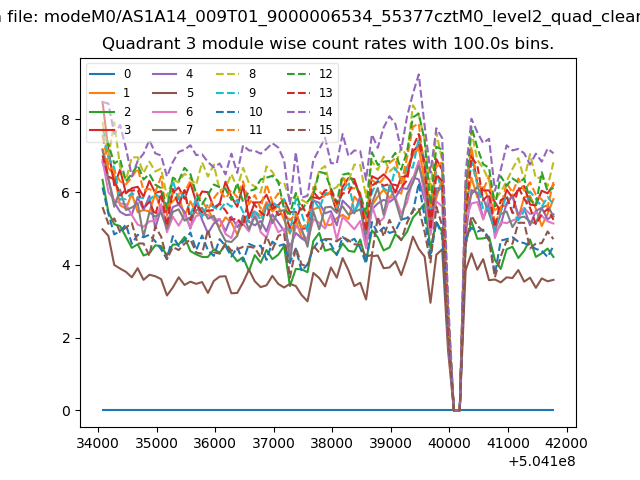
| Module-wise count rates for Quadrant C Data is divided into 100 sec bins |
 |
 |
| Module-wise count rates for Quadrant D Data is divided into 100 sec bins |
 |
 |
| Parameter | Plot |
|---|---|
| CZT HV Monitor | 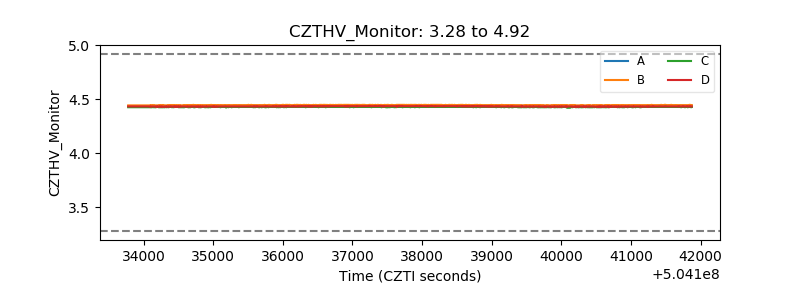 |
| D_VDD | 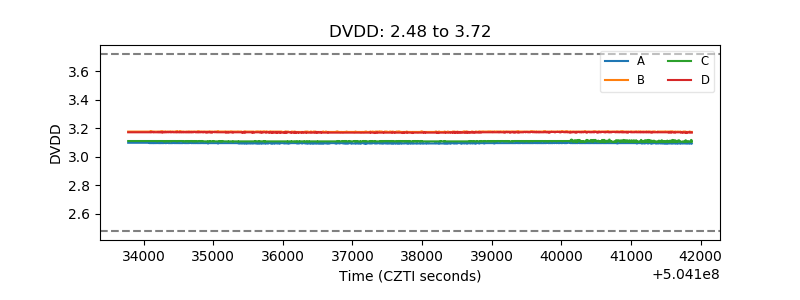 |
| Temperature 1 | 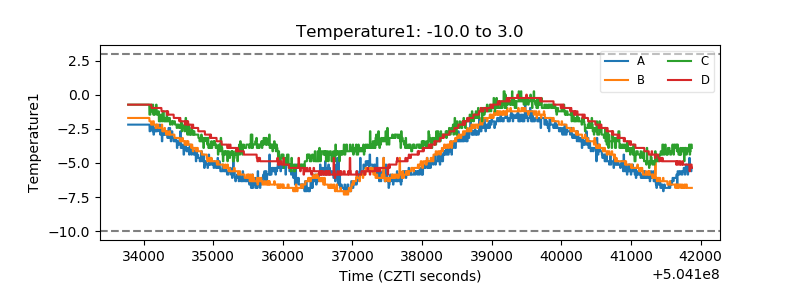 |
| Veto HV Monitor | 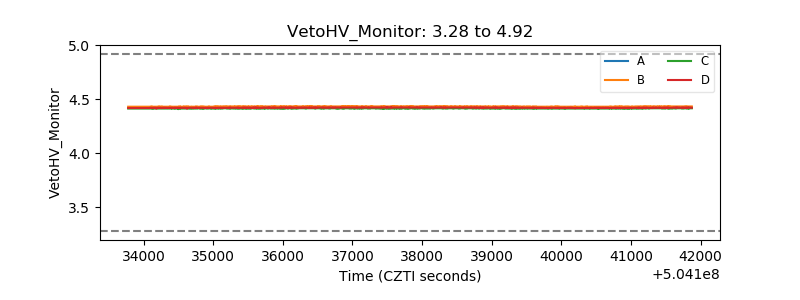 |
| Veto LLD | 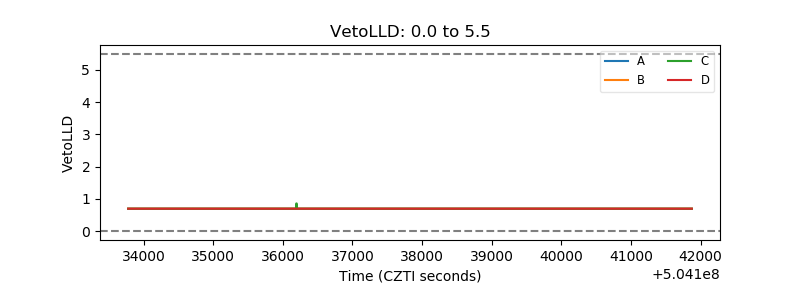 |
| Alpha Counter | 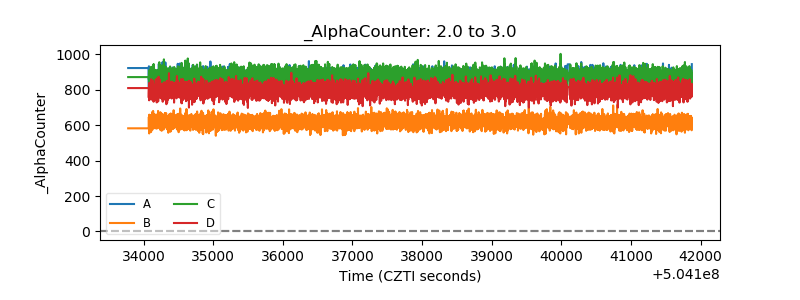 |
| _CPM_Rate | 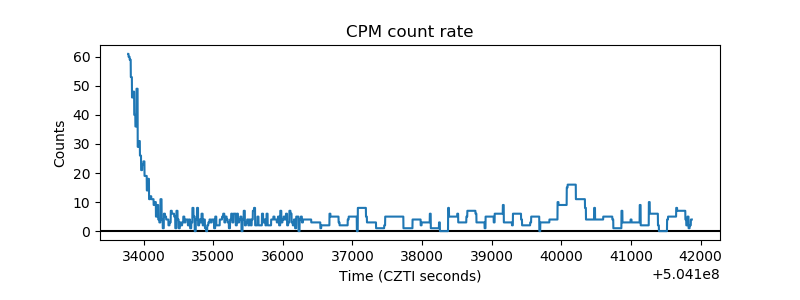 |
| CZT Counter | 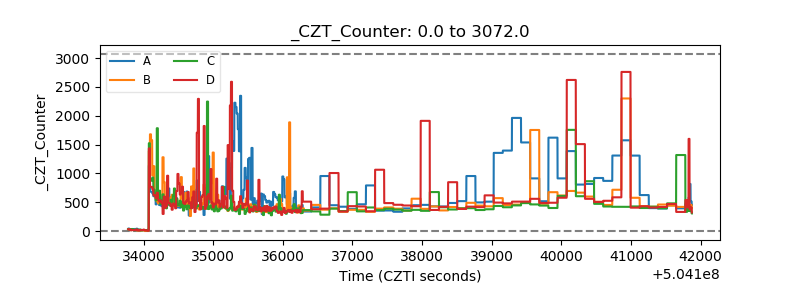 |
| +2.5 Volts monitor | 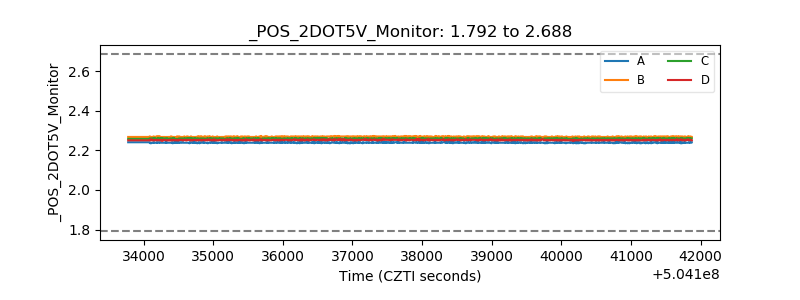 |
| +5 Volts monitor | 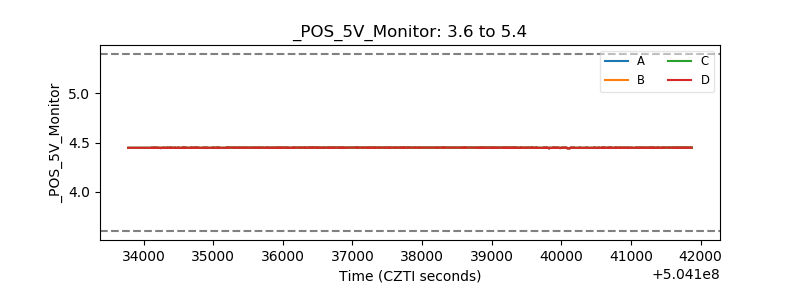 |
| _ROLL_ROT | 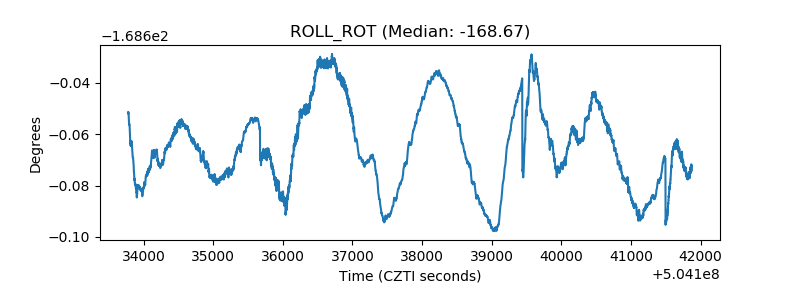 |
| _Roll_DEC | 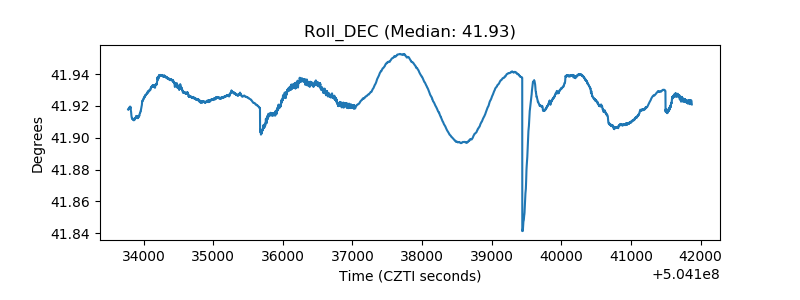 |
| _Roll_RA | 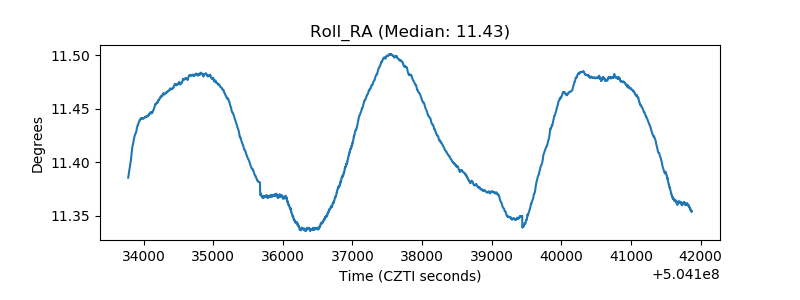 |
| Veto Counter | 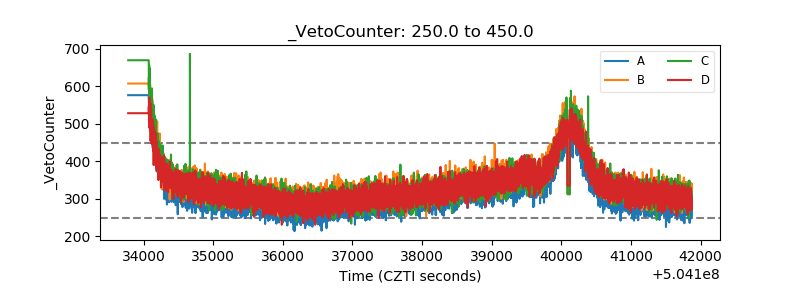 |