| Param | Original file | Final file |
|---|---|---|
| Filename | modeM0/AS1A14_009T01_9000006534_55378cztM0_level2.fits | modeM0/AS1A14_009T01_9000006534_55378cztM0_level2_quad_clean.evt |
| Size (bytes) | 684,483,840 | 122,820,480 |
| Size | 652.8 MB | 117.1 MB |
| Events in quadrant A | 9,231,744 | 721,457 |
| Events in quadrant B | 4,588,226 | 882,885 |
| Events in quadrant C | 4,620,225 | 792,231 |
| Events in quadrant D | 6,209,334 | 706,522 |
| Mode SS | |||
|---|---|---|---|
| Quadrant | BADHDUFLAG | Total packets | Discarded packets |
| A | 0 | 178 | 0 |
| B | 0 | 178 | 0 |
| C | 0 | 178 | 0 |
| D | 0 | 178 | 0 |
| Mode M0 | |||
|---|---|---|---|
| Quadrant | BADHDUFLAG | Total packets | Discarded packets |
| A | 0 | 33683 | 1 |
| B | 0 | 20206 | 1 |
| C | 0 | 20569 | 1 |
| D | 0 | 24727 | 1 |
| Quadrant | Total seconds | Saturated seconds | Saturation percentage |
|---|---|---|---|
| A | 8868 | 1418 | 15.990077% |
| B | 8868 | 214 | 2.413171% |
| C | 8869 | 231 | 2.604578% |
| D | 8869 | 725 | 8.174541% |
Noise dominated data is calculated using 1-second bins in cleaned event files. If a bin has >2000 counts, and if more than 50% of those come from <1% of pixels, then it is considered to be noise-dominated and hence unusable.
| Quadrant | # 1 sec bins | Bins with >0 counts | Bins with >2000 counts | High rate bins dominated by noise | Noise dominated (total time) | Noise dominated (detector-on time) | Marked lightcurve |
|---|---|---|---|---|---|---|---|
| A | 8903 | 8868 | 1048 | 1048 | 11.77% | 11.82% | 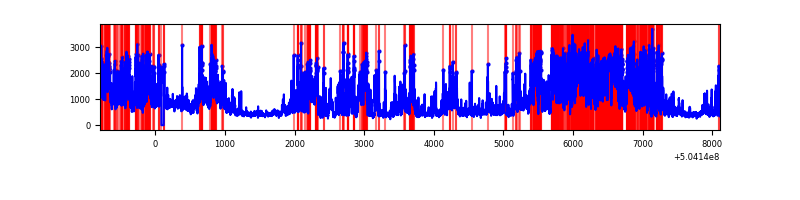 |
| B | 8903 | 8869 | 121 | 121 | 1.36% | 1.36% | 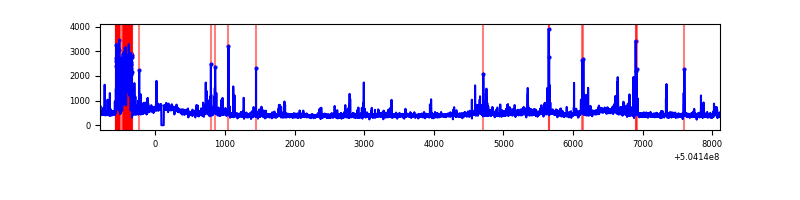 |
| C | 8904 | 8870 | 175 | 175 | 1.97% | 1.97% | 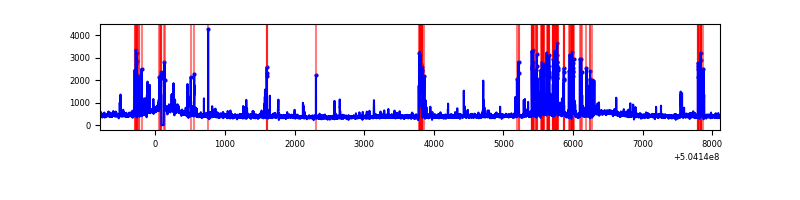 |
| D | 8904 | 8869 | 556 | 556 | 6.24% | 6.27% | 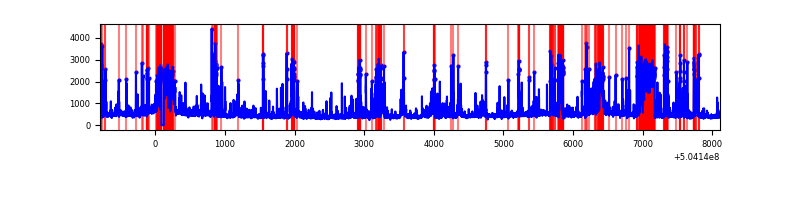 |
Top three noisy pixels from each quadrant. If the there are fewer than three noisy pixels in the level2.evt file, extra rows are filled as -1
| Pixel properties | Quadrant properties | ||||||
|---|---|---|---|---|---|---|---|
| Quadrant | DetID | PixID | Counts | Sigma | Mean | Median | Sigma |
| A | 4 | 159 | 5383917 | 23964.56 | 908 | 887 | 224.6 |
| A | 11 | 31 | 164930 | 730.3 | 908 | 887 | 224.6 |
| A | 3 | 78 | 59073 | 259.03 | 908 | 887 | 224.6 |
| B | 5 | 185 | 391423 | 1910.43 | 947 | 910 | 204.4 |
| B | 0 | 199 | 224045 | 1091.6 | 947 | 910 | 204.4 |
| B | 5 | 248 | 76687 | 370.71 | 947 | 910 | 204.4 |
| C | 13 | 3 | 639911 | 2490.48 | 936 | 925 | 256.6 |
| C | 12 | 249 | 84194 | 324.54 | 936 | 925 | 256.6 |
| C | 12 | 250 | 65172 | 250.41 | 936 | 925 | 256.6 |
| D | 11 | 129 | 556157 | 2223.03 | 886 | 848 | 249.8 |
| D | 2 | 249 | 489430 | 1955.91 | 886 | 848 | 249.8 |
| D | 15 | 107 | 463812 | 1853.35 | 886 | 848 | 249.8 |
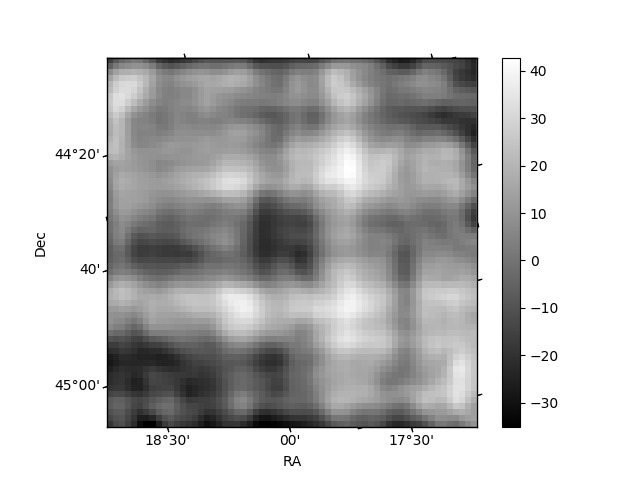
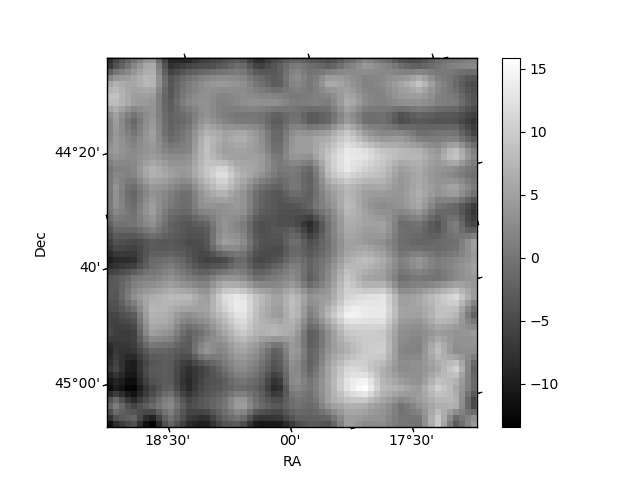
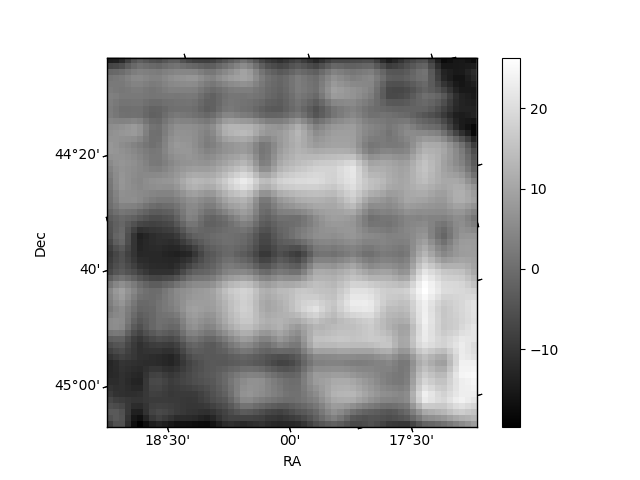
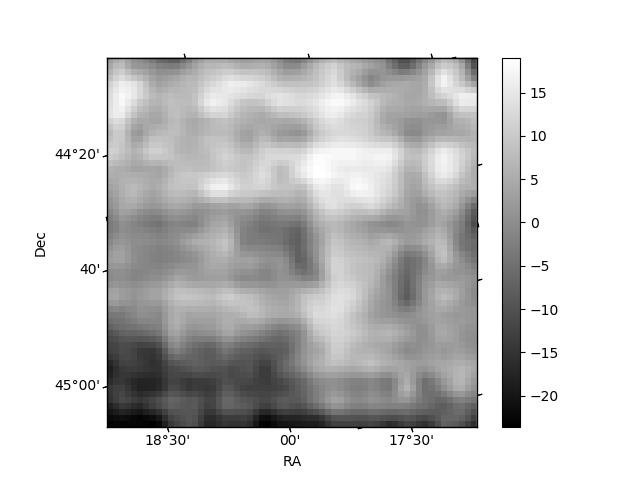
Histogram calculated using DETX and DETY for each event in the final _common_clean file
| Quadrant A | 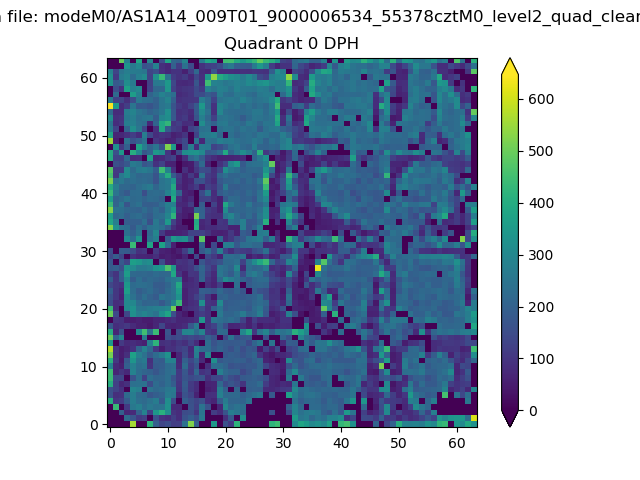 |
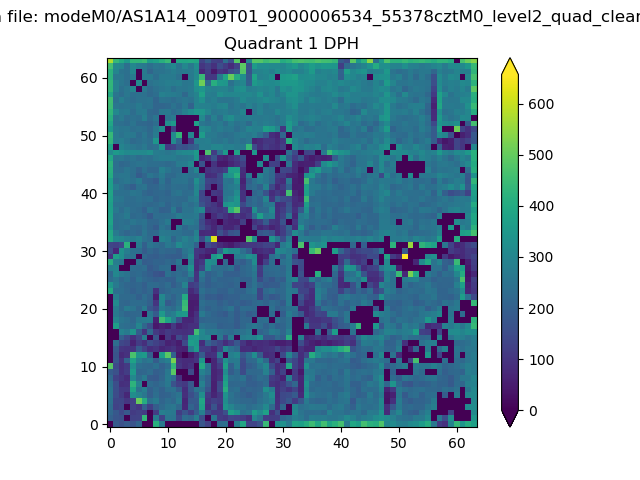 |
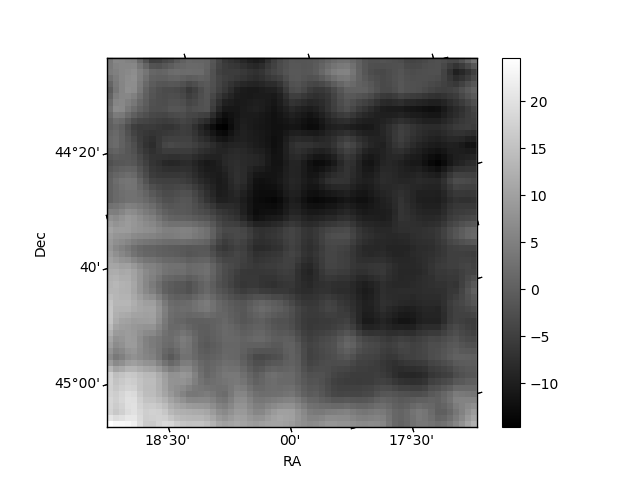
Quadrant B |
|---|---|---|---|
| Quadrant D | 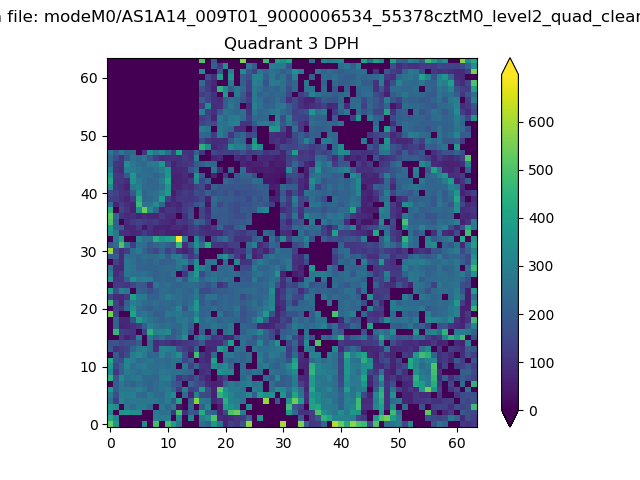 |
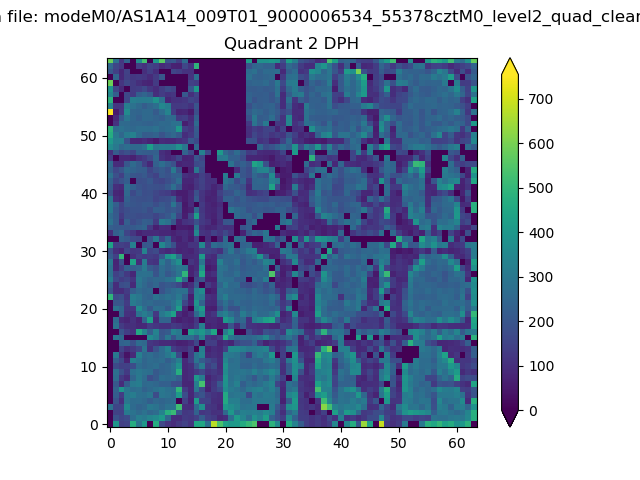 |
Quadrant C |
| Plot type | Count rate plots | Images |
|---|---|---|
| Comparison with Poisson distribution Blue bars denote a histogram of data divided into 1 sec bins. Red curve is a Poisson curve with rate = median count rate of data. |
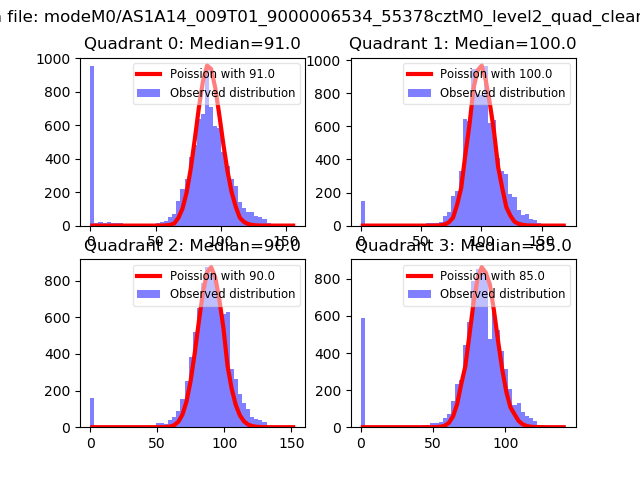 |
 |
| Quadrant-wise count rates Data is divided into 100 sec bins |
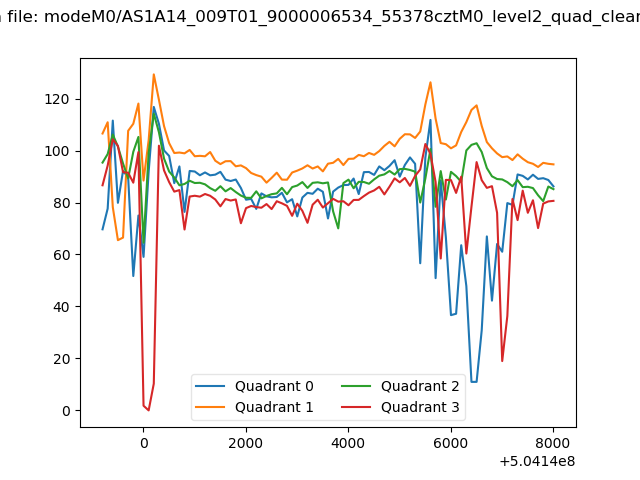 |
|
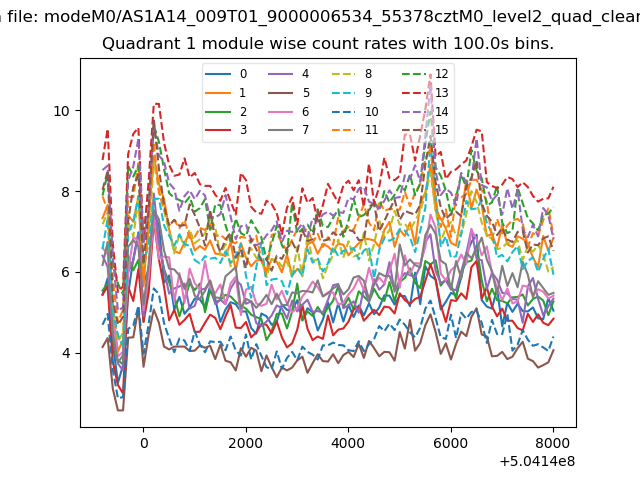
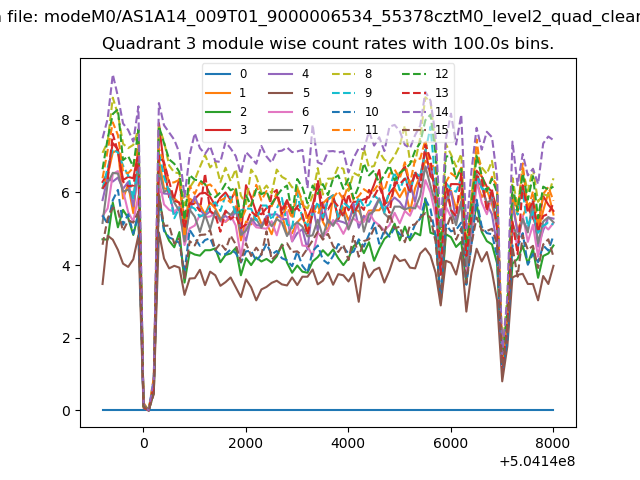
| Module-wise count rates for Quadrant A Data is divided into 100 sec bins |
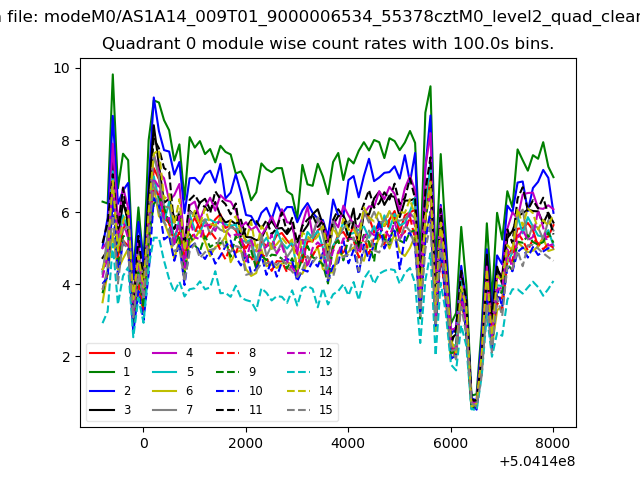 |
 |
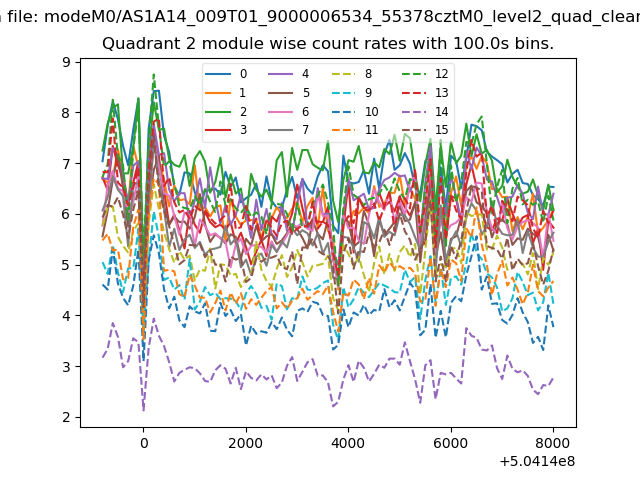
| Module-wise count rates for Quadrant B Data is divided into 100 sec bins |
 |
 |
| Module-wise count rates for Quadrant C Data is divided into 100 sec bins |
 |
 |
| Module-wise count rates for Quadrant D Data is divided into 100 sec bins |
 |
 |
| Parameter | Plot |
|---|---|
| CZT HV Monitor | 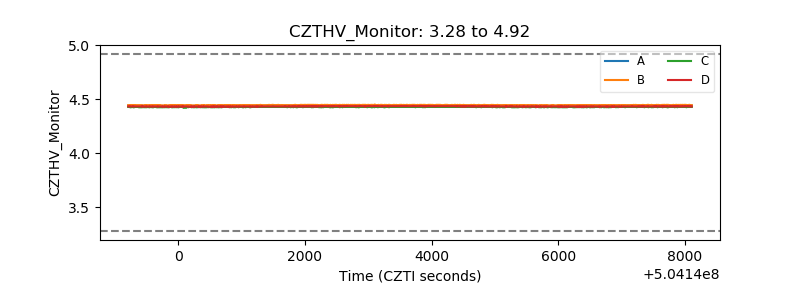 |
| D_VDD | 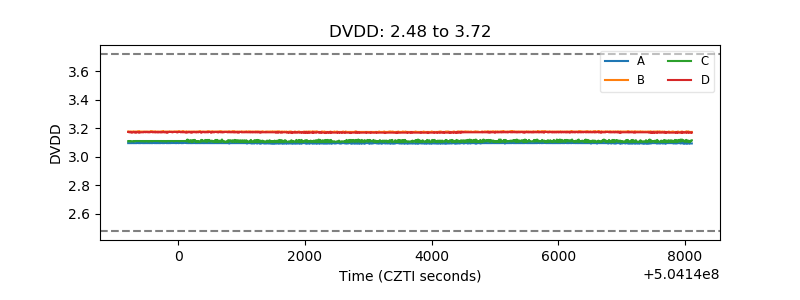 |
| Temperature 1 | 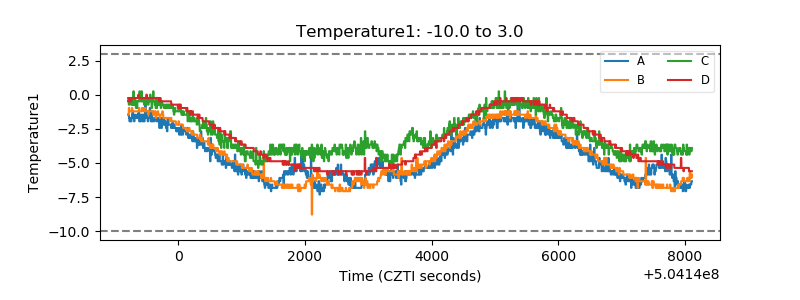 |
| Veto HV Monitor | 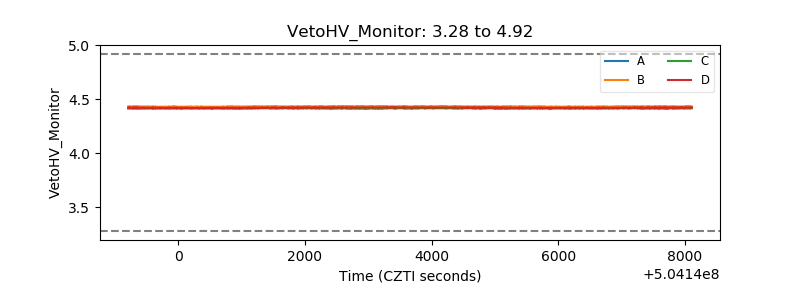 |
| Veto LLD | 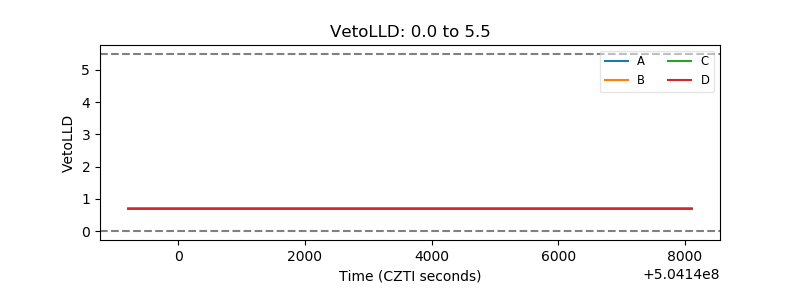 |
| Alpha Counter | 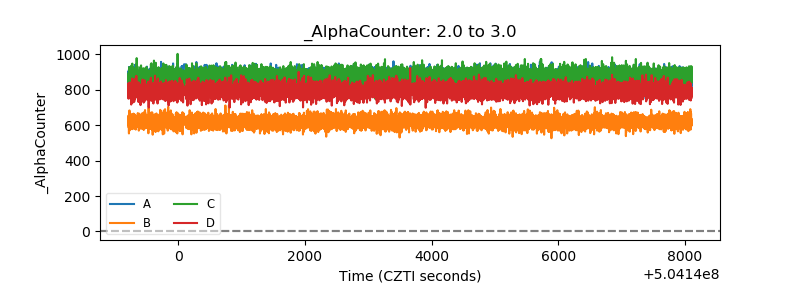 |
| _CPM_Rate | 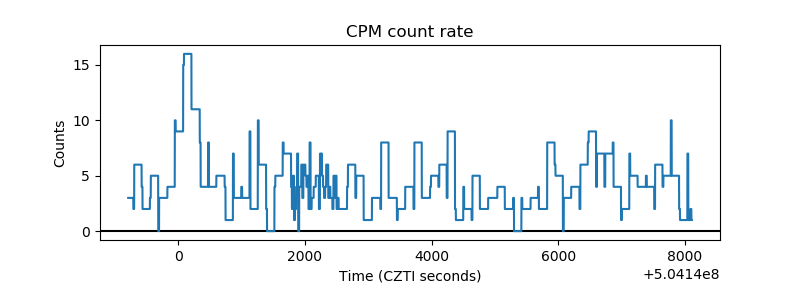 |
| CZT Counter | 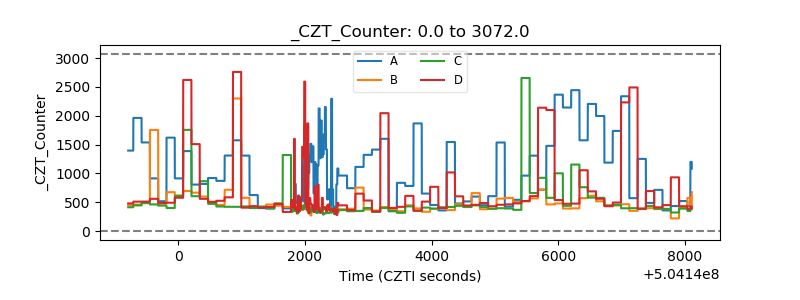 |
| +2.5 Volts monitor |  |
| +5 Volts monitor |  |
| _ROLL_ROT | 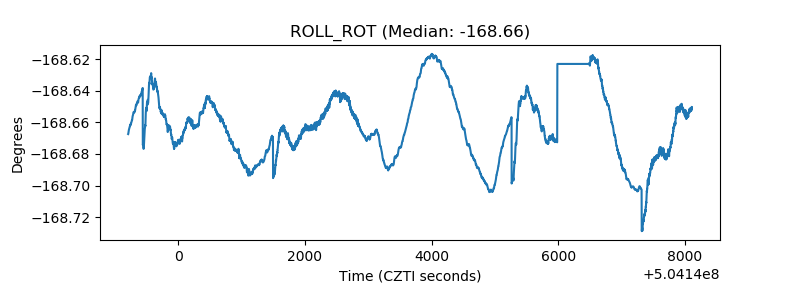 |
| _Roll_DEC | 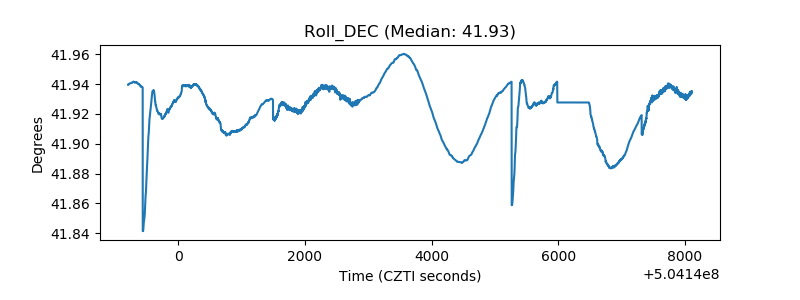 |
| _Roll_RA | 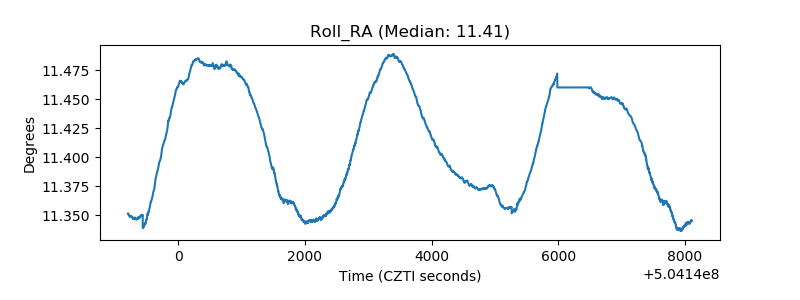 |
| Veto Counter | 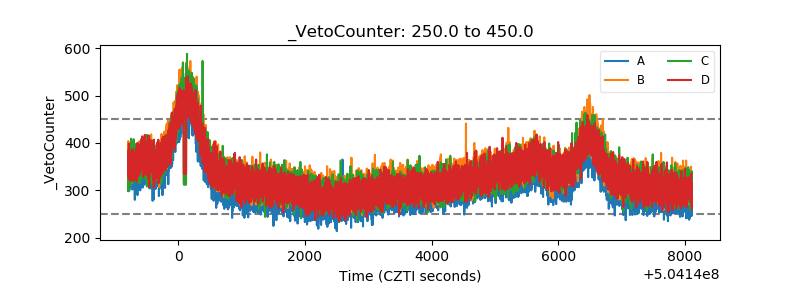 |