| Param | Original file | Final file |
|---|---|---|
| Filename | modeM0/AS1A14_009T01_9000006534_55379cztM0_level2.fits | modeM0/AS1A14_009T01_9000006534_55379cztM0_level2_quad_clean.evt |
| Size (bytes) | 1,471,219,200 | 276,557,760 |
| Size | 1.4 GB | 263.7 MB |
| Events in quadrant A | 19,582,881 | 1,576,656 |
| Events in quadrant B | 10,139,700 | 1,968,800 |
| Events in quadrant C | 9,775,238 | 1,804,742 |
| Events in quadrant D | 13,384,925 | 1,618,787 |
| Mode SS | |||
|---|---|---|---|
| Quadrant | BADHDUFLAG | Total packets | Discarded packets |
| A | 0 | 410 | 0 |
| B | 0 | 410 | 0 |
| C | 0 | 410 | 0 |
| D | 0 | 410 | 0 |
| Mode M0 | |||
|---|---|---|---|
| Quadrant | BADHDUFLAG | Total packets | Discarded packets |
| A | 0 | 72636 | 2 |
| B | 0 | 45536 | 2 |
| C | 0 | 44915 | 2 |
| D | 0 | 54547 | 2 |
| Mode M9 | |||
|---|---|---|---|
| Quadrant | BADHDUFLAG | Total packets | Discarded packets |
| A | 0 | 2 | 0 |
| B | 0 | 3 | 0 |
| C | 0 | 3 | 0 |
| D | 0 | 3 | 0 |
| Quadrant | Total seconds | Saturated seconds | Saturation percentage |
|---|---|---|---|
| A | 20382 | 2904 | 14.247866% |
| B | 20382 | 446 | 2.188205% |
| C | 20381 | 272 | 1.334576% |
| D | 20381 | 1194 | 5.858398% |
Noise dominated data is calculated using 1-second bins in cleaned event files. If a bin has >2000 counts, and if more than 50% of those come from <1% of pixels, then it is considered to be noise-dominated and hence unusable.
| Quadrant | # 1 sec bins | Bins with >0 counts | Bins with >2000 counts | High rate bins dominated by noise | Noise dominated (total time) | Noise dominated (detector-on time) | Marked lightcurve |
|---|---|---|---|---|---|---|---|
| A | 20417 | 20382 | 2285 | 2285 | 11.19% | 11.21% | 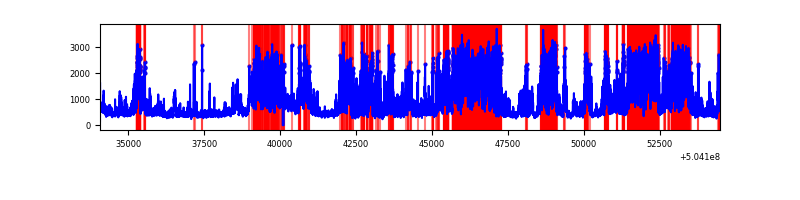 |
| B | 20417 | 20383 | 252 | 252 | 1.23% | 1.24% | 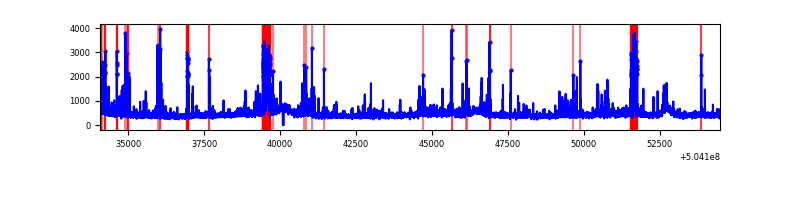 |
| C | 20416 | 20382 | 206 | 206 | 1.01% | 1.01% | 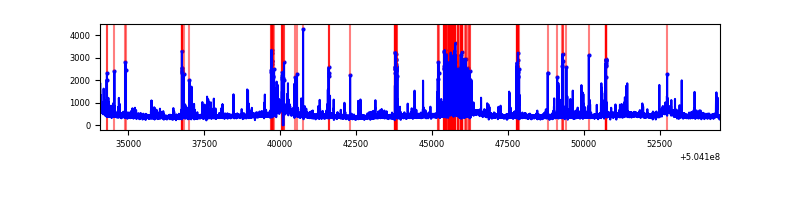 |
| D | 20416 | 20381 | 1003 | 1003 | 4.91% | 4.92% | 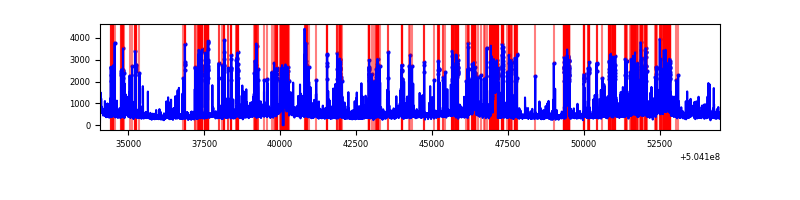 |
Top three noisy pixels from each quadrant. If the there are fewer than three noisy pixels in the level2.evt file, extra rows are filled as -1
| Pixel properties | Quadrant properties | ||||||
|---|---|---|---|---|---|---|---|
| Quadrant | DetID | PixID | Counts | Sigma | Mean | Median | Sigma |
| A | 4 | 159 | 10466618 | 20905.09 | 2048 | 2000 | 500.6 |
| A | 12 | 115 | 438010 | 871.01 | 2048 | 2000 | 500.6 |
| A | 3 | 78 | 273003 | 541.38 | 2048 | 2000 | 500.6 |
| B | 5 | 185 | 745421 | 1631.08 | 2127 | 2040 | 455.8 |
| B | 0 | 199 | 462900 | 1011.19 | 2127 | 2040 | 455.8 |
| B | 10 | 247 | 159920 | 346.41 | 2127 | 2040 | 455.8 |
| C | 13 | 3 | 800058 | 1387.43 | 2105 | 2084 | 575.1 |
| C | 9 | 38 | 181094 | 311.24 | 2105 | 2084 | 575.1 |
| C | 12 | 249 | 170800 | 293.34 | 2105 | 2084 | 575.1 |
| D | 15 | 107 | 1325995 | 2303.81 | 2033 | 1945 | 574.7 |
| D | 11 | 129 | 919303 | 1596.17 | 2033 | 1945 | 574.7 |
| D | 11 | 176 | 901469 | 1565.14 | 2033 | 1945 | 574.7 |
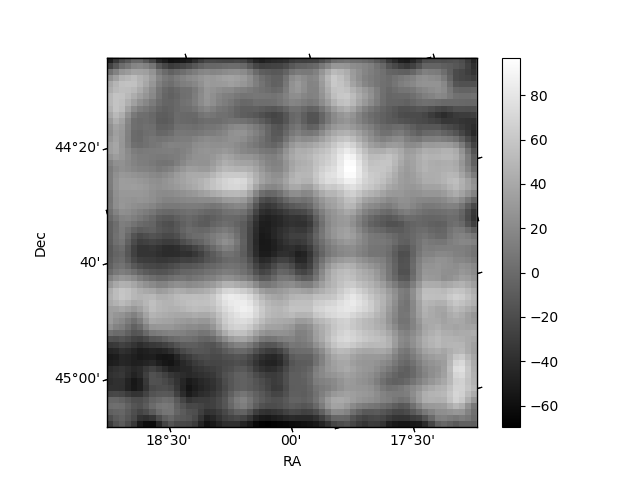
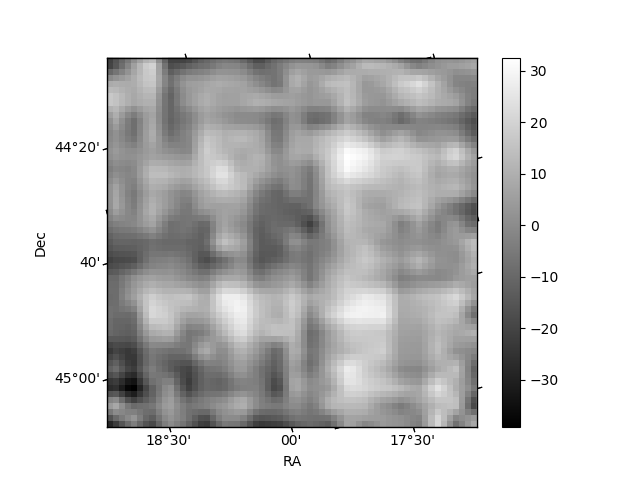
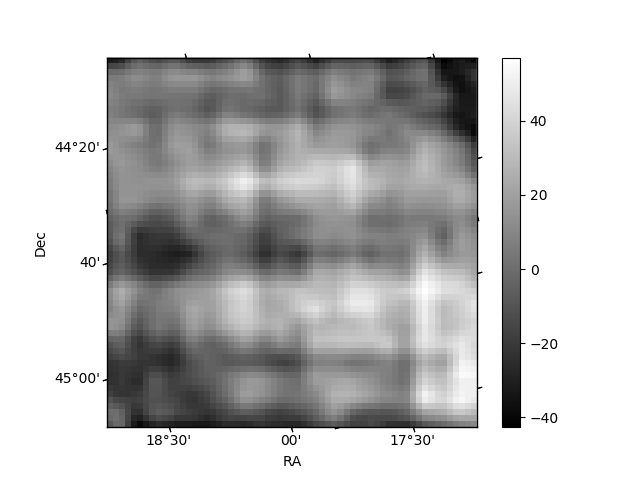
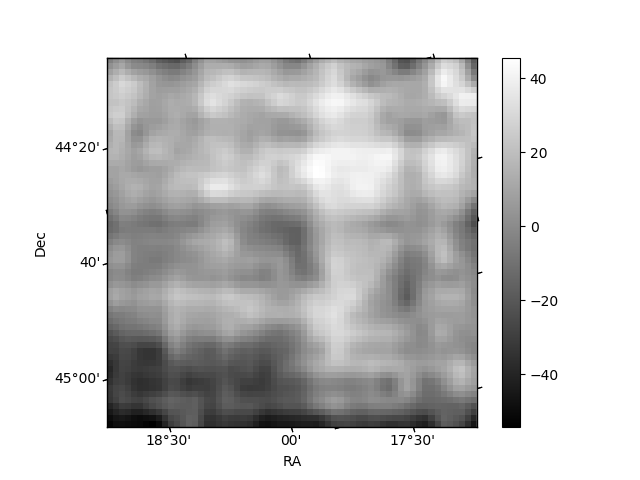
Histogram calculated using DETX and DETY for each event in the final _common_clean file
| Quadrant A | 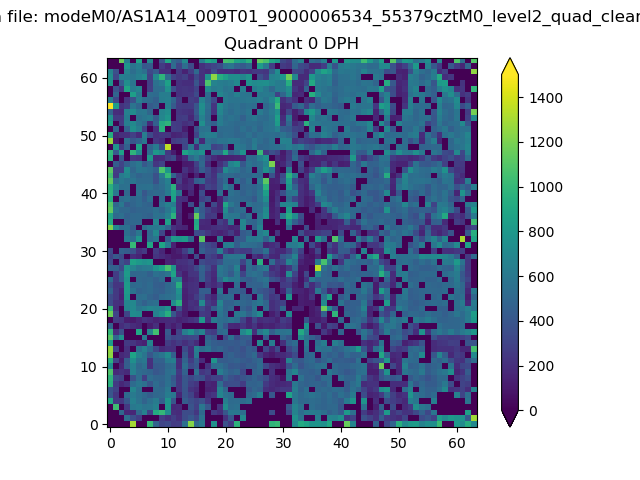 |
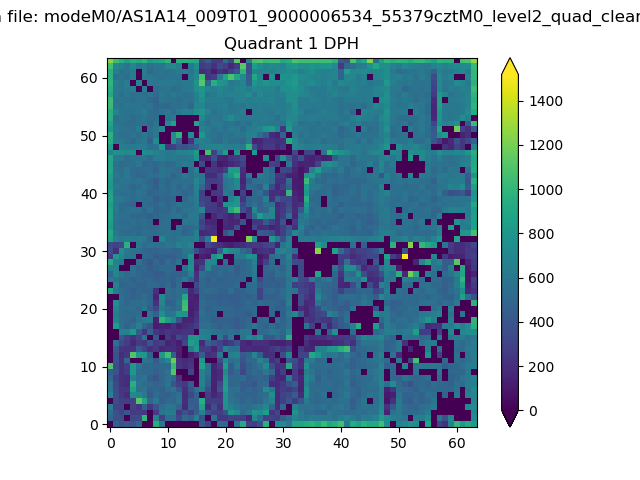 |
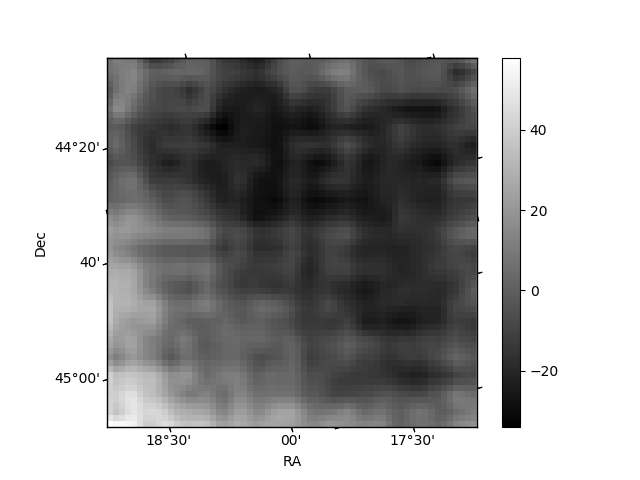
Quadrant B |
|---|---|---|---|
| Quadrant D | 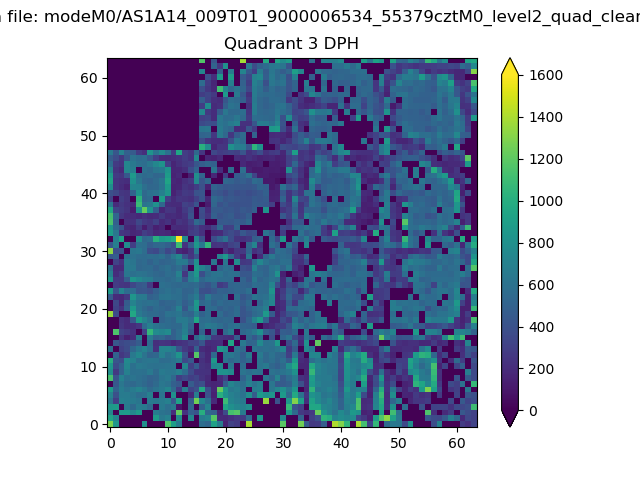 |
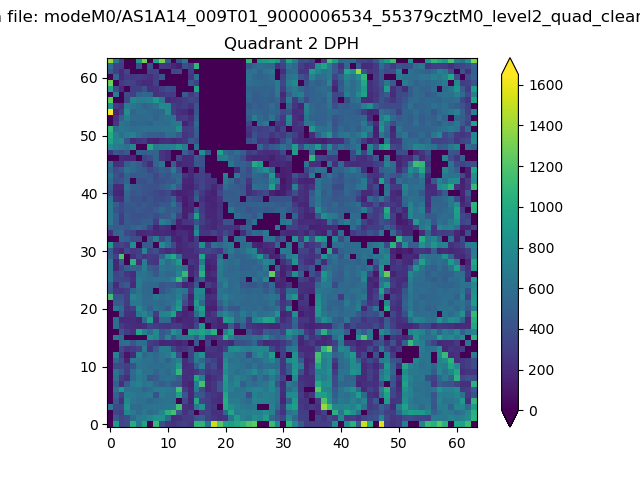 |
Quadrant C |
| Plot type | Count rate plots | Images |
|---|---|---|
| Comparison with Poisson distribution Blue bars denote a histogram of data divided into 1 sec bins. Red curve is a Poisson curve with rate = median count rate of data. |
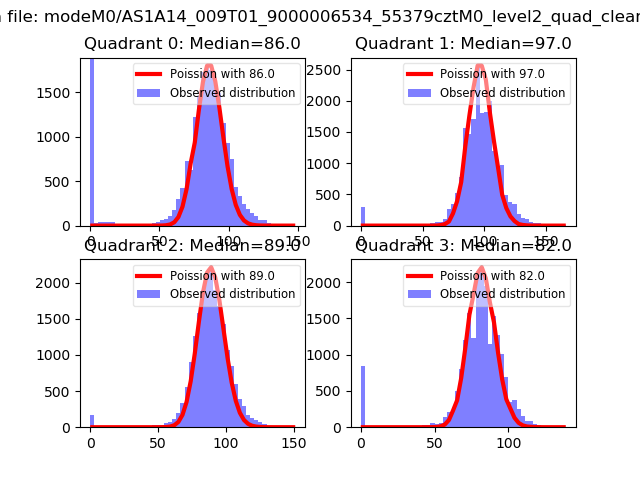 |
 |
| Quadrant-wise count rates Data is divided into 100 sec bins |
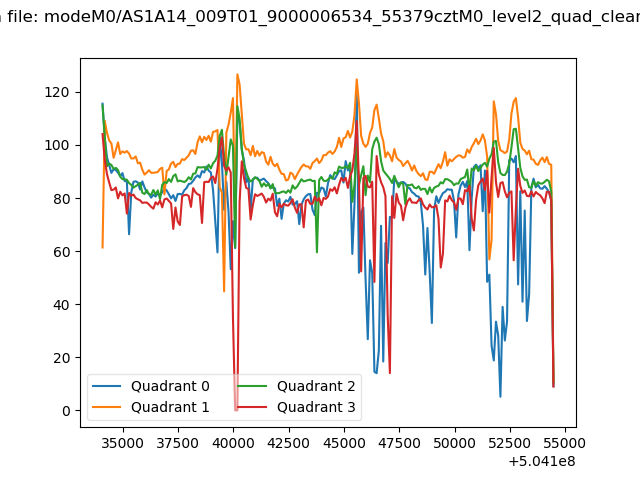 |
|
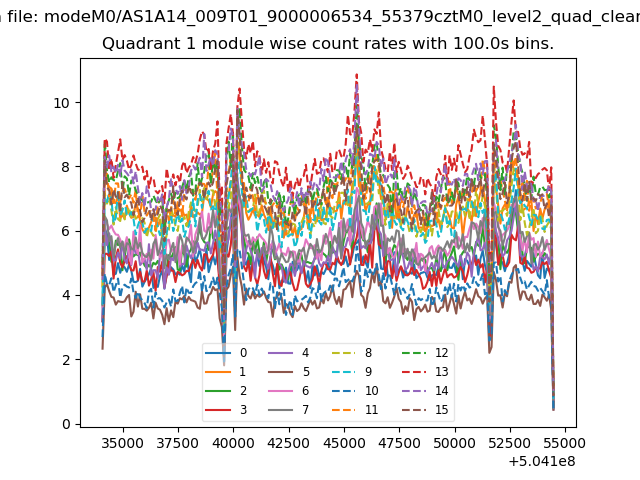
| Module-wise count rates for Quadrant A Data is divided into 100 sec bins |
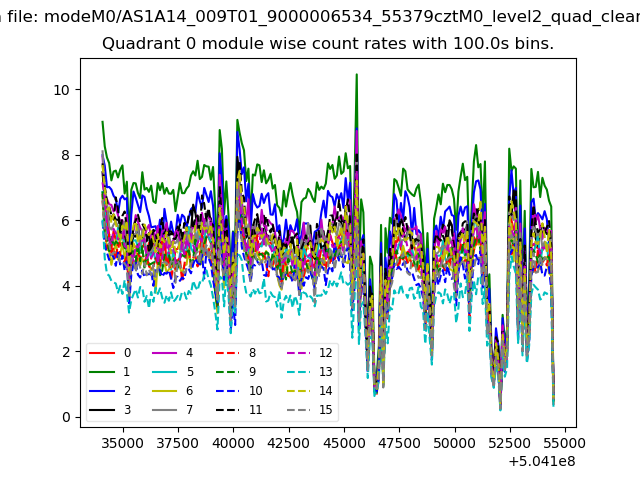 |
 |
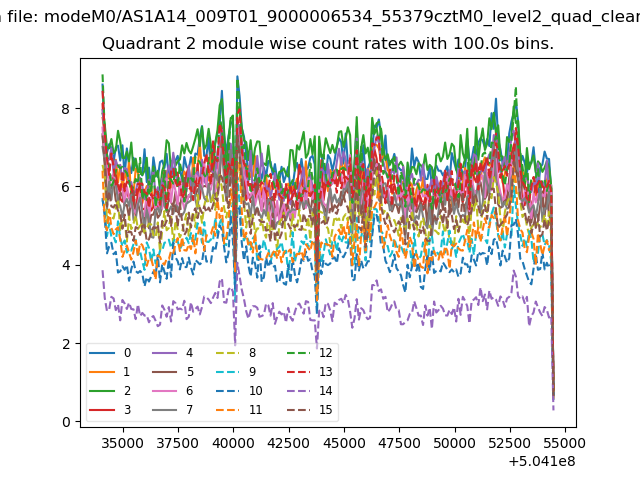
| Module-wise count rates for Quadrant B Data is divided into 100 sec bins |
 |
 |
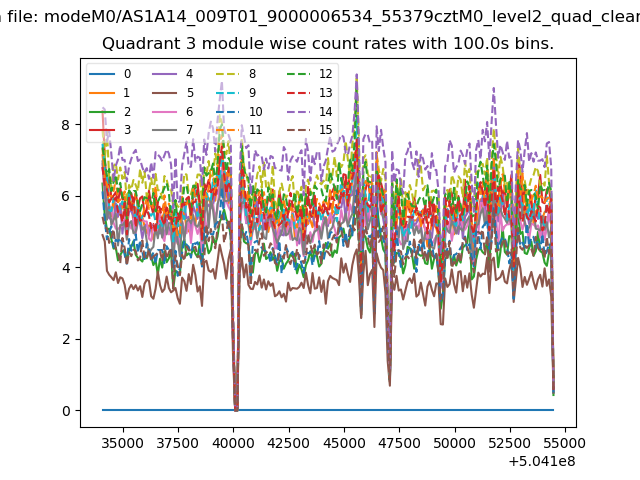
| Module-wise count rates for Quadrant C Data is divided into 100 sec bins |
 |
 |
| Module-wise count rates for Quadrant D Data is divided into 100 sec bins |
 |
 |
| Parameter | Plot |
|---|---|
| CZT HV Monitor | 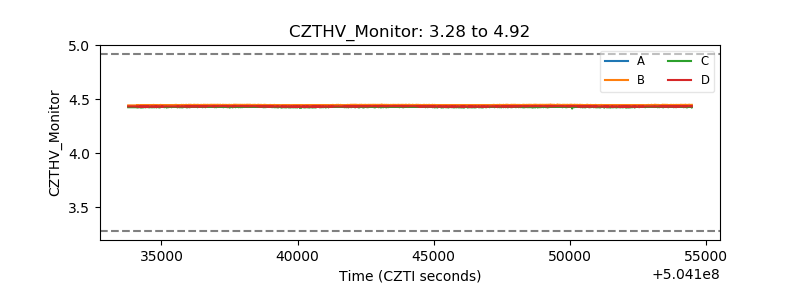 |
| D_VDD | 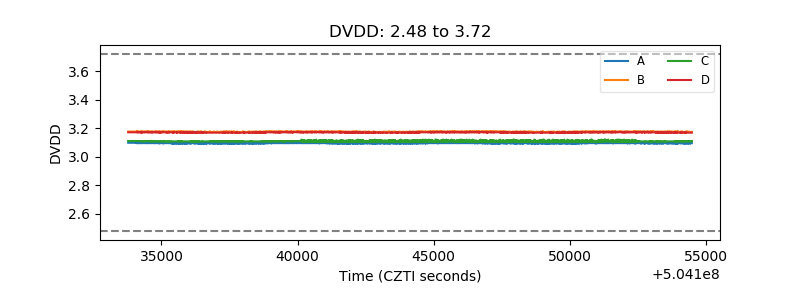 |
| Temperature 1 | 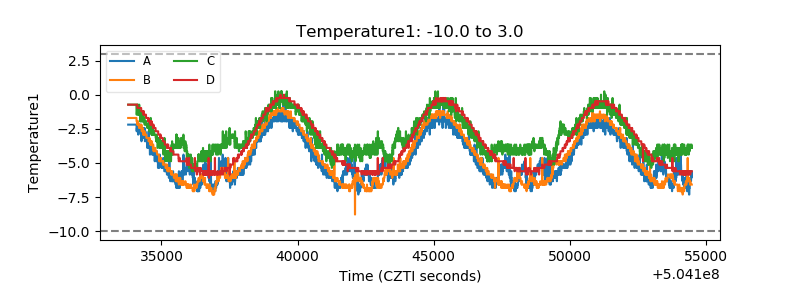 |
| Veto HV Monitor | 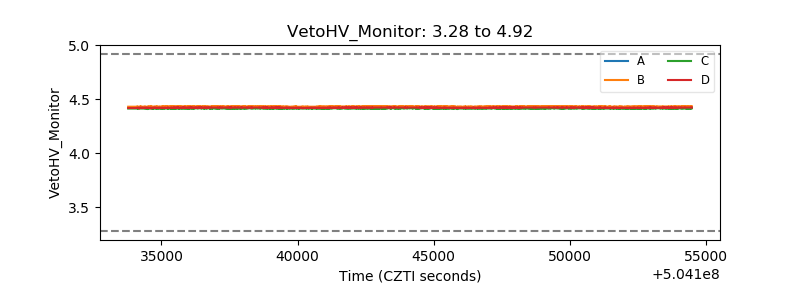 |
| Veto LLD | 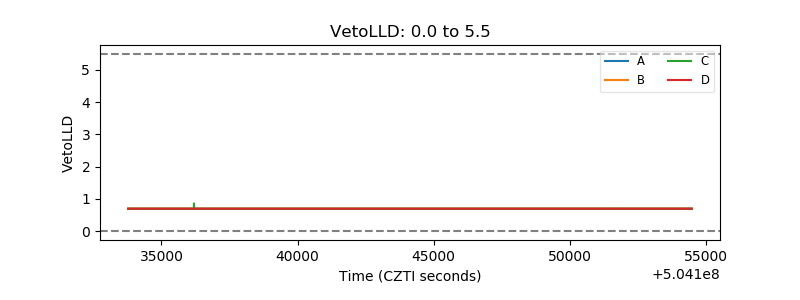 |
| Alpha Counter | 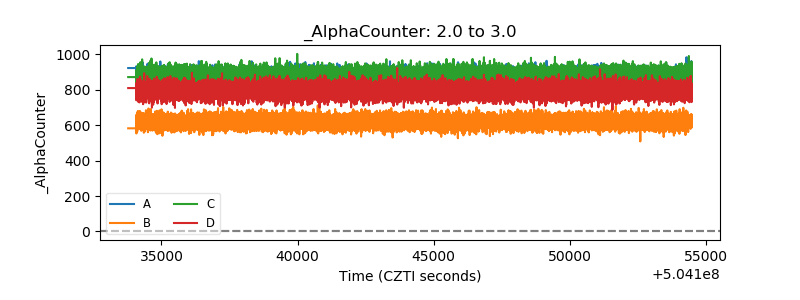 |
| _CPM_Rate | 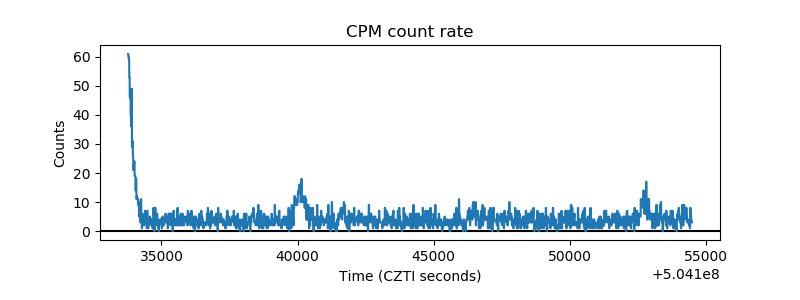 |
| CZT Counter | 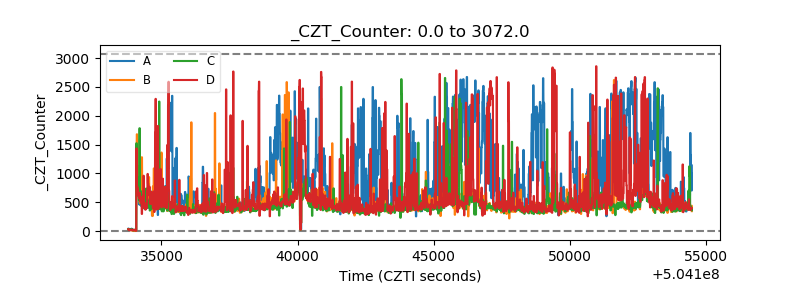 |
| +2.5 Volts monitor | 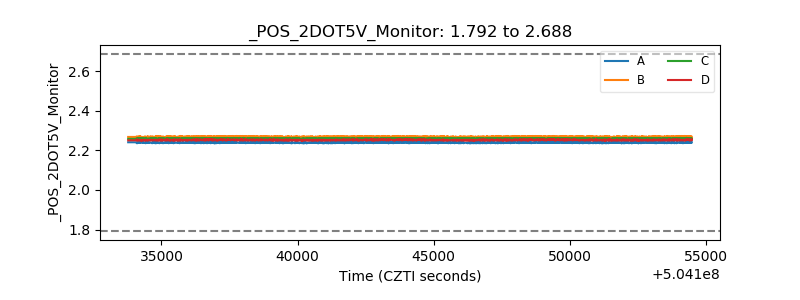 |
| +5 Volts monitor | 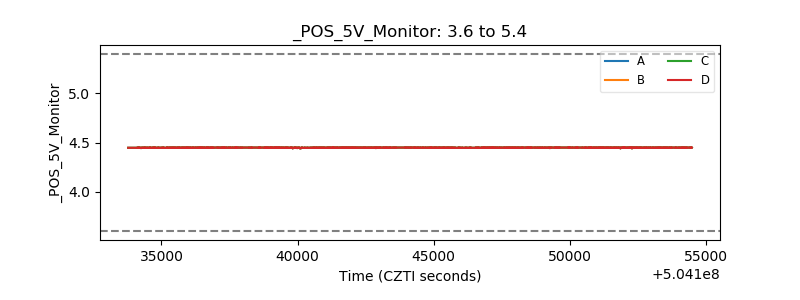 |
| _ROLL_ROT | 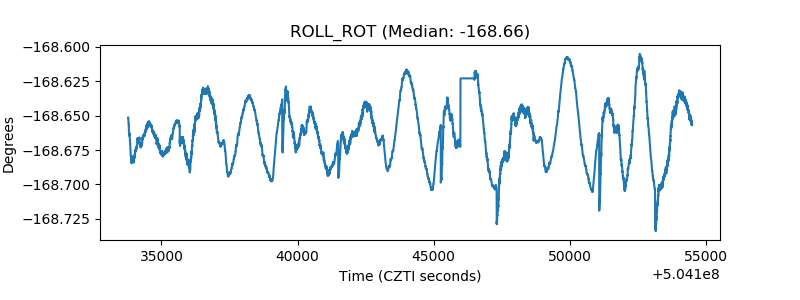 |
| _Roll_DEC | 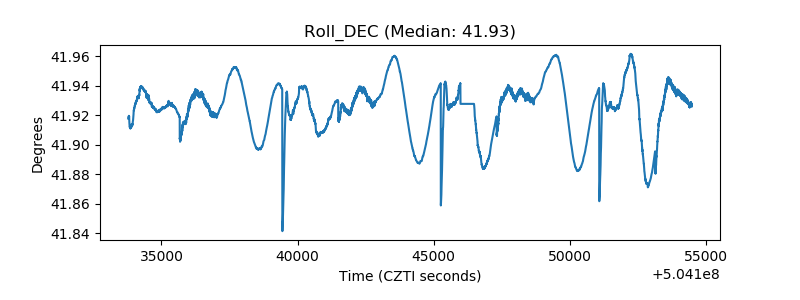 |
| _Roll_RA | 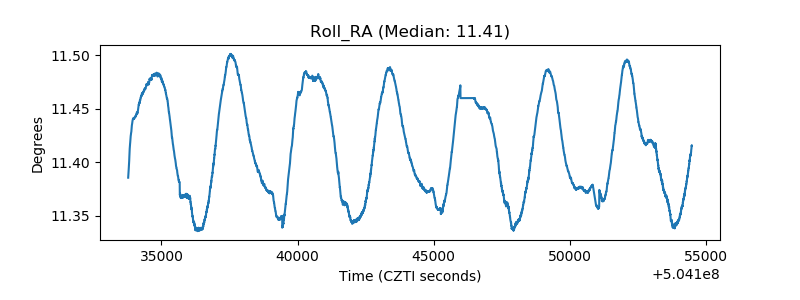 |
| Veto Counter | 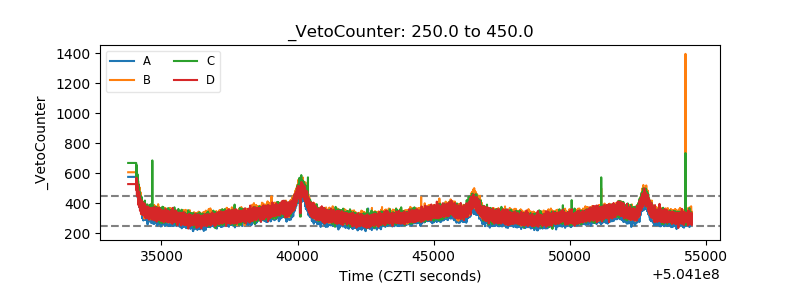 |