| Param | Original file | Final file |
|---|---|---|
| Filename | modeM0/AS1A14_009T01_9000006534_55385cztM0_level2.fits | modeM0/AS1A14_009T01_9000006534_55385cztM0_level2_quad_clean.evt |
| Size (bytes) | 476,023,680 | 97,597,440 |
| Size | 454.0 MB | 93.1 MB |
| Events in quadrant A | 5,754,340 | 603,713 |
| Events in quadrant B | 3,225,948 | 687,935 |
| Events in quadrant C | 3,764,662 | 620,120 |
| Events in quadrant D | 4,356,442 | 577,944 |
| Mode SS | |||
|---|---|---|---|
| Quadrant | BADHDUFLAG | Total packets | Discarded packets |
| A | 0 | 134 | 0 |
| B | 0 | 134 | 0 |
| C | 0 | 134 | 0 |
| D | 0 | 134 | 0 |
| Mode M0 | |||
|---|---|---|---|
| Quadrant | BADHDUFLAG | Total packets | Discarded packets |
| A | 0 | 21607 | 2 |
| B | 0 | 14629 | 2 |
| C | 0 | 15968 | 2 |
| D | 0 | 17684 | 2 |
| Mode M9 | |||
|---|---|---|---|
| Quadrant | BADHDUFLAG | Total packets | Discarded packets |
| A | 0 | 16 | 0 |
| B | 0 | 17 | 0 |
| C | 0 | 17 | 0 |
| D | 0 | 17 | 0 |
| Quadrant | Total seconds | Saturated seconds | Saturation percentage |
|---|---|---|---|
| A | 6682 | 722 | 10.805148% |
| B | 6682 | 199 | 2.978150% |
| C | 6682 | 140 | 2.095181% |
| D | 6682 | 306 | 4.579467% |
Noise dominated data is calculated using 1-second bins in cleaned event files. If a bin has >2000 counts, and if more than 50% of those come from <1% of pixels, then it is considered to be noise-dominated and hence unusable.
| Quadrant | # 1 sec bins | Bins with >0 counts | Bins with >2000 counts | High rate bins dominated by noise | Noise dominated (total time) | Noise dominated (detector-on time) | Marked lightcurve |
|---|---|---|---|---|---|---|---|
| A | 7642 | 6682 | 572 | 572 | 7.48% | 8.56% | 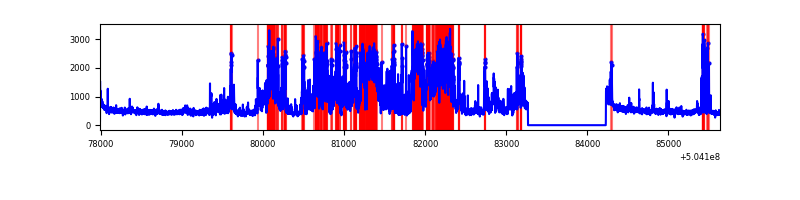 |
| B | 7642 | 6682 | 63 | 63 | 0.82% | 0.94% | 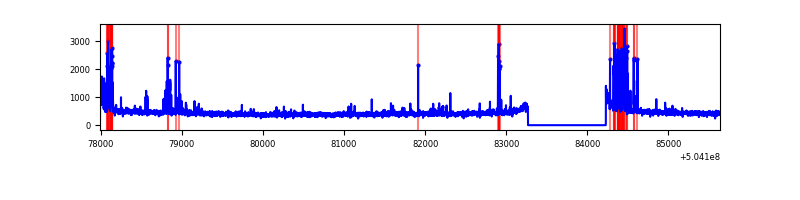 |
| C | 7642 | 6682 | 96 | 96 | 1.26% | 1.44% | 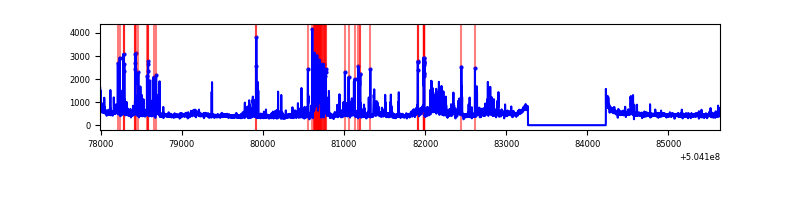 |
| D | 7642 | 6682 | 252 | 252 | 3.30% | 3.77% | 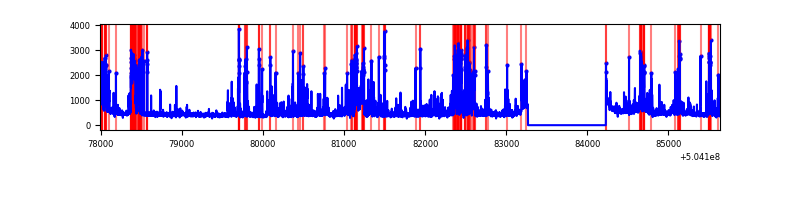 |
Top three noisy pixels from each quadrant. If the there are fewer than three noisy pixels in the level2.evt file, extra rows are filled as -1
| Pixel properties | Quadrant properties | ||||||
|---|---|---|---|---|---|---|---|
| Quadrant | DetID | PixID | Counts | Sigma | Mean | Median | Sigma |
| A | 4 | 159 | 2722235 | 15127.74 | 718 | 699 | 179.9 |
| A | 0 | 8 | 121197 | 669.79 | 718 | 699 | 179.9 |
| A | 11 | 31 | 38164 | 208.25 | 718 | 699 | 179.9 |
| B | 10 | 247 | 215114 | 1395.51 | 714 | 688 | 153.7 |
| B | 5 | 172 | 104858 | 677.95 | 714 | 688 | 153.7 |
| B | 0 | 199 | 30445 | 193.66 | 714 | 688 | 153.7 |
| C | 13 | 3 | 460549 | 2364.41 | 702 | 693 | 194.5 |
| C | 14 | 254 | 197512 | 1011.97 | 702 | 693 | 194.5 |
| C | 7 | 220 | 119224 | 609.44 | 702 | 693 | 194.5 |
| D | 8 | 160 | 480973 | 2388.22 | 702 | 671 | 201.1 |
| D | 8 | 245 | 458360 | 2275.78 | 702 | 671 | 201.1 |
| D | 11 | 129 | 367834 | 1825.66 | 702 | 671 | 201.1 |
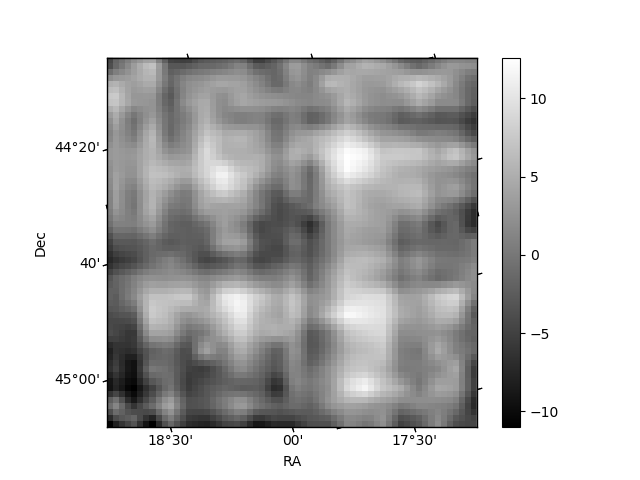
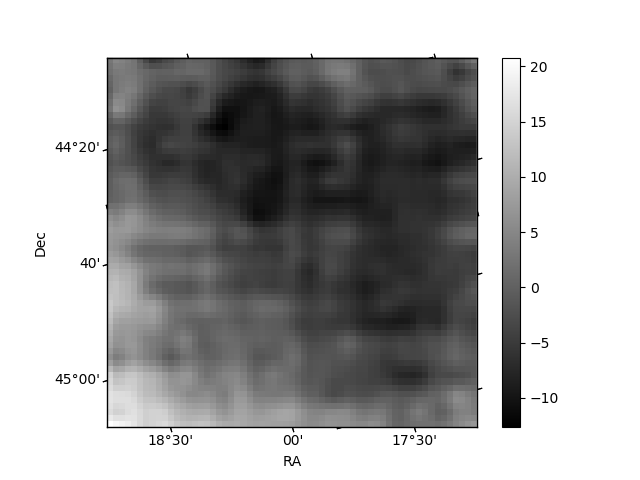
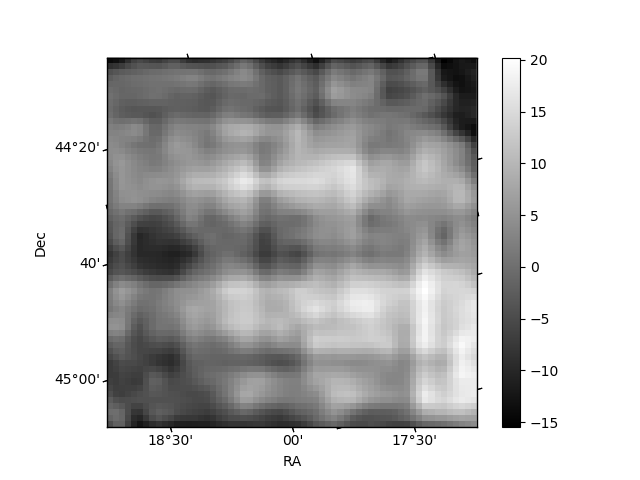
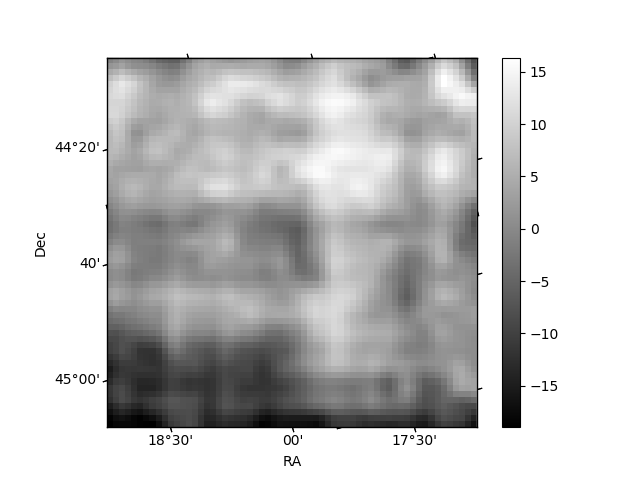
Histogram calculated using DETX and DETY for each event in the final _common_clean file
| Quadrant A | 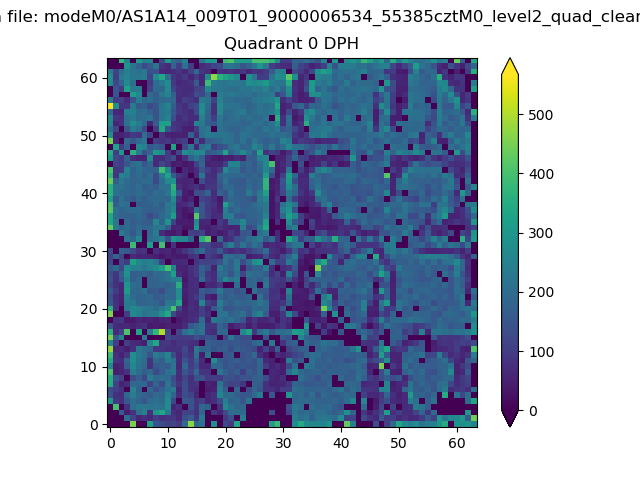 |
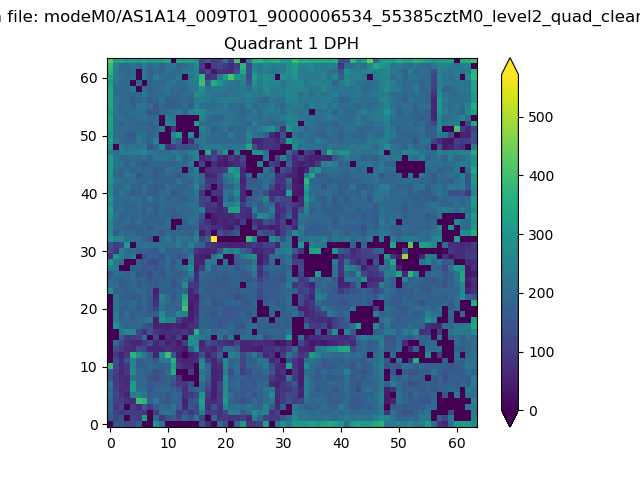 |
Quadrant B |
|---|---|---|---|
| Quadrant D | 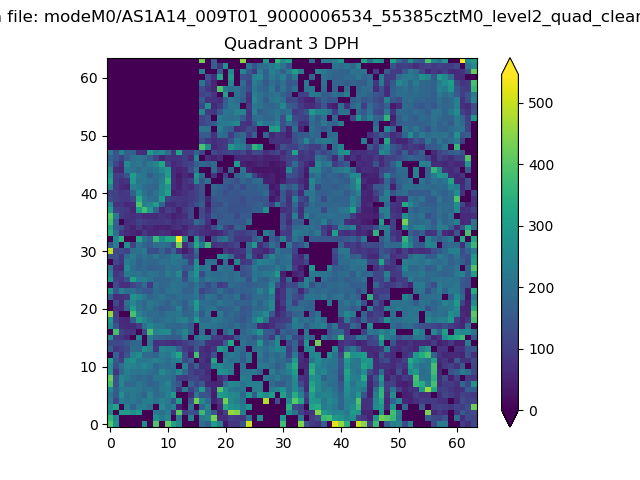 |
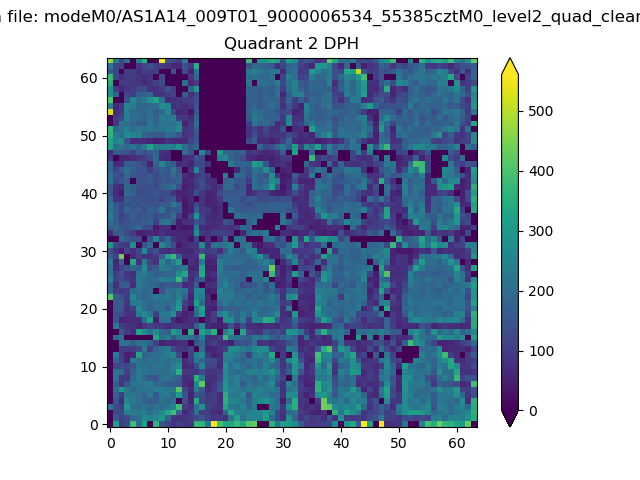 |
Quadrant C |
| Plot type | Count rate plots | Images |
|---|---|---|
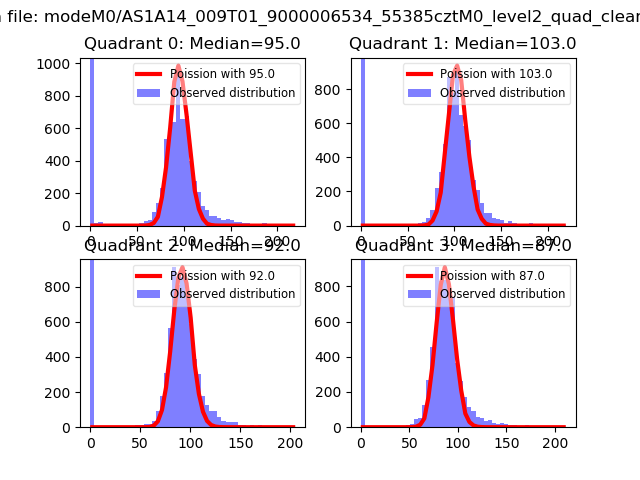
| Comparison with Poisson distribution Blue bars denote a histogram of data divided into 1 sec bins. Red curve is a Poisson curve with rate = median count rate of data. |
 |
 |
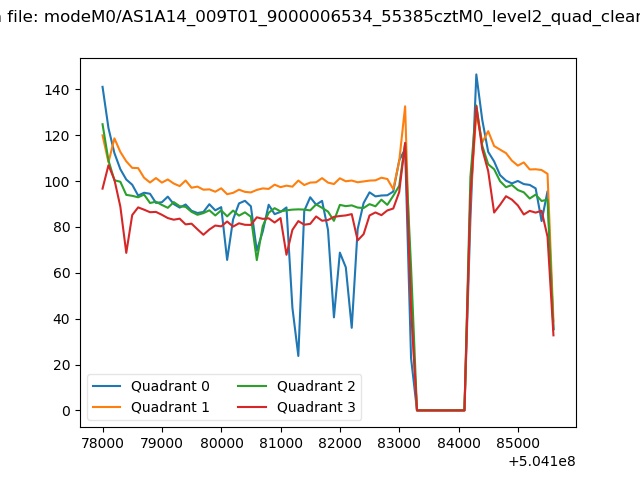
| Quadrant-wise count rates Data is divided into 100 sec bins |
 |
|
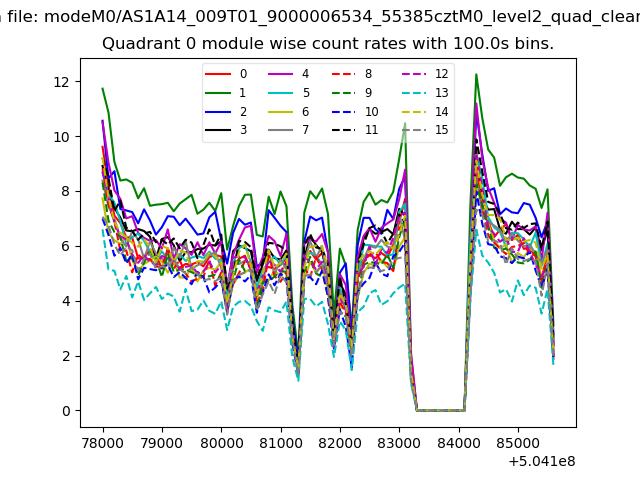
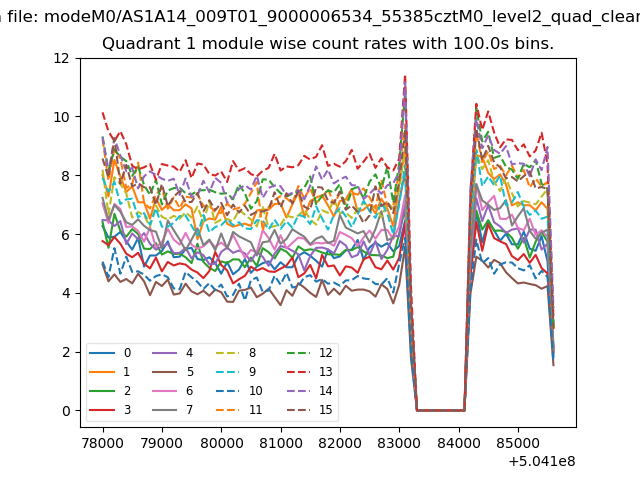
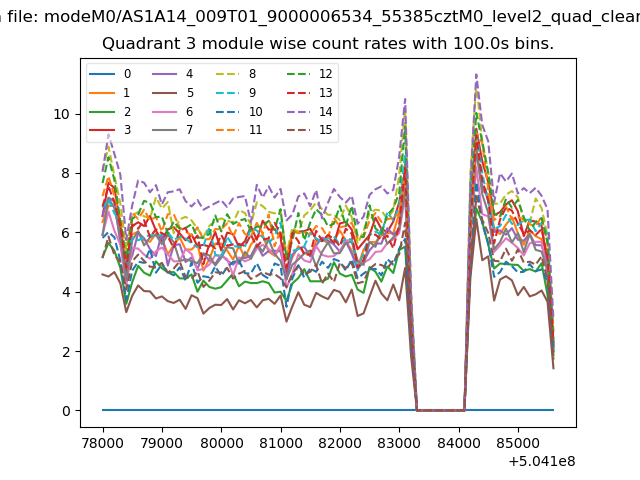
| Module-wise count rates for Quadrant A Data is divided into 100 sec bins |
 |
 |
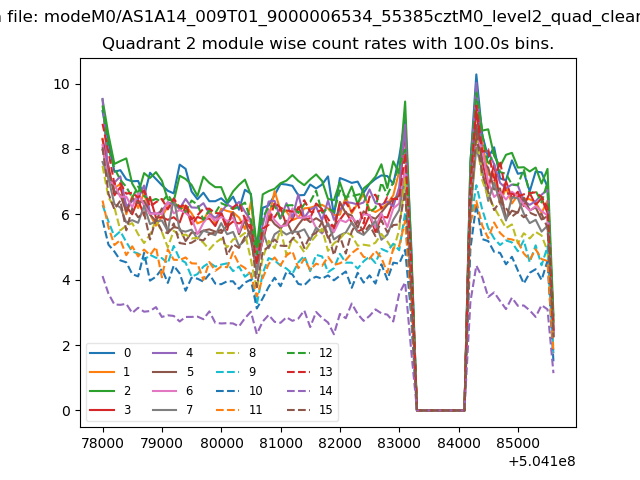
| Module-wise count rates for Quadrant B Data is divided into 100 sec bins |
 |
 |
| Module-wise count rates for Quadrant C Data is divided into 100 sec bins |
 |
 |
| Module-wise count rates for Quadrant D Data is divided into 100 sec bins |
 |
 |
| Parameter | Plot |
|---|---|
| CZT HV Monitor | 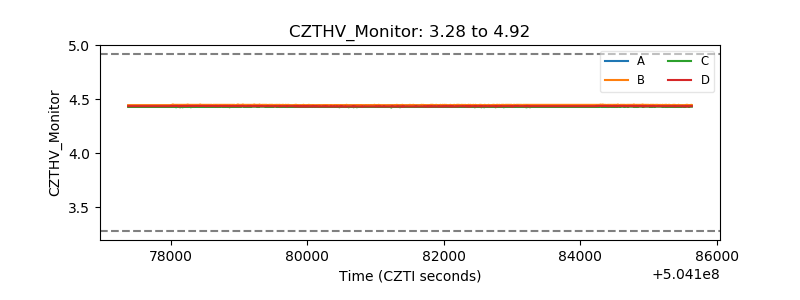 |
| D_VDD | 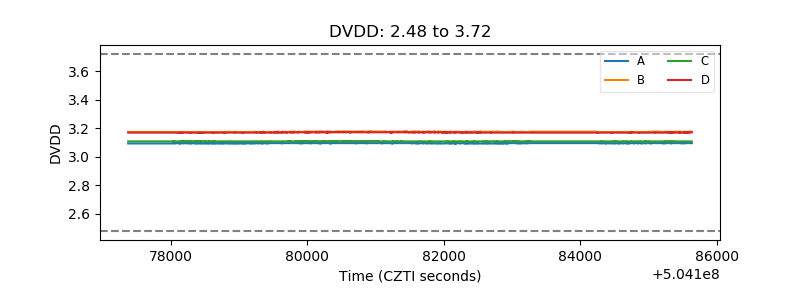 |
| Temperature 1 | 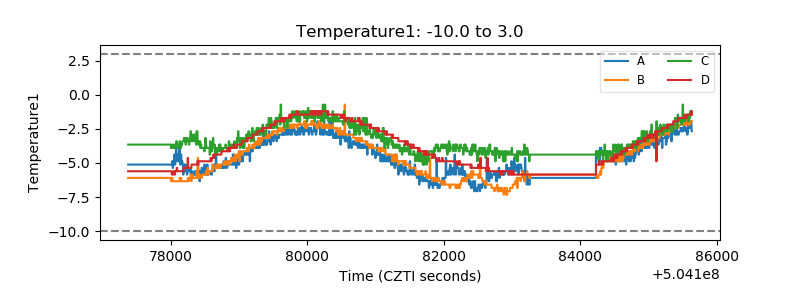 |
| Veto HV Monitor | 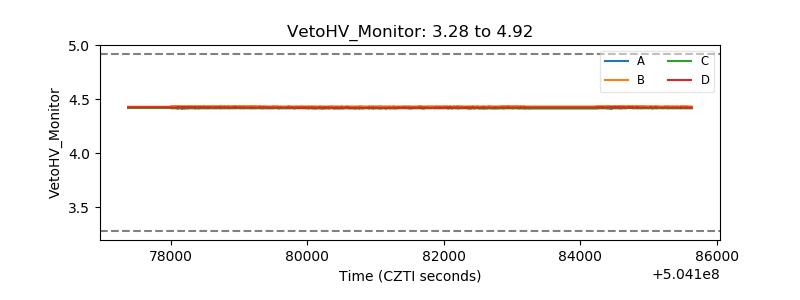 |
| Veto LLD | 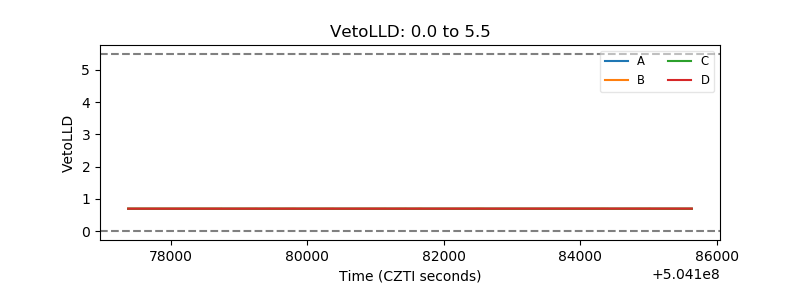 |
| Alpha Counter | 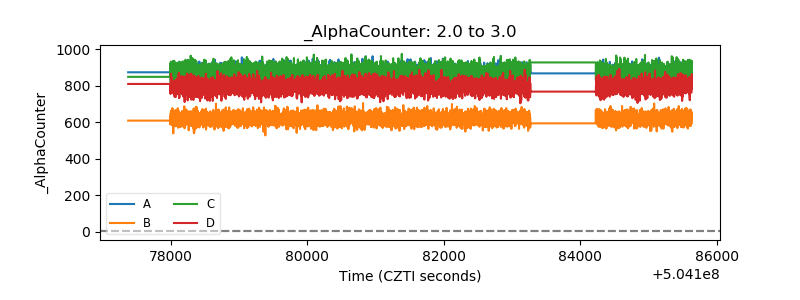 |
| _CPM_Rate | 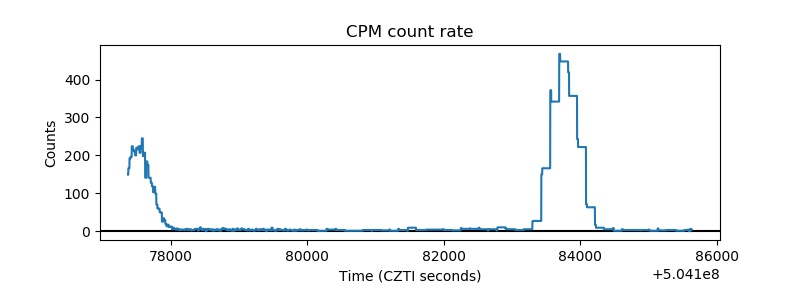 |
| CZT Counter | 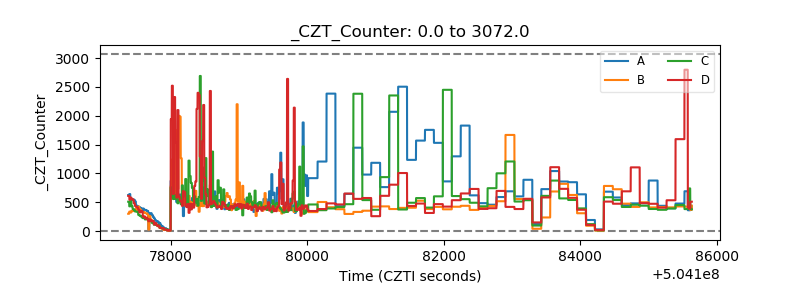 |
| +2.5 Volts monitor |  |
| +5 Volts monitor |  |
| _ROLL_ROT | 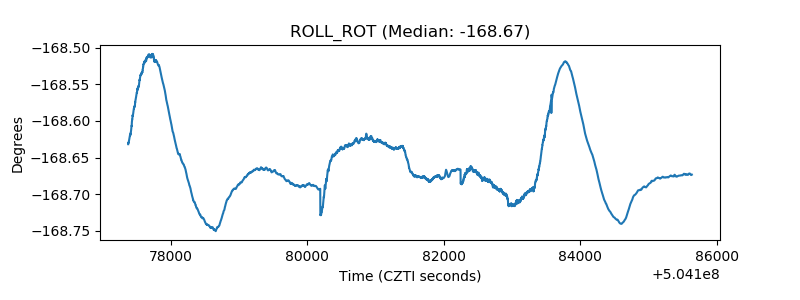 |
| _Roll_DEC | 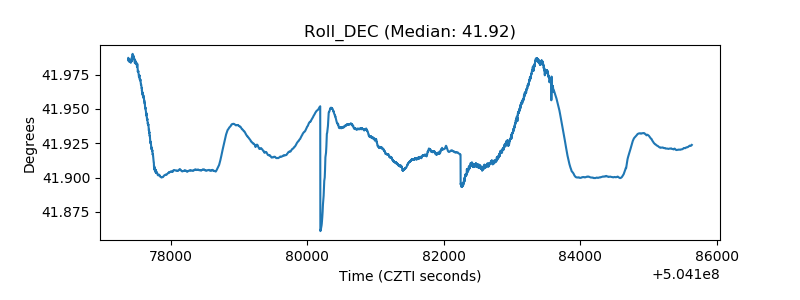 |
| _Roll_RA | 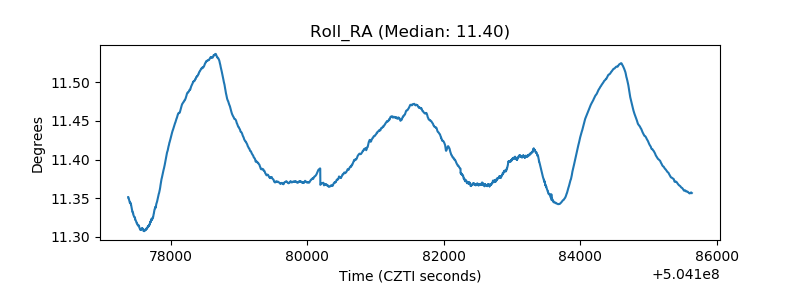 |
| Veto Counter | 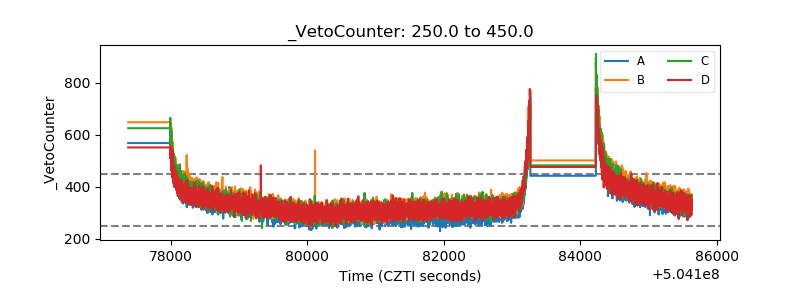 |