| Param | Original file | Final file |
|---|---|---|
| Filename | modeM0/AS1A14_009T01_9000006534_55386cztM0_level2.fits | modeM0/AS1A14_009T01_9000006534_55386cztM0_level2_quad_clean.evt |
| Size (bytes) | 29,427,840 | 6,868,800 |
| Size | 28.1 MB | 6.6 MB |
| Events in quadrant A | 295,951 | 42,080 |
| Events in quadrant B | 225,612 | 45,118 |
| Events in quadrant C | 230,958 | 40,443 |
| Events in quadrant D | 293,655 | 37,683 |
| Mode SS | |||
|---|---|---|---|
| Quadrant | BADHDUFLAG | Total packets | Discarded packets |
| A | 0 | 10 | 0 |
| B | 0 | 10 | 0 |
| C | 0 | 10 | 0 |
| D | 0 | 9 | 1 |
| Mode M0 | |||
|---|---|---|---|
| Quadrant | BADHDUFLAG | Total packets | Discarded packets |
| A | 0 | 1313 | 94 |
| B | 0 | 1076 | 55 |
| C | 0 | 1085 | 47 |
| D | 0 | 1250 | 38 |
| Mode M9 | |||
|---|---|---|---|
| Quadrant | BADHDUFLAG | Total packets | Discarded packets |
| A | 0 | 1 | 1 |
| B | 1 | 1 | 1 |
| C | 1 | -1 | -1 |
| D | 1 | -1 | -1 |
| Quadrant | Total seconds | Saturated seconds | Saturation percentage |
|---|---|---|---|
| A | 503 | 12 | 2.385686% |
| B | 501 | 0 | 0.000000% |
| C | 509 | 0 | 0.000000% |
| D | 512 | 10 | 1.953125% |
Noise dominated data is calculated using 1-second bins in cleaned event files. If a bin has >2000 counts, and if more than 50% of those come from <1% of pixels, then it is considered to be noise-dominated and hence unusable.
| Quadrant | # 1 sec bins | Bins with >0 counts | Bins with >2000 counts | High rate bins dominated by noise | Noise dominated (total time) | Noise dominated (detector-on time) | Marked lightcurve |
|---|---|---|---|---|---|---|---|
| A | 855 | 506 | 10 | 10 | 1.17% | 1.98% | 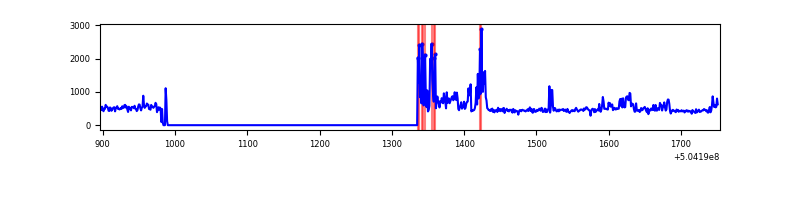 |
| B | 854 | 505 | 1 | 1 | 0.12% | 0.20% | 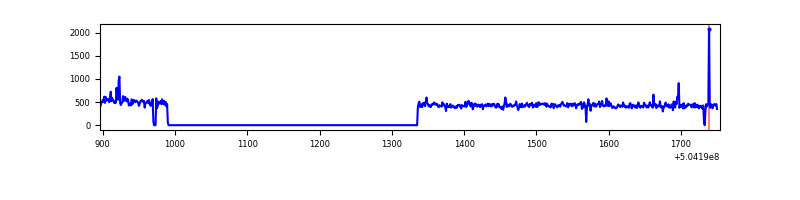 |
| C | 857 | 513 | 0 | 0 | 0.00% | 0.00% | 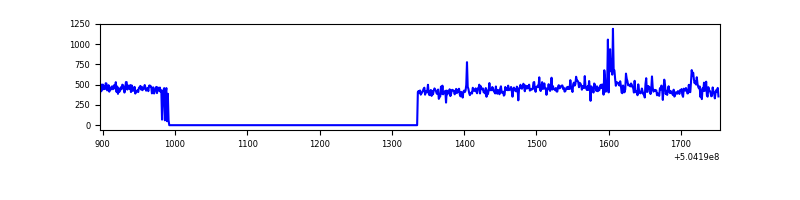 |
| D | 858 | 518 | 11 | 11 | 1.28% | 2.12% | 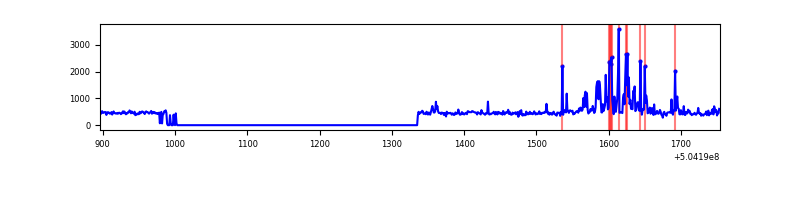 |
Top three noisy pixels from each quadrant. If the there are fewer than three noisy pixels in the level2.evt file, extra rows are filled as -1
| Pixel properties | Quadrant properties | ||||||
|---|---|---|---|---|---|---|---|
| Quadrant | DetID | PixID | Counts | Sigma | Mean | Median | Sigma |
| A | 0 | 8 | 41137 | 2598.65 | 56 | 54 | 15.8 |
| A | 4 | 159 | 34409 | 2173.08 | 56 | 54 | 15.8 |
| A | 12 | 18 | 1115 | 67.11 | 56 | 54 | 15.8 |
| B | 10 | 247 | 5506 | 399.31 | 54 | 52 | 13.7 |
| B | 4 | 156 | 2308 | 165.17 | 54 | 52 | 13.7 |
| B | 12 | 111 | 1345 | 94.67 | 54 | 52 | 13.7 |
| C | 9 | 38 | 10221 | 613.53 | 54 | 53 | 16.6 |
| C | 13 | 3 | 6526 | 390.58 | 54 | 53 | 16.6 |
| C | 14 | 254 | 2701 | 159.78 | 54 | 53 | 16.6 |
| D | 8 | 160 | 65469 | 3827.25 | 55 | 52 | 17.1 |
| D | 5 | 173 | 4372 | 252.74 | 55 | 52 | 17.1 |
| D | 1 | 3 | 3163 | 182.01 | 55 | 52 | 17.1 |
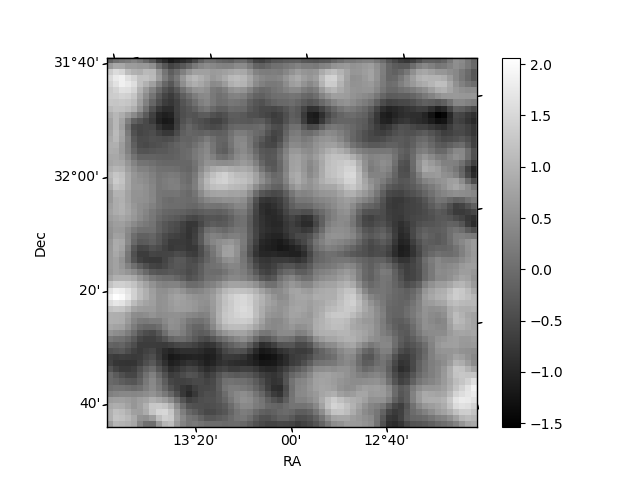
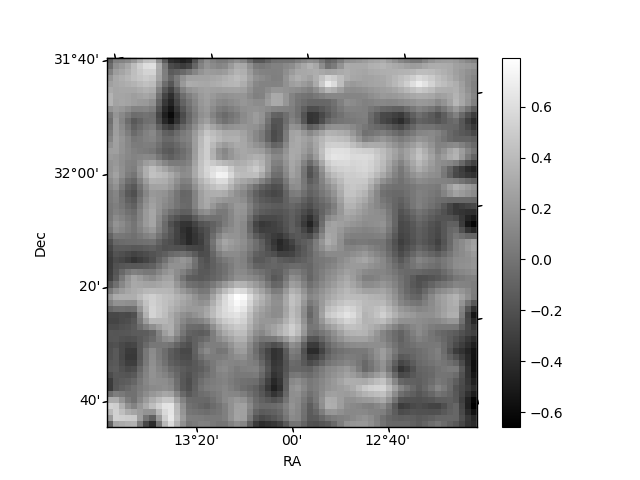
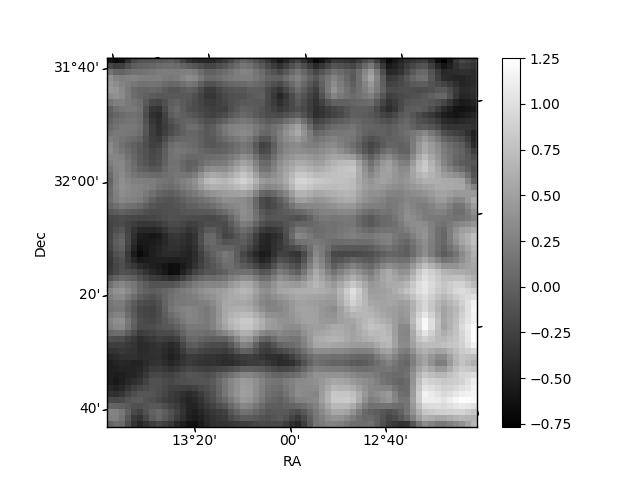
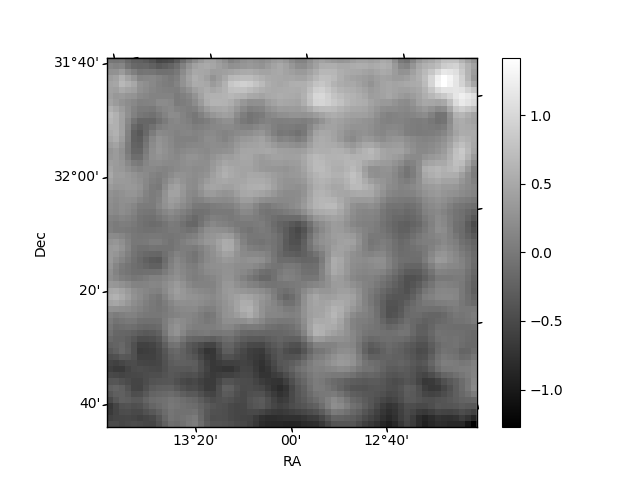
Histogram calculated using DETX and DETY for each event in the final _common_clean file
| Quadrant A | 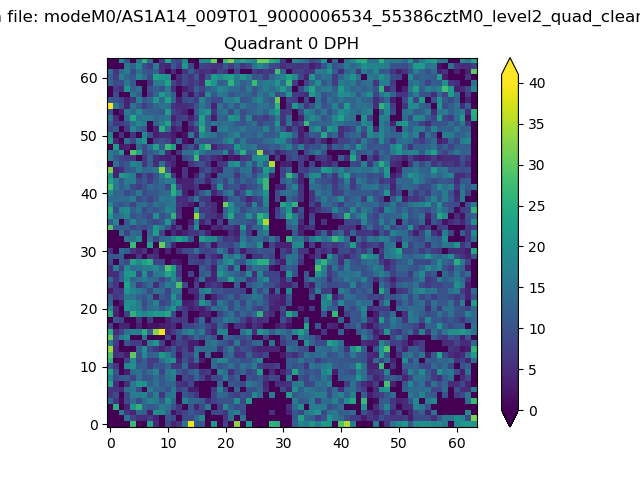 |
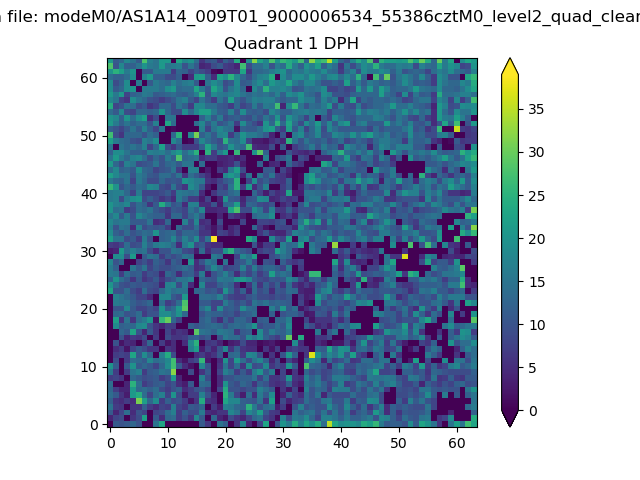 |
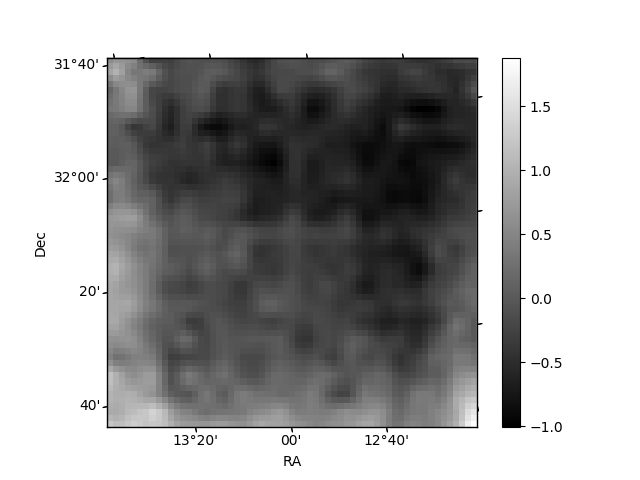
Quadrant B |
|---|---|---|---|
| Quadrant D | 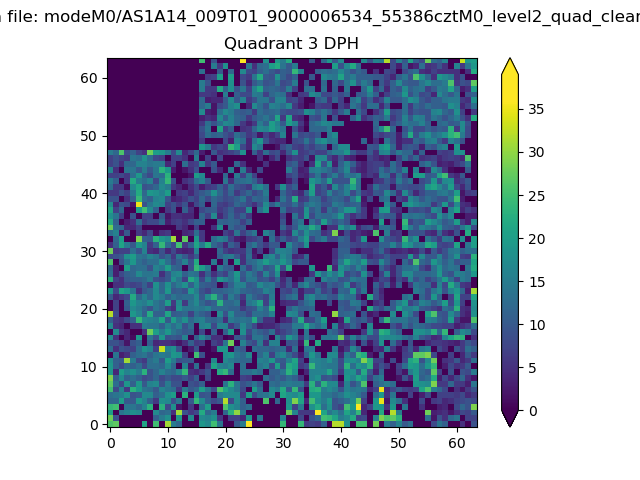 |
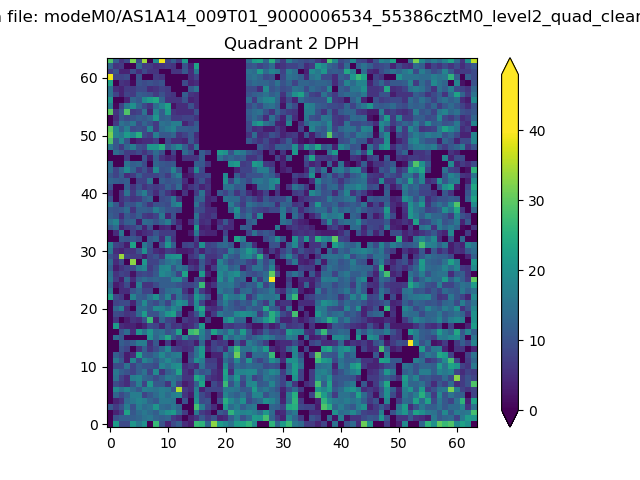 |
Quadrant C |
| Plot type | Count rate plots | Images |
|---|---|---|
| Comparison with Poisson distribution Blue bars denote a histogram of data divided into 1 sec bins. Red curve is a Poisson curve with rate = median count rate of data. |
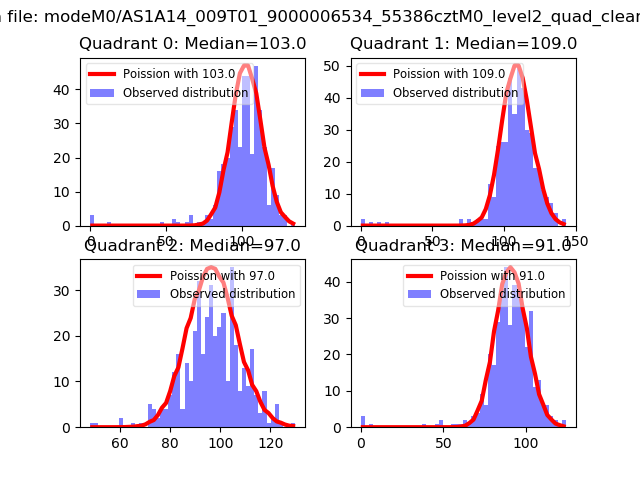 |
 |
| Quadrant-wise count rates Data is divided into 100 sec bins |
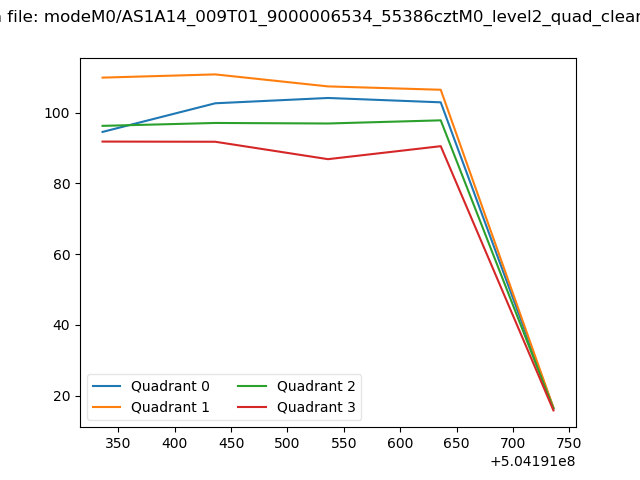 |
|
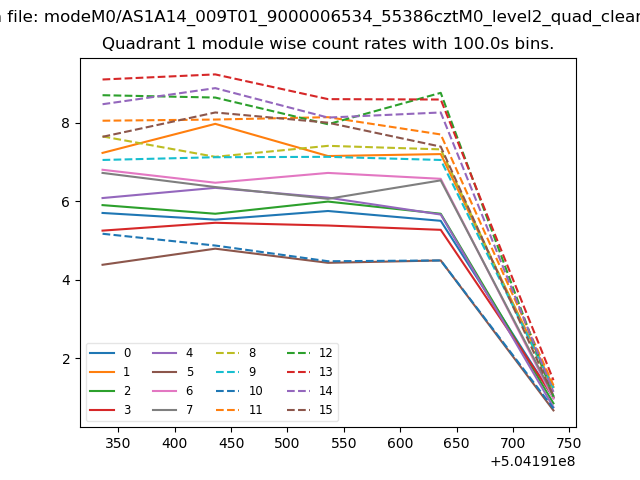
| Module-wise count rates for Quadrant A Data is divided into 100 sec bins |
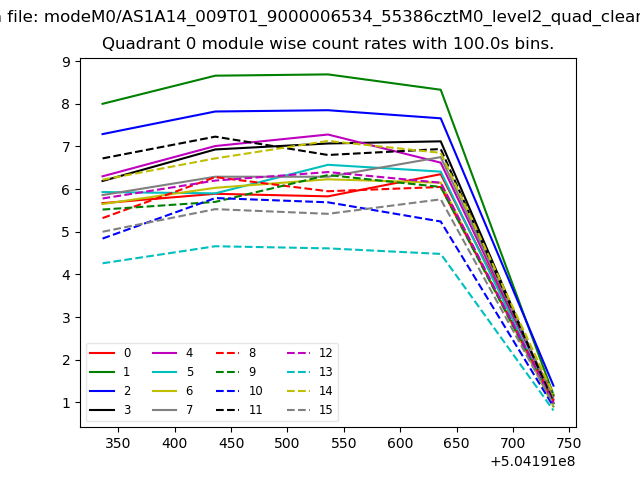 |
 |
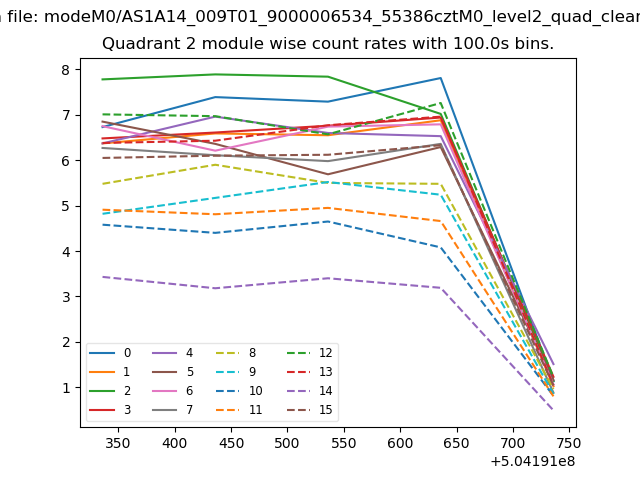
| Module-wise count rates for Quadrant B Data is divided into 100 sec bins |
 |
 |
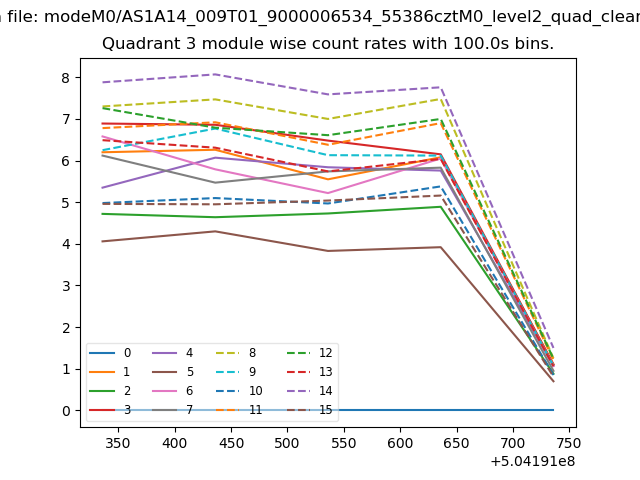
| Module-wise count rates for Quadrant C Data is divided into 100 sec bins |
 |
 |
| Module-wise count rates for Quadrant D Data is divided into 100 sec bins |
 |
 |
| Parameter | Plot |
|---|---|
| CZT HV Monitor | 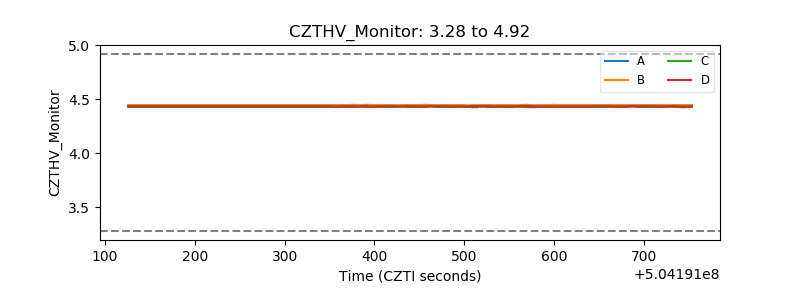 |
| D_VDD | 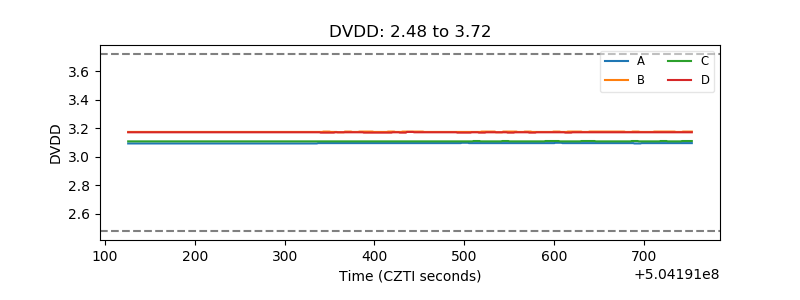 |
| Temperature 1 | 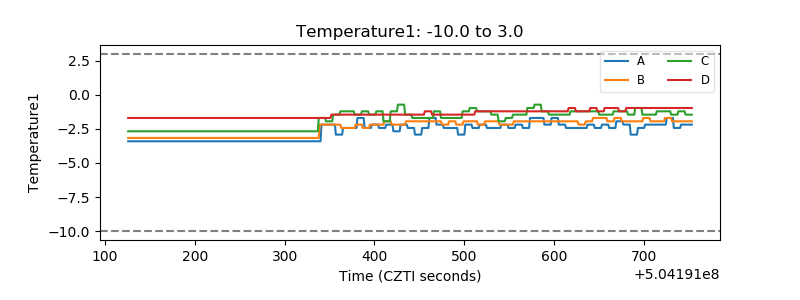 |
| Veto HV Monitor | 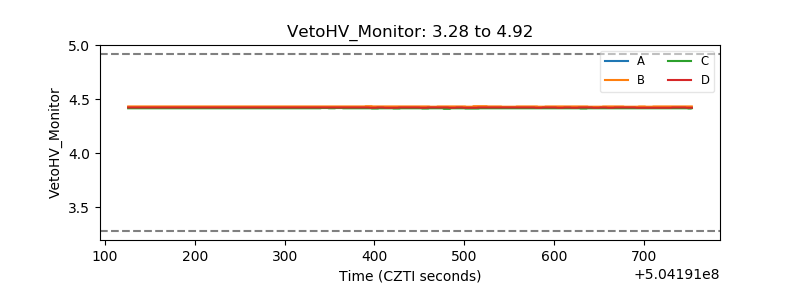 |
| Veto LLD | 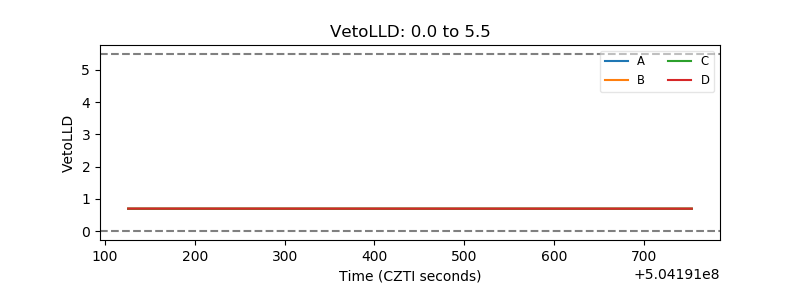 |
| Alpha Counter | 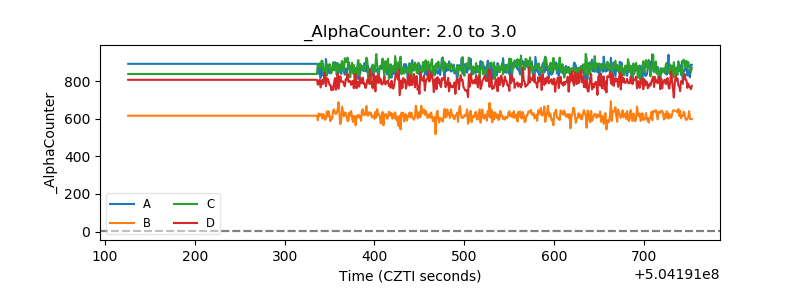 |
| _CPM_Rate | 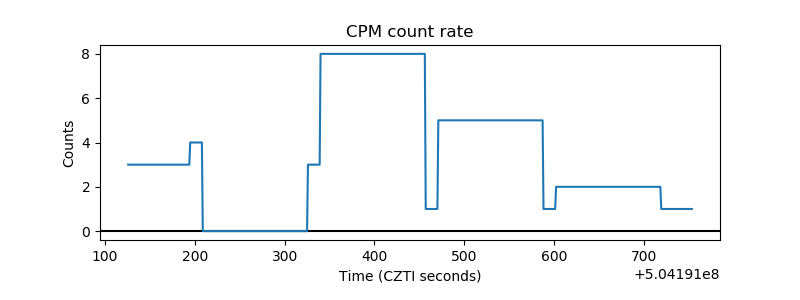 |
| CZT Counter | 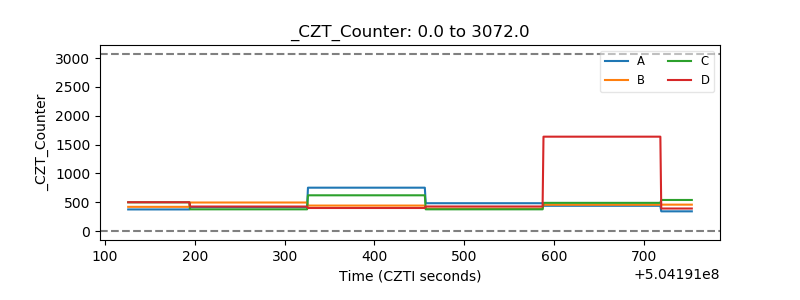 |
| +2.5 Volts monitor |  |
| +5 Volts monitor |  |
| _ROLL_ROT | 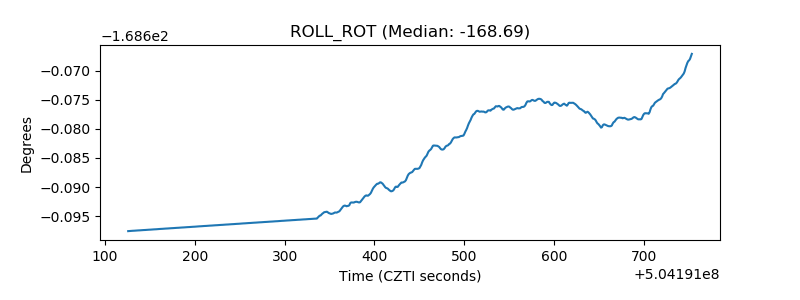 |
| _Roll_DEC | 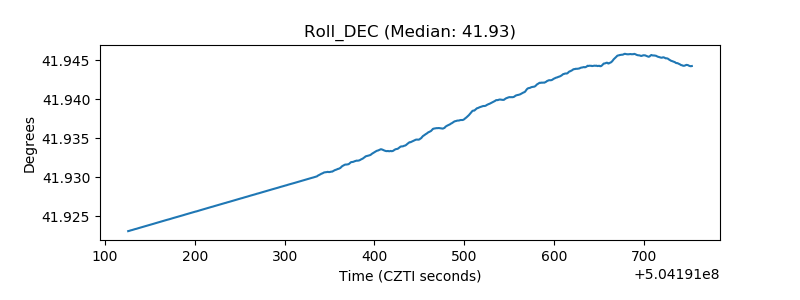 |
| _Roll_RA | 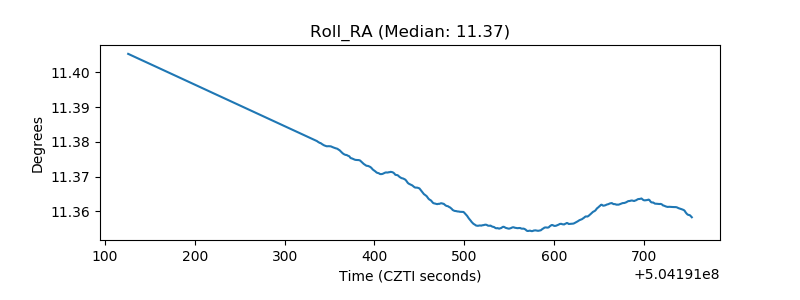 |
| Veto Counter | 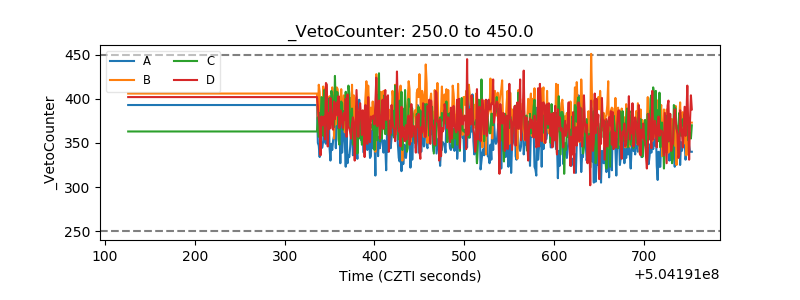 |