| Param | Original file | Final file |
|---|---|---|
| Filename | modeM0/AS1A14_009T01_9000006534_55387cztM0_level2.fits | modeM0/AS1A14_009T01_9000006534_55387cztM0_level2_quad_clean.evt |
| Size (bytes) | 403,038,720 | 103,890,240 |
| Size | 384.4 MB | 99.1 MB |
| Events in quadrant A | 3,674,925 | 682,876 |
| Events in quadrant B | 3,096,037 | 732,255 |
| Events in quadrant C | 3,389,398 | 652,153 |
| Events in quadrant D | 4,230,640 | 605,221 |
| Mode SS | |||
|---|---|---|---|
| Quadrant | BADHDUFLAG | Total packets | Discarded packets |
| A | 0 | 140 | 0 |
| B | 0 | 140 | 0 |
| C | 0 | 140 | 0 |
| D | 0 | 140 | 0 |
| Mode M0 | |||
|---|---|---|---|
| Quadrant | BADHDUFLAG | Total packets | Discarded packets |
| A | 0 | 15607 | 2 |
| B | 0 | 14134 | 2 |
| C | 0 | 15038 | 2 |
| D | 0 | 17298 | 2 |
| Mode M9 | |||
|---|---|---|---|
| Quadrant | BADHDUFLAG | Total packets | Discarded packets |
| A | 0 | 11 | 0 |
| B | 0 | 11 | 0 |
| C | 0 | 11 | 0 |
| D | 0 | 11 | 0 |
| Quadrant | Total seconds | Saturated seconds | Saturation percentage |
|---|---|---|---|
| A | 6787 | 159 | 2.342714% |
| B | 6788 | 102 | 1.502652% |
| C | 6787 | 96 | 1.414469% |
| D | 6787 | 274 | 4.037130% |
Noise dominated data is calculated using 1-second bins in cleaned event files. If a bin has >2000 counts, and if more than 50% of those come from <1% of pixels, then it is considered to be noise-dominated and hence unusable.
| Quadrant | # 1 sec bins | Bins with >0 counts | Bins with >2000 counts | High rate bins dominated by noise | Noise dominated (total time) | Noise dominated (detector-on time) | Marked lightcurve |
|---|---|---|---|---|---|---|---|
| A | 7927 | 6787 | 48 | 48 | 0.61% | 0.71% | 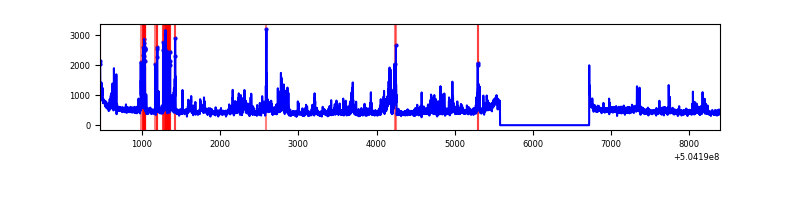 |
| B | 7928 | 6788 | 3 | 3 | 0.04% | 0.04% | 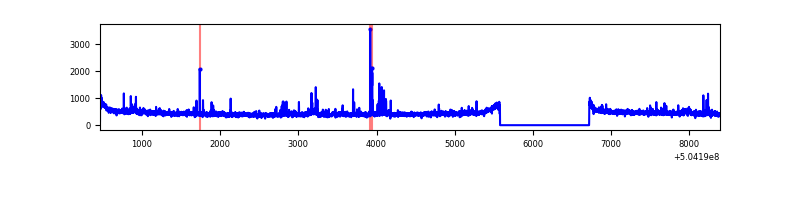 |
| C | 7927 | 6787 | 55 | 55 | 0.69% | 0.81% | 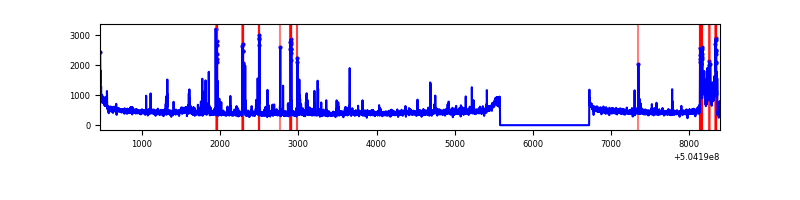 |
| D | 7927 | 6787 | 206 | 206 | 2.60% | 3.04% | 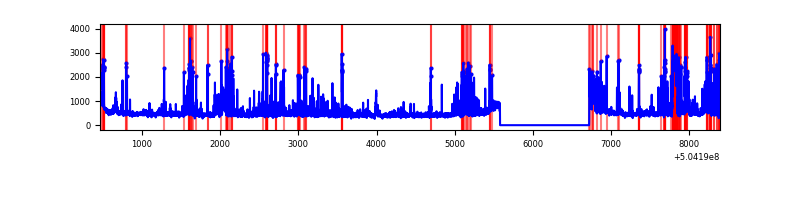 |
Top three noisy pixels from each quadrant. If the there are fewer than three noisy pixels in the level2.evt file, extra rows are filled as -1
| Pixel properties | Quadrant properties | ||||||
|---|---|---|---|---|---|---|---|
| Quadrant | DetID | PixID | Counts | Sigma | Mean | Median | Sigma |
| A | 4 | 159 | 461293 | 2488.38 | 753 | 735 | 185.1 |
| A | 0 | 8 | 210004 | 1130.67 | 753 | 735 | 185.1 |
| A | 3 | 78 | 15593 | 80.28 | 753 | 735 | 185.1 |
| B | 10 | 247 | 40079 | 246.9 | 740 | 714 | 159.4 |
| B | 0 | 199 | 29138 | 178.28 | 740 | 714 | 159.4 |
| B | 2 | 30 | 24791 | 151.01 | 740 | 714 | 159.4 |
| C | 13 | 3 | 361403 | 1800.9 | 729 | 724 | 200.3 |
| C | 14 | 254 | 63038 | 311.14 | 729 | 724 | 200.3 |
| C | 9 | 38 | 56591 | 278.95 | 729 | 724 | 200.3 |
| D | 8 | 160 | 685665 | 3392.5 | 725 | 695 | 201.9 |
| D | 11 | 129 | 243569 | 1202.9 | 725 | 695 | 201.9 |
| D | 2 | 249 | 161473 | 796.3 | 725 | 695 | 201.9 |
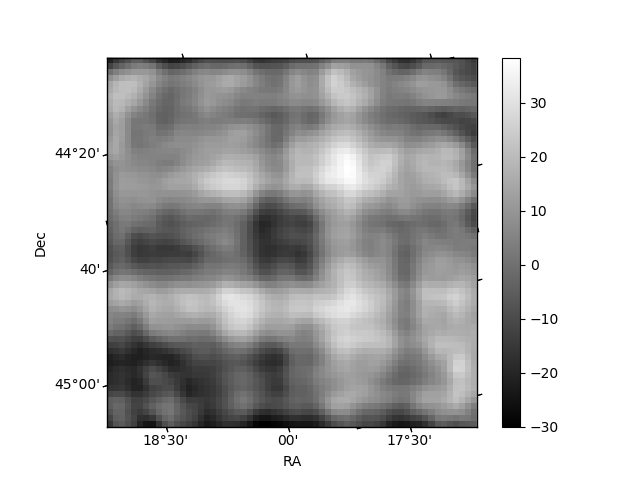
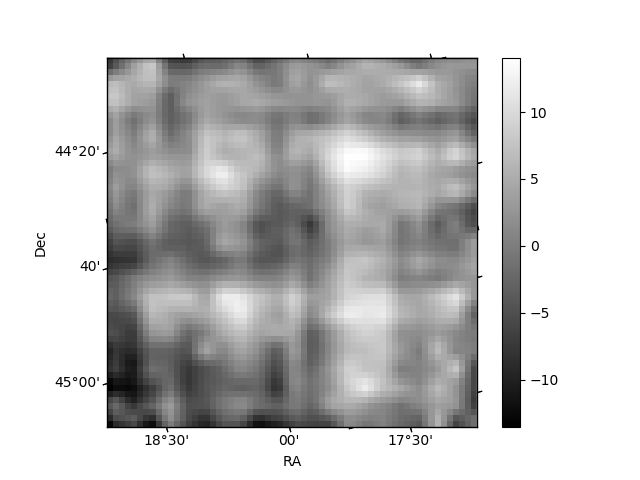
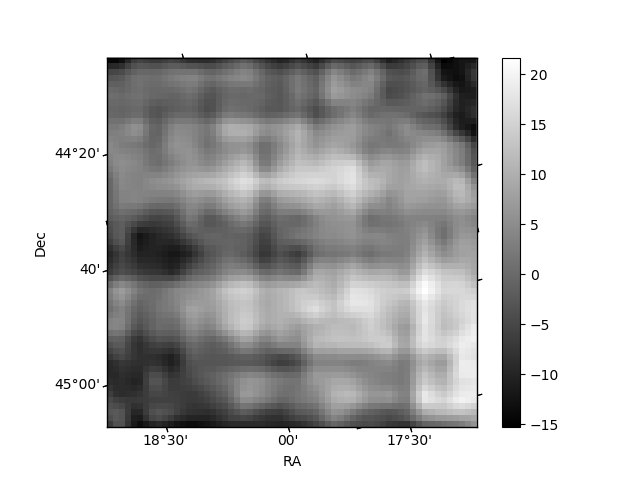
Histogram calculated using DETX and DETY for each event in the final _common_clean file
| Quadrant A | 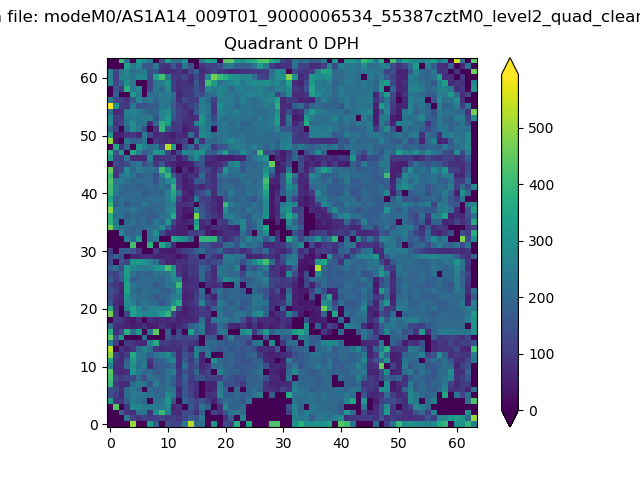 |
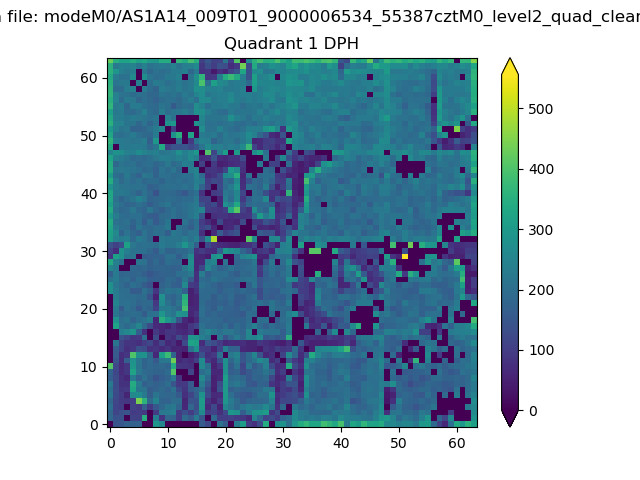 |
Quadrant B |
|---|---|---|---|
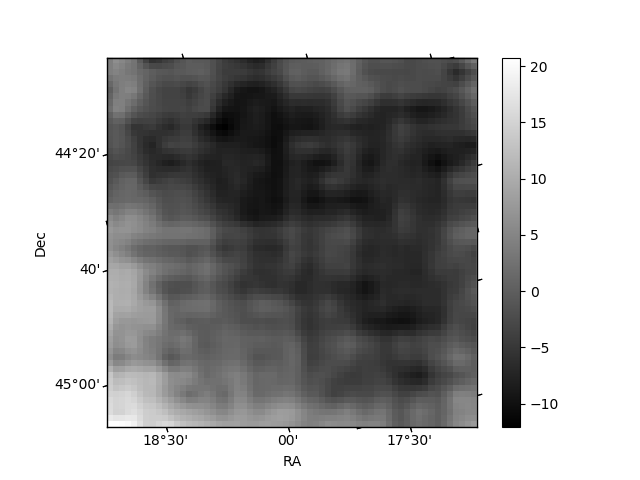
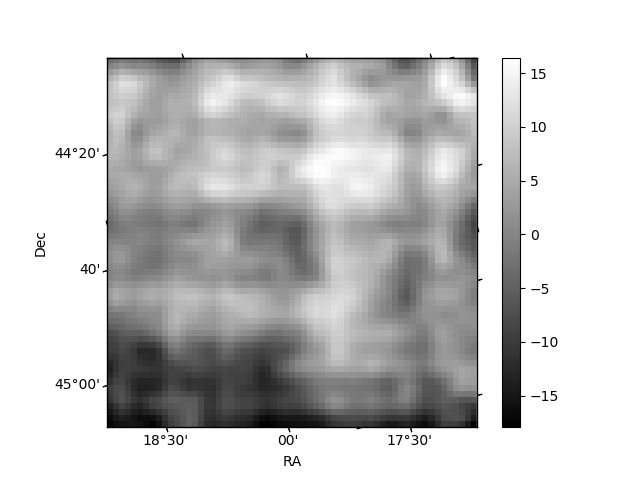
| Quadrant D | 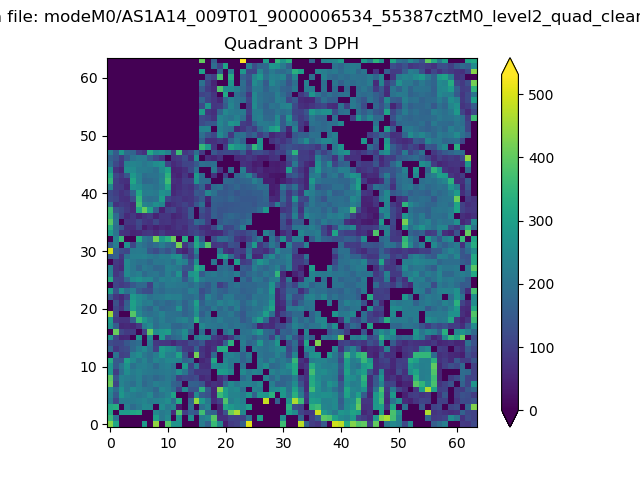 |
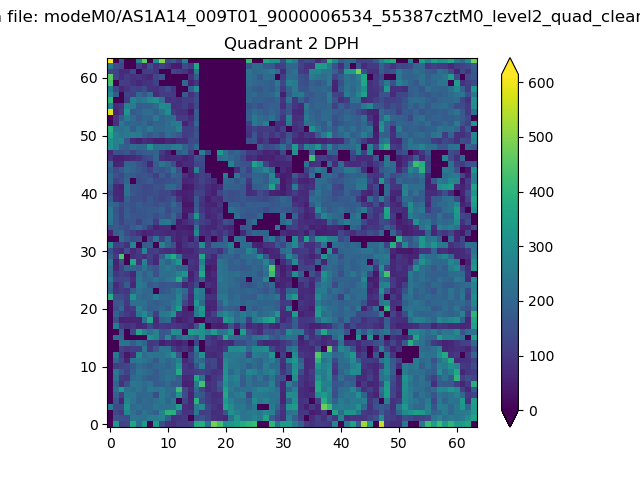 |
Quadrant C |
| Plot type | Count rate plots | Images |
|---|---|---|
| Comparison with Poisson distribution Blue bars denote a histogram of data divided into 1 sec bins. Red curve is a Poisson curve with rate = median count rate of data. |
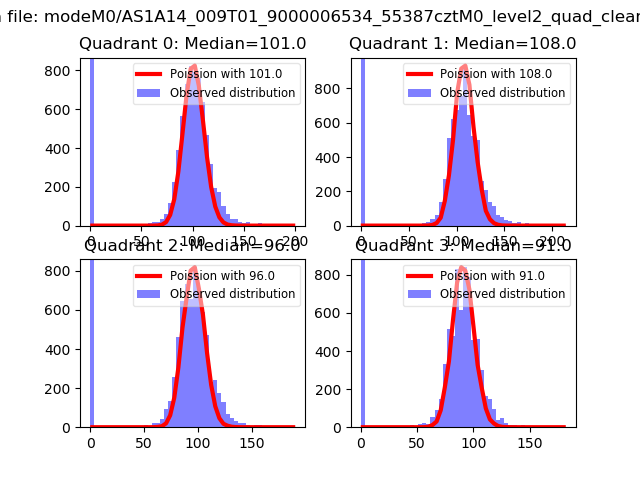 |
 |
| Quadrant-wise count rates Data is divided into 100 sec bins |
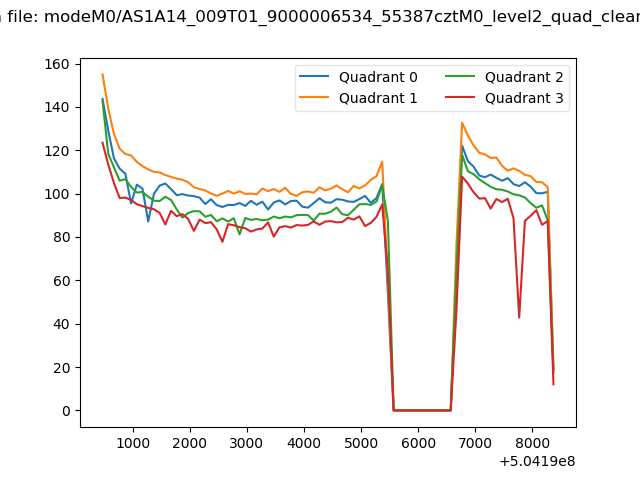 |
|
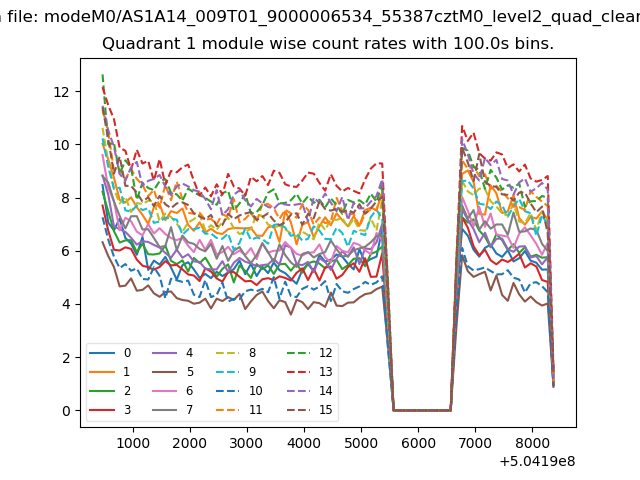
| Module-wise count rates for Quadrant A Data is divided into 100 sec bins |
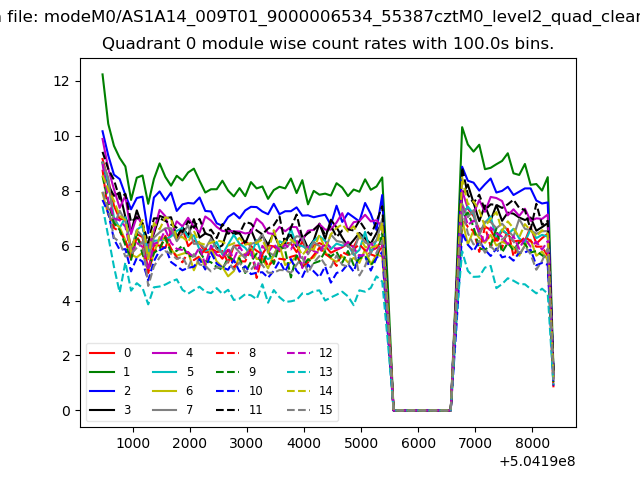 |
 |
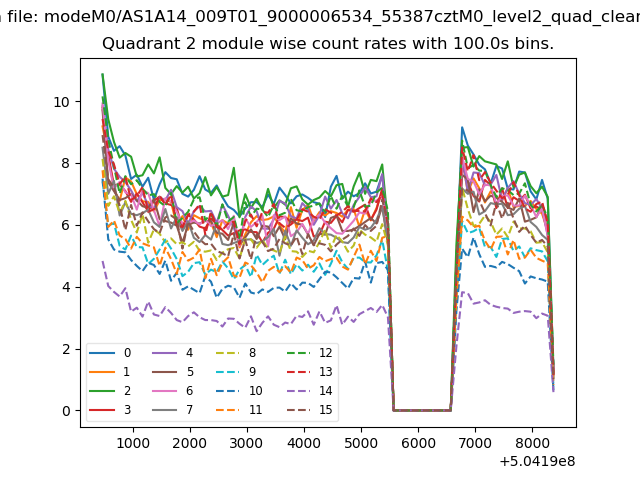
| Module-wise count rates for Quadrant B Data is divided into 100 sec bins |
 |
 |
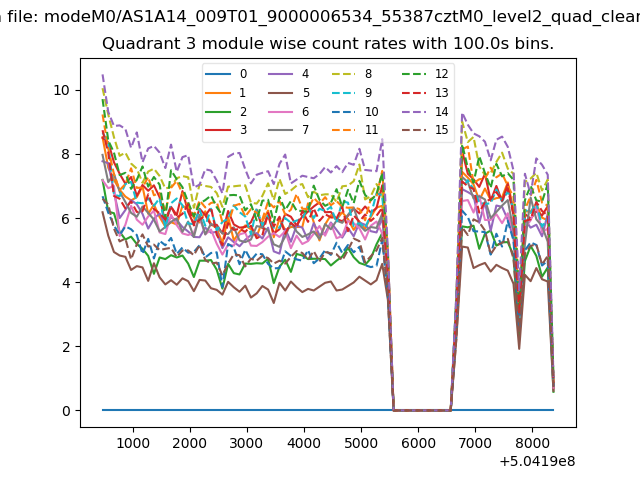
| Module-wise count rates for Quadrant C Data is divided into 100 sec bins |
 |
 |
| Module-wise count rates for Quadrant D Data is divided into 100 sec bins |
 |
 |
| Parameter | Plot |
|---|---|
| CZT HV Monitor | 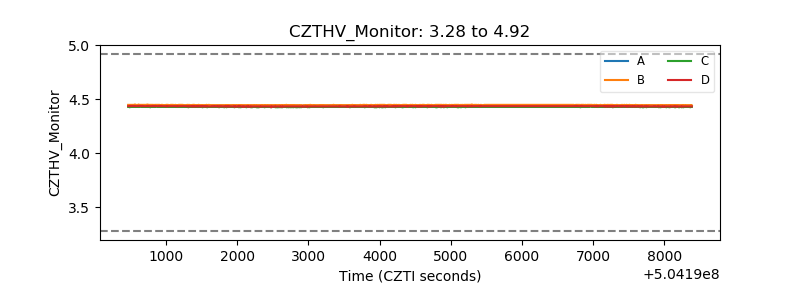 |
| D_VDD | 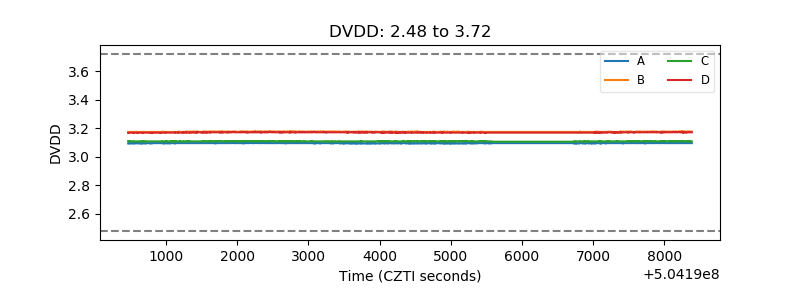 |
| Temperature 1 | 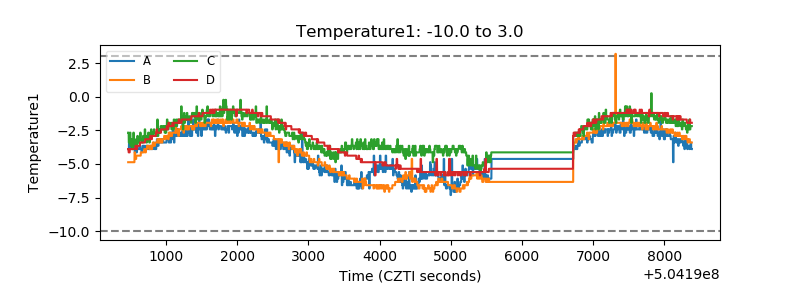 |
| Veto HV Monitor | 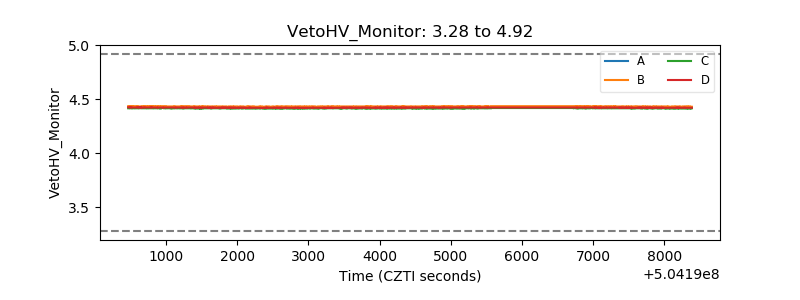 |
| Veto LLD | 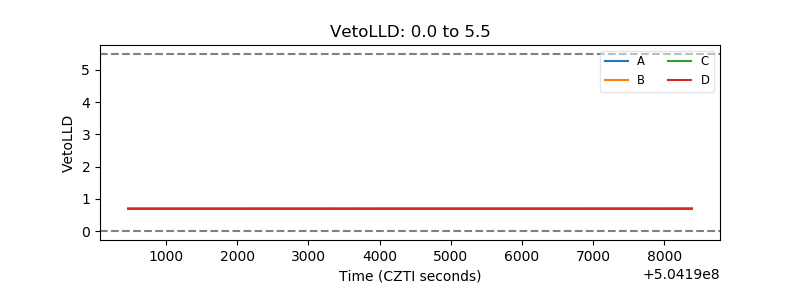 |
| Alpha Counter | 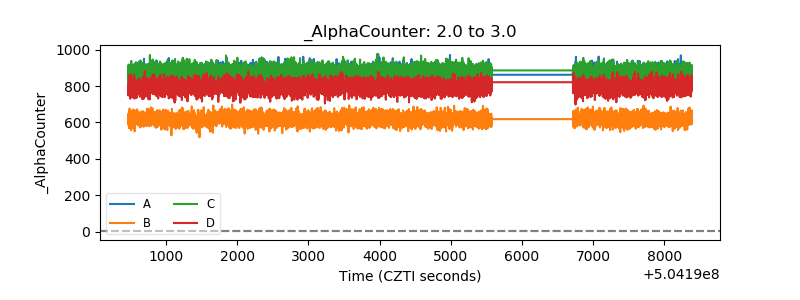 |
| _CPM_Rate | 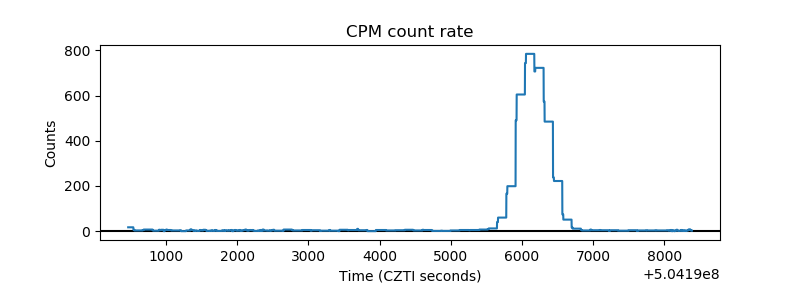 |
| CZT Counter | 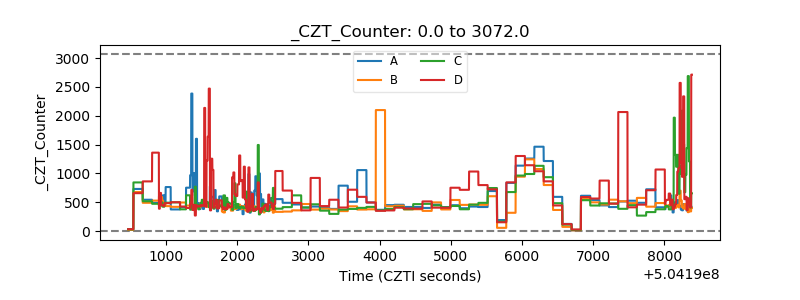 |
| +2.5 Volts monitor | 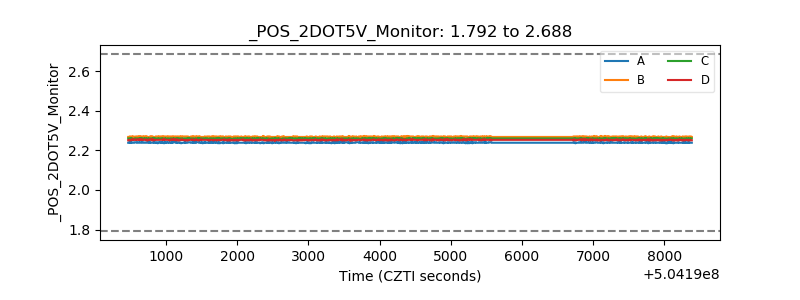 |
| +5 Volts monitor | 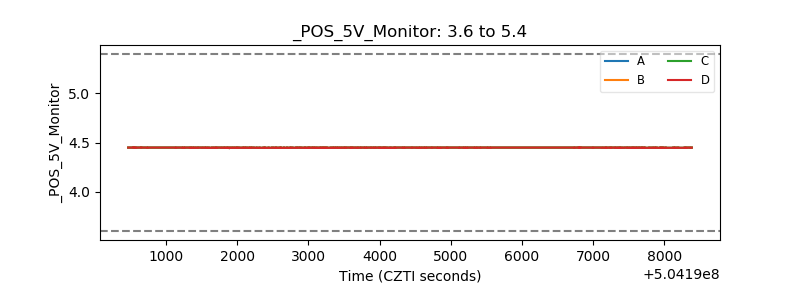 |
| _ROLL_ROT | 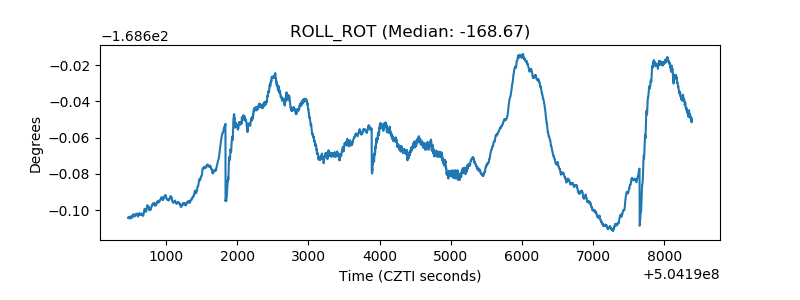 |
| _Roll_DEC | 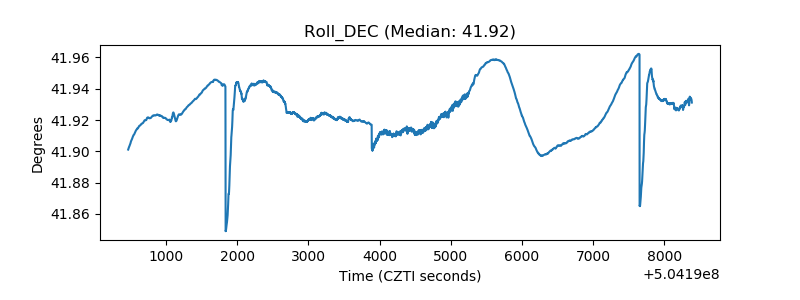 |
| _Roll_RA | 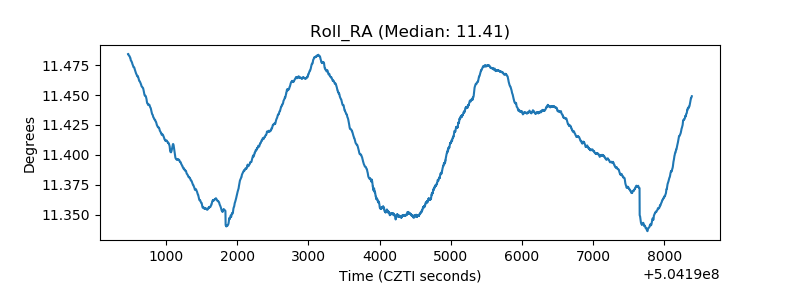 |
| Veto Counter | 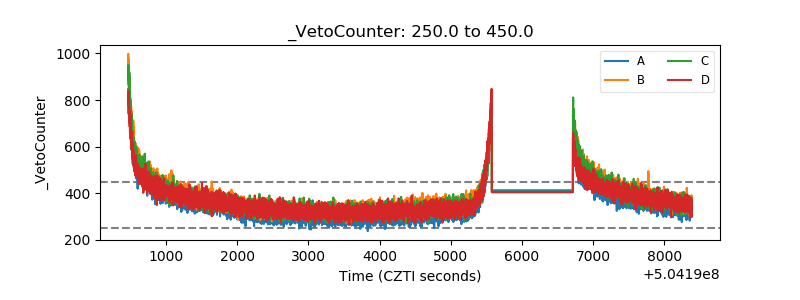 |