| Param | Original file | Final file |
|---|---|---|
| Filename | modeM0/AS1A14_009T01_9000006534_55388cztM0_level2.fits | modeM0/AS1A14_009T01_9000006534_55388cztM0_level2_quad_clean.evt |
| Size (bytes) | 1,032,765,120 | 236,661,120 |
| Size | 984.9 MB | 225.7 MB |
| Events in quadrant A | 11,255,057 | 1,482,680 |
| Events in quadrant B | 7,631,426 | 1,677,197 |
| Events in quadrant C | 7,832,564 | 1,504,097 |
| Events in quadrant D | 10,255,337 | 1,384,244 |
| Mode SS | |||
|---|---|---|---|
| Quadrant | BADHDUFLAG | Total packets | Discarded packets |
| A | 0 | 332 | 0 |
| B | 0 | 332 | 0 |
| C | 0 | 332 | 0 |
| D | 0 | 332 | 0 |
| Mode M0 | |||
|---|---|---|---|
| Quadrant | BADHDUFLAG | Total packets | Discarded packets |
| A | 0 | 44883 | 4 |
| B | 0 | 34741 | 3 |
| C | 0 | 35445 | 3 |
| D | 0 | 41937 | 3 |
| Mode M9 | |||
|---|---|---|---|
| Quadrant | BADHDUFLAG | Total packets | Discarded packets |
| A | 0 | 33 | 0 |
| B | 0 | 33 | 0 |
| C | 0 | 33 | 0 |
| D | 0 | 33 | 0 |
| Quadrant | Total seconds | Saturated seconds | Saturation percentage |
|---|---|---|---|
| A | 16196 | 1185 | 7.316621% |
| B | 16197 | 323 | 1.994196% |
| C | 16197 | 254 | 1.568192% |
| D | 16197 | 714 | 4.408224% |
Noise dominated data is calculated using 1-second bins in cleaned event files. If a bin has >2000 counts, and if more than 50% of those come from <1% of pixels, then it is considered to be noise-dominated and hence unusable.
| Quadrant | # 1 sec bins | Bins with >0 counts | Bins with >2000 counts | High rate bins dominated by noise | Noise dominated (total time) | Noise dominated (detector-on time) | Marked lightcurve |
|---|---|---|---|---|---|---|---|
| A | 19566 | 16196 | 824 | 824 | 4.21% | 5.09% | 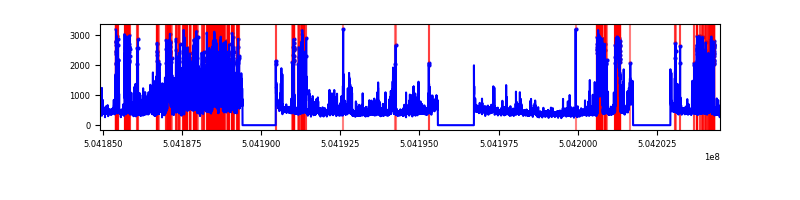 |
| B | 19567 | 16198 | 127 | 127 | 0.65% | 0.78% | 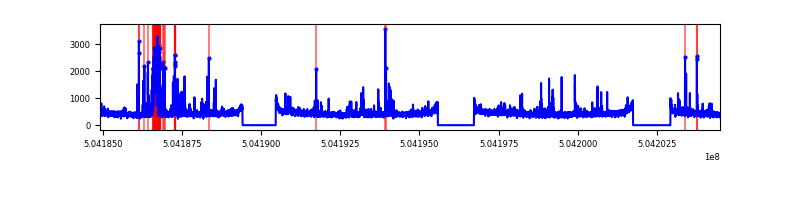 |
| C | 19567 | 16197 | 133 | 133 | 0.68% | 0.82% | 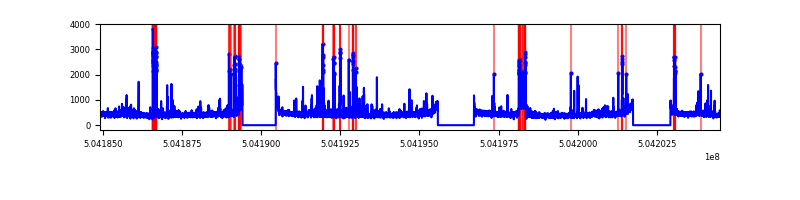 |
| D | 19567 | 16197 | 555 | 555 | 2.84% | 3.43% | 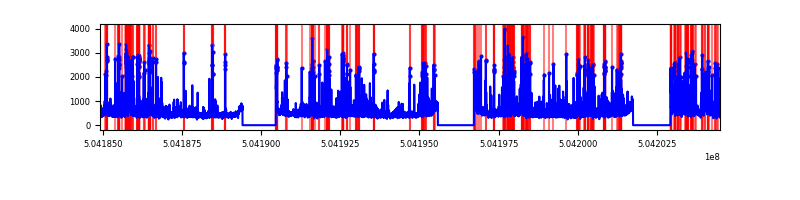 |
Top three noisy pixels from each quadrant. If the there are fewer than three noisy pixels in the level2.evt file, extra rows are filled as -1
| Pixel properties | Quadrant properties | ||||||
|---|---|---|---|---|---|---|---|
| Quadrant | DetID | PixID | Counts | Sigma | Mean | Median | Sigma |
| A | 4 | 159 | 2399553 | 5696.76 | 1709 | 1668 | 420.9 |
| A | 0 | 8 | 1145467 | 2717.37 | 1709 | 1668 | 420.9 |
| A | 6 | 162 | 895560 | 2123.66 | 1709 | 1668 | 420.9 |
| B | 5 | 185 | 490876 | 1333.79 | 1720 | 1656 | 366.8 |
| B | 10 | 247 | 150276 | 405.19 | 1720 | 1656 | 366.8 |
| B | 0 | 199 | 54205 | 143.27 | 1720 | 1656 | 366.8 |
| C | 13 | 3 | 750825 | 1604.38 | 1700 | 1682 | 466.9 |
| C | 9 | 38 | 183903 | 390.25 | 1700 | 1682 | 466.9 |
| C | 14 | 254 | 137470 | 290.81 | 1700 | 1682 | 466.9 |
| D | 8 | 160 | 1237363 | 2626.42 | 1681 | 1611 | 470.5 |
| D | 11 | 129 | 921496 | 1955.09 | 1681 | 1611 | 470.5 |
| D | 3 | 12 | 474859 | 1005.82 | 1681 | 1611 | 470.5 |
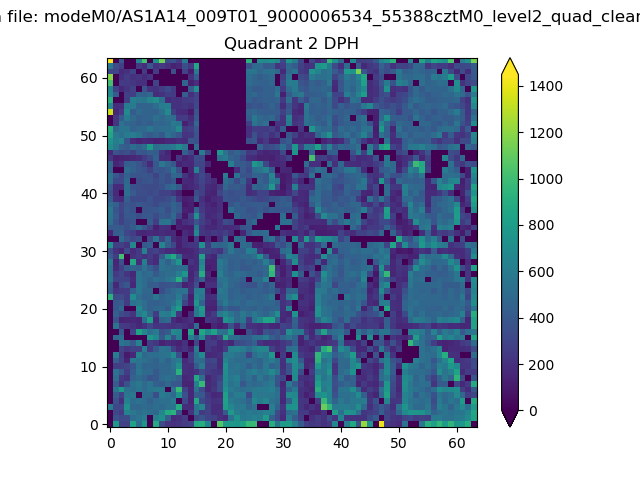
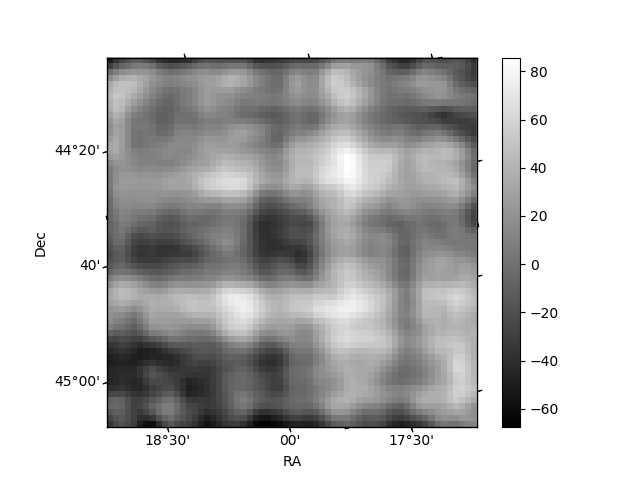
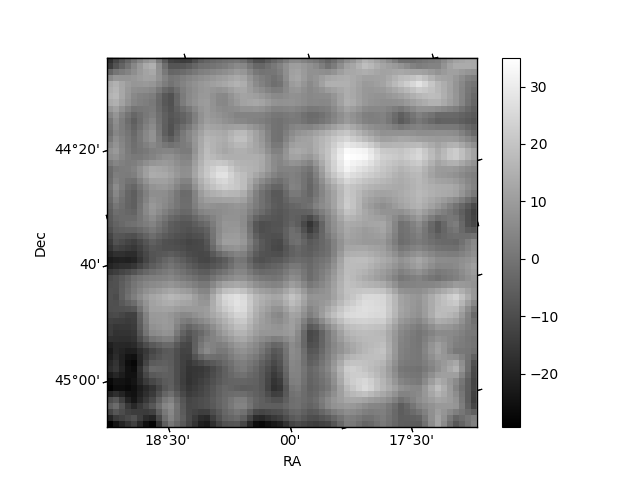
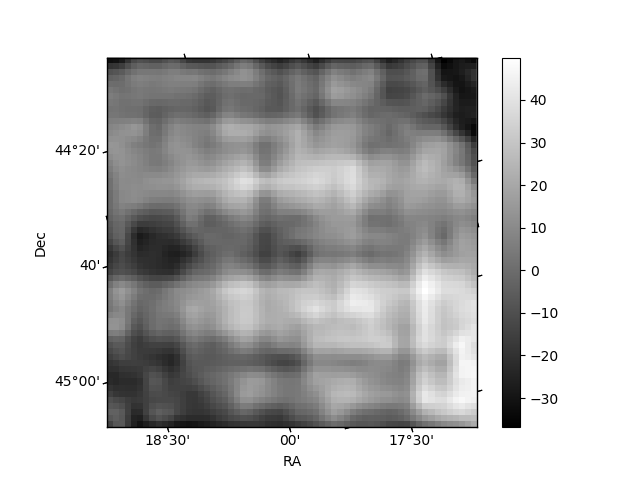
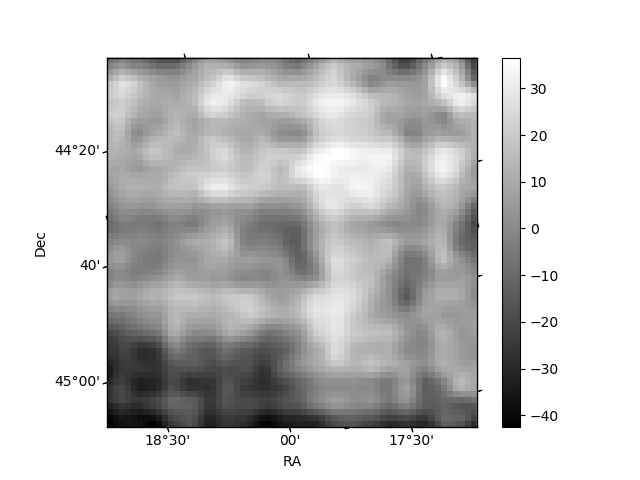
Histogram calculated using DETX and DETY for each event in the final _common_clean file
| Quadrant A | 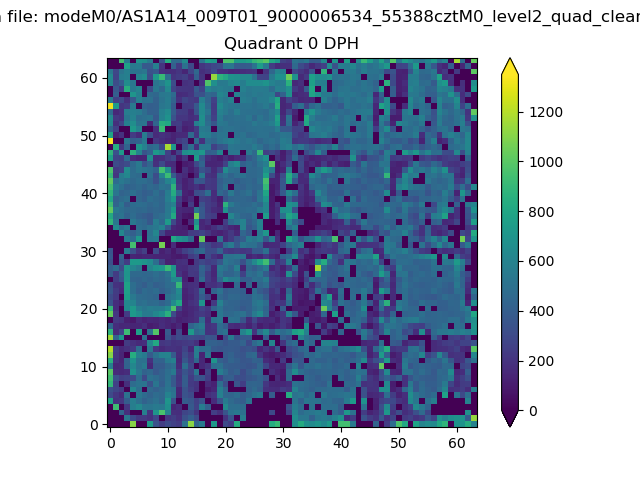 |
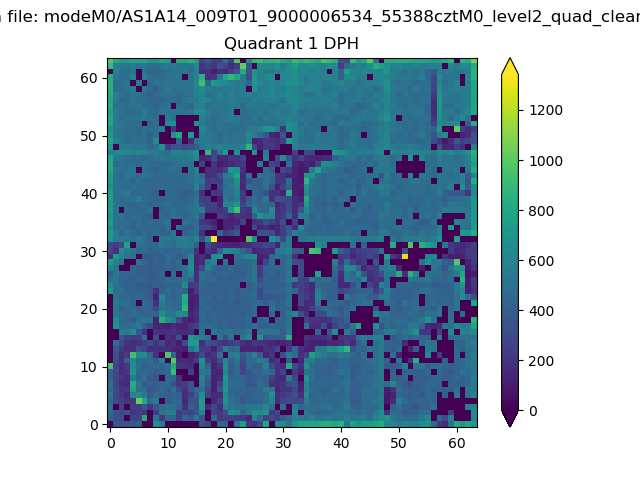 |
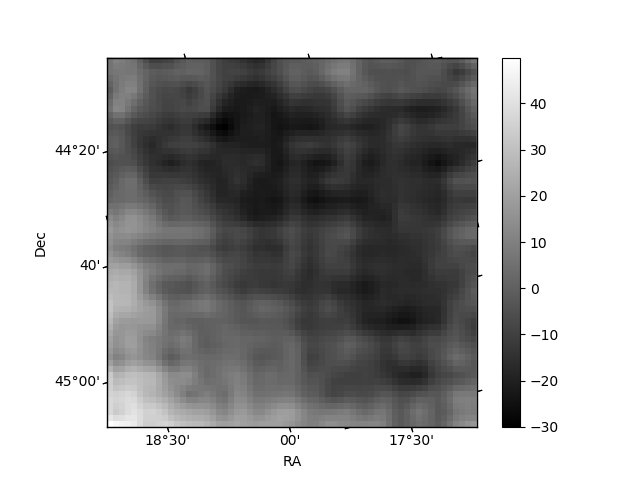
Quadrant B |
|---|---|---|---|
| Quadrant D | 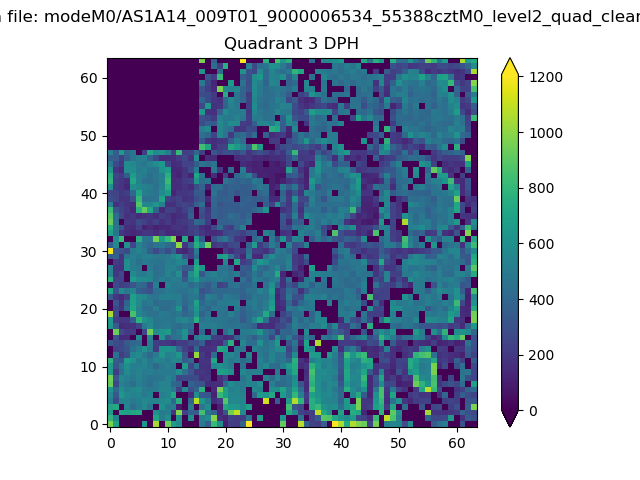 |
 |
Quadrant C |
| Plot type | Count rate plots | Images |
|---|---|---|
| Comparison with Poisson distribution Blue bars denote a histogram of data divided into 1 sec bins. Red curve is a Poisson curve with rate = median count rate of data. |
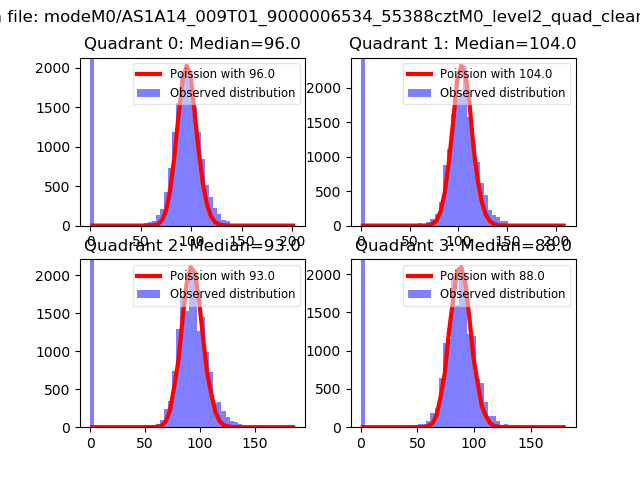 |
 |
| Quadrant-wise count rates Data is divided into 100 sec bins |
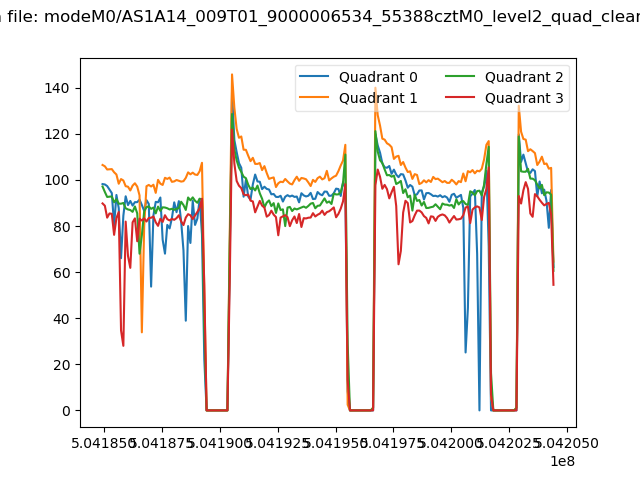 |
|
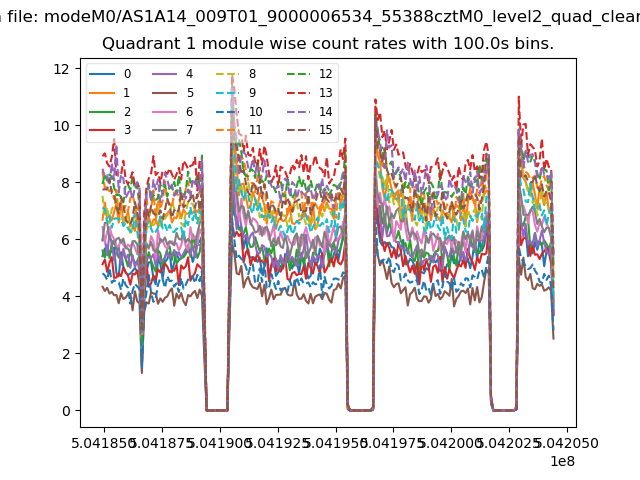
| Module-wise count rates for Quadrant A Data is divided into 100 sec bins |
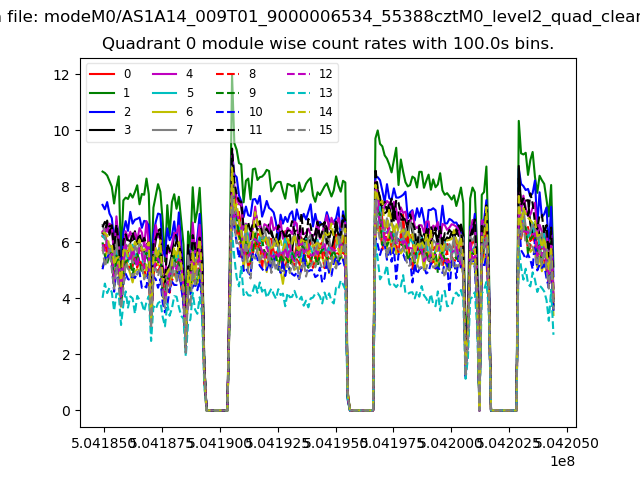 |
 |
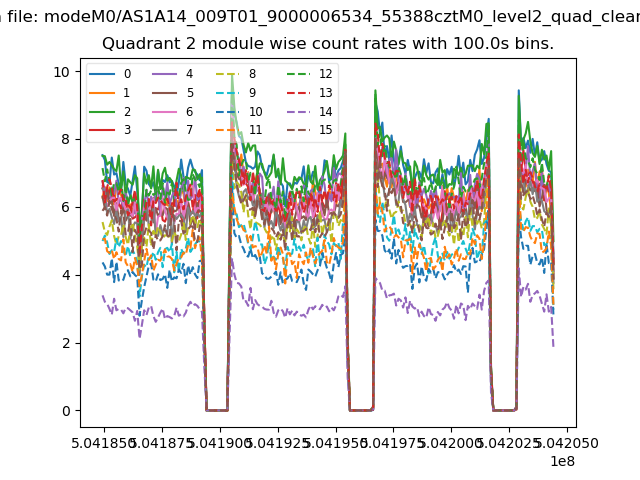
| Module-wise count rates for Quadrant B Data is divided into 100 sec bins |
 |
 |
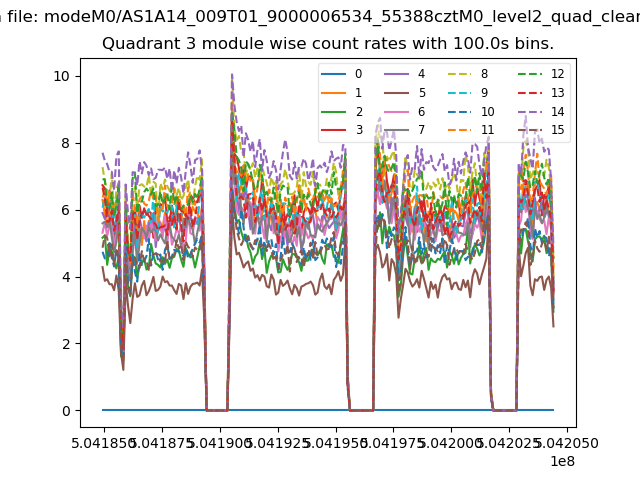
| Module-wise count rates for Quadrant C Data is divided into 100 sec bins |
 |
 |
| Module-wise count rates for Quadrant D Data is divided into 100 sec bins |
 |
 |
| Parameter | Plot |
|---|---|
| CZT HV Monitor | 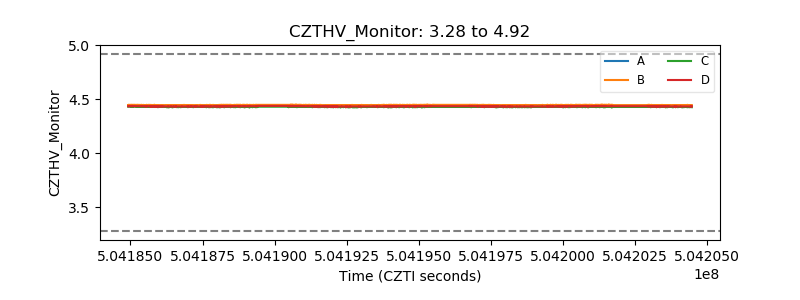 |
| D_VDD | 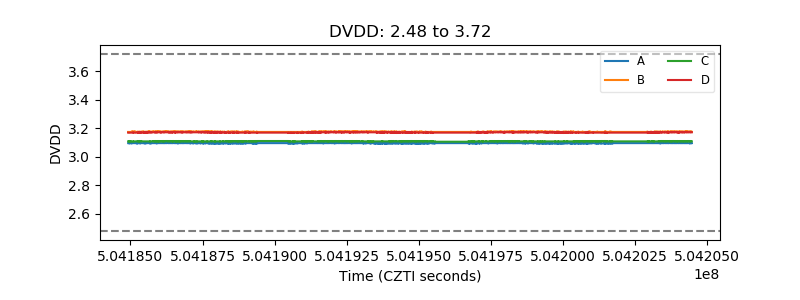 |
| Temperature 1 | 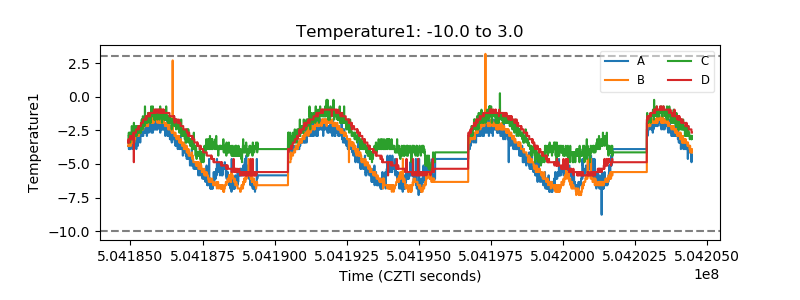 |
| Veto HV Monitor | 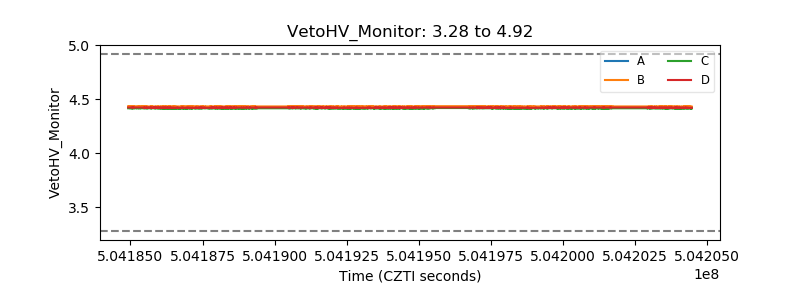 |
| Veto LLD | 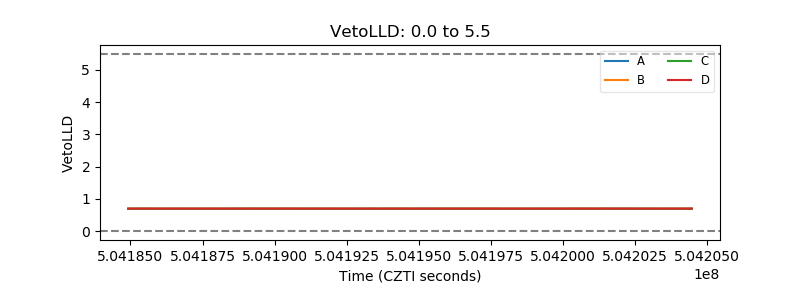 |
| Alpha Counter | 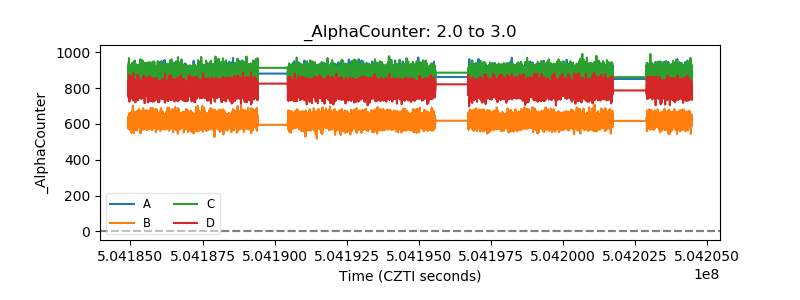 |
| _CPM_Rate | 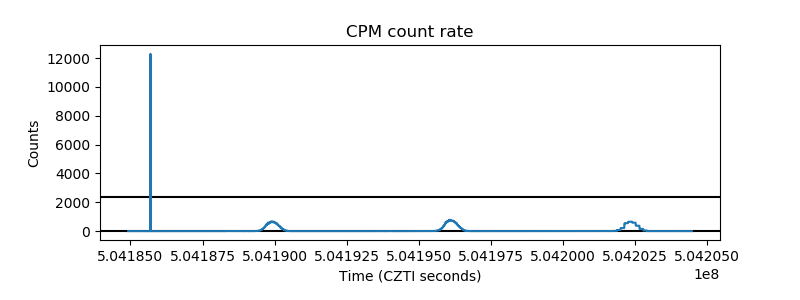 |
| CZT Counter | 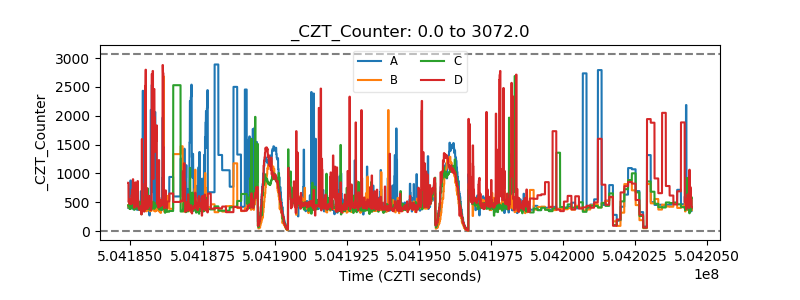 |
| +2.5 Volts monitor | 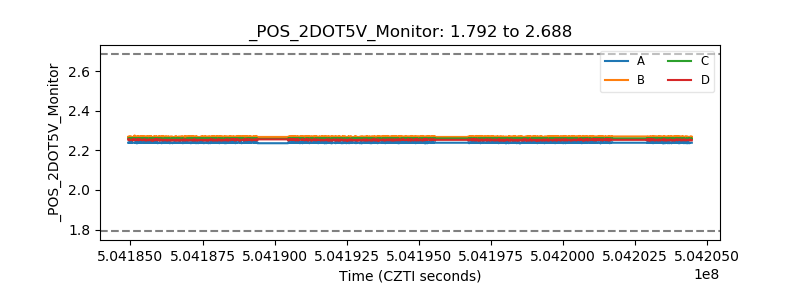 |
| +5 Volts monitor | 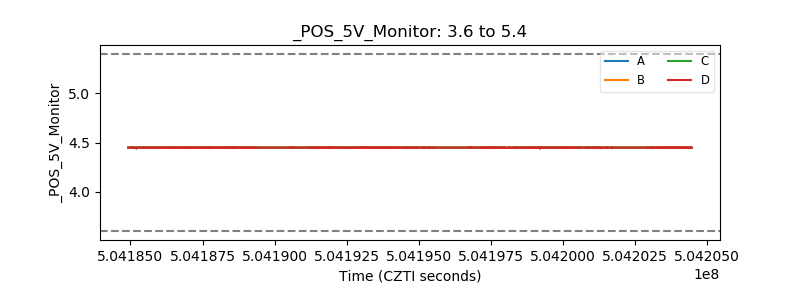 |
| _ROLL_ROT | 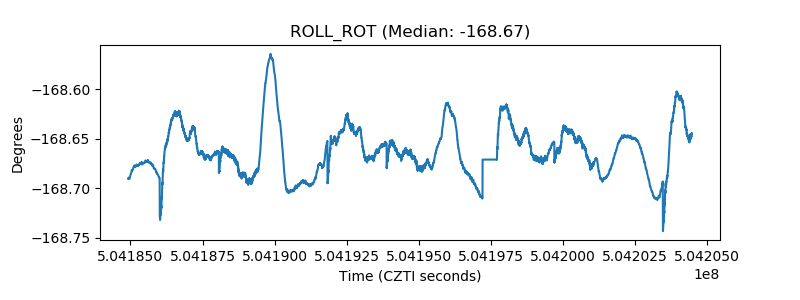 |
| _Roll_DEC | 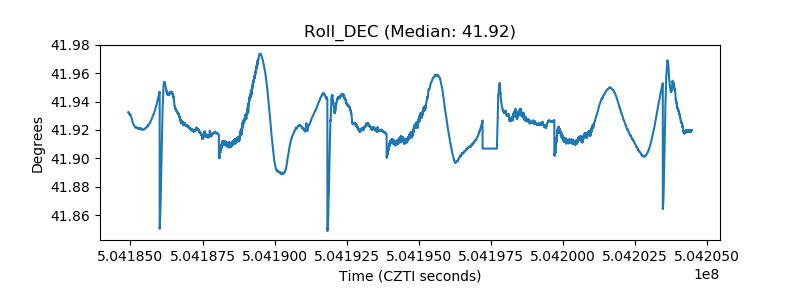 |
| _Roll_RA | 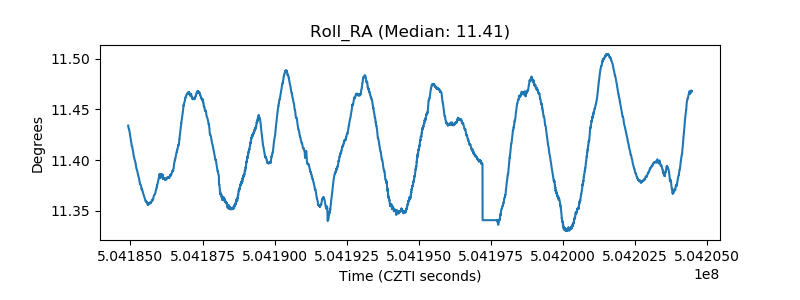 |
| Veto Counter | 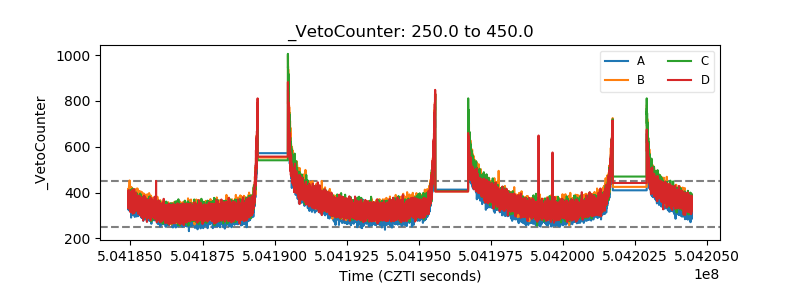 |