| Param | Original file | Final file |
|---|---|---|
| Filename | modeM0/AS1A14_009T01_9000006534_55391cztM0_level2.fits | modeM0/AS1A14_009T01_9000006534_55391cztM0_level2_quad_clean.evt |
| Size (bytes) | 432,993,600 | 108,374,400 |
| Size | 412.9 MB | 103.4 MB |
| Events in quadrant A | 3,668,269 | 706,282 |
| Events in quadrant B | 3,398,473 | 758,573 |
| Events in quadrant C | 3,557,426 | 678,344 |
| Events in quadrant D | 4,829,309 | 624,856 |
| Mode SS | |||
|---|---|---|---|
| Quadrant | BADHDUFLAG | Total packets | Discarded packets |
| A | 0 | 150 | 0 |
| B | 0 | 150 | 0 |
| C | 0 | 150 | 0 |
| D | 0 | 150 | 0 |
| Mode M0 | |||
|---|---|---|---|
| Quadrant | BADHDUFLAG | Total packets | Discarded packets |
| A | 0 | 16443 | 2 |
| B | 0 | 15770 | 2 |
| C | 0 | 16021 | 2 |
| D | 0 | 19797 | 2 |
| Mode M9 | |||
|---|---|---|---|
| Quadrant | BADHDUFLAG | Total packets | Discarded packets |
| A | 0 | 15 | 0 |
| B | 0 | 15 | 0 |
| C | 0 | 15 | 0 |
| D | 0 | 15 | 0 |
| Quadrant | Total seconds | Saturated seconds | Saturation percentage |
|---|---|---|---|
| A | 7385 | 105 | 1.421801% |
| B | 7386 | 91 | 1.232061% |
| C | 7386 | 54 | 0.731113% |
| D | 7386 | 336 | 4.549147% |
Noise dominated data is calculated using 1-second bins in cleaned event files. If a bin has >2000 counts, and if more than 50% of those come from <1% of pixels, then it is considered to be noise-dominated and hence unusable.
| Quadrant | # 1 sec bins | Bins with >0 counts | Bins with >2000 counts | High rate bins dominated by noise | Noise dominated (total time) | Noise dominated (detector-on time) | Marked lightcurve |
|---|---|---|---|---|---|---|---|
| A | 8795 | 7387 | 59 | 59 | 0.67% | 0.80% | 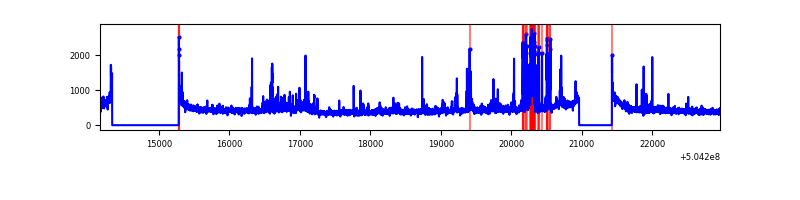 |
| B | 8796 | 7388 | 23 | 23 | 0.26% | 0.31% | 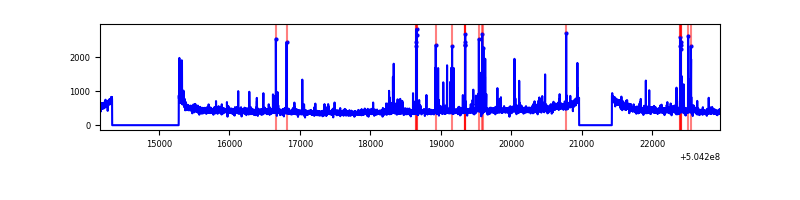 |
| C | 8796 | 7388 | 31 | 31 | 0.35% | 0.42% | 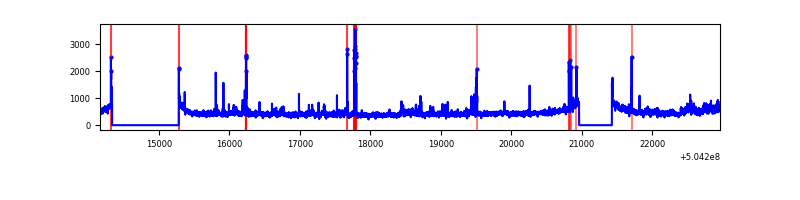 |
| D | 8795 | 7387 | 290 | 290 | 3.30% | 3.93% | 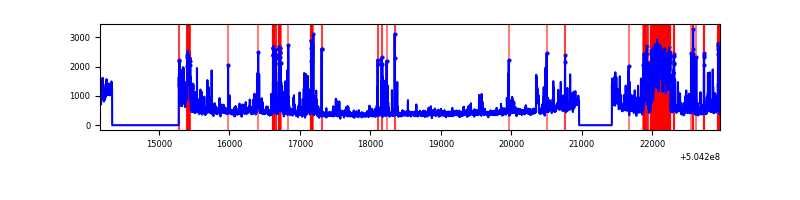 |
Top three noisy pixels from each quadrant. If the there are fewer than three noisy pixels in the level2.evt file, extra rows are filled as -1
| Pixel properties | Quadrant properties | ||||||
|---|---|---|---|---|---|---|---|
| Quadrant | DetID | PixID | Counts | Sigma | Mean | Median | Sigma |
| A | 0 | 8 | 270699 | 1370.36 | 795 | 773 | 197.0 |
| A | 4 | 159 | 165413 | 835.84 | 795 | 773 | 197.0 |
| A | 4 | 3 | 34611 | 171.79 | 795 | 773 | 197.0 |
| B | 10 | 247 | 118748 | 704.59 | 788 | 760 | 167.5 |
| B | 5 | 185 | 60297 | 355.54 | 788 | 760 | 167.5 |
| B | 0 | 199 | 37518 | 219.51 | 788 | 760 | 167.5 |
| C | 9 | 38 | 300418 | 1388.76 | 784 | 775 | 215.8 |
| C | 12 | 249 | 109707 | 504.87 | 784 | 775 | 215.8 |
| C | 12 | 250 | 48770 | 222.44 | 784 | 775 | 215.8 |
| D | 11 | 129 | 1211387 | 5507.48 | 772 | 738 | 219.8 |
| D | 2 | 249 | 224478 | 1017.84 | 772 | 738 | 219.8 |
| D | 7 | 70 | 115201 | 520.71 | 772 | 738 | 219.8 |
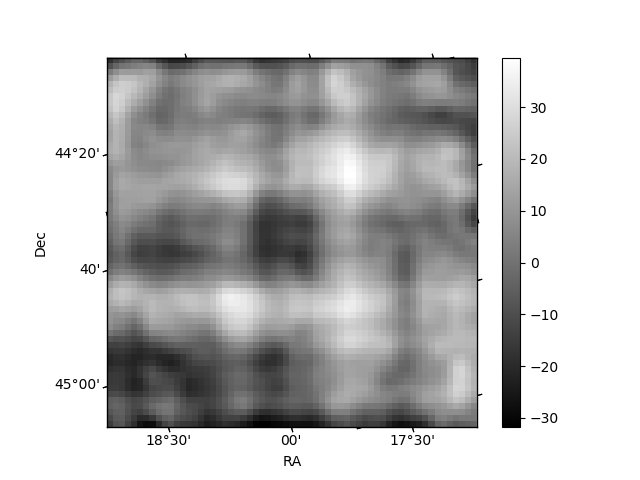
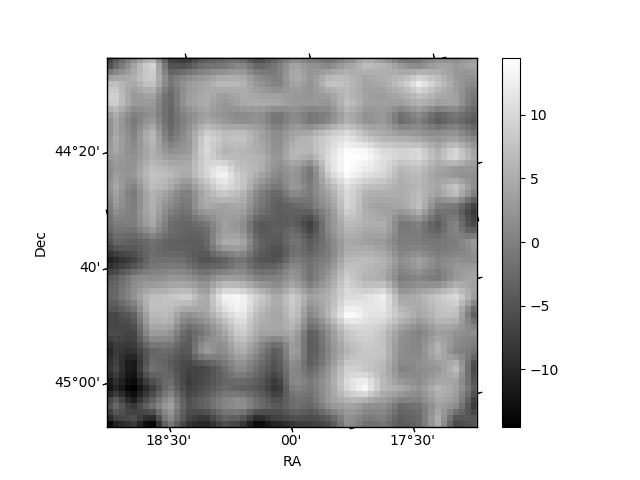
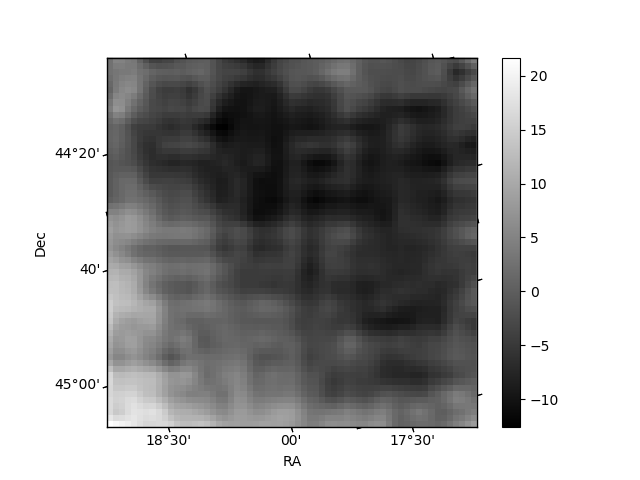
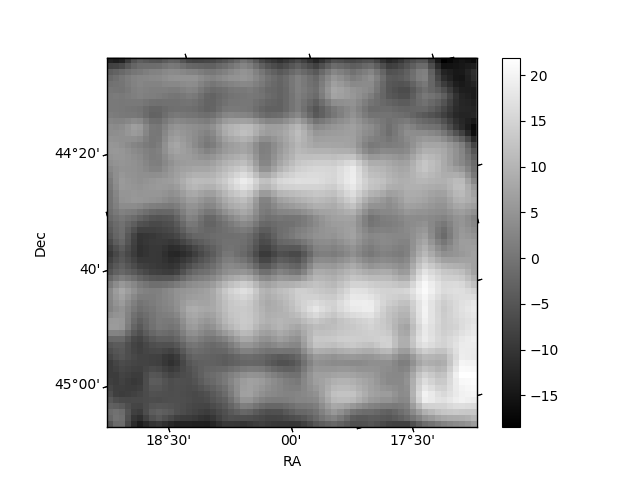
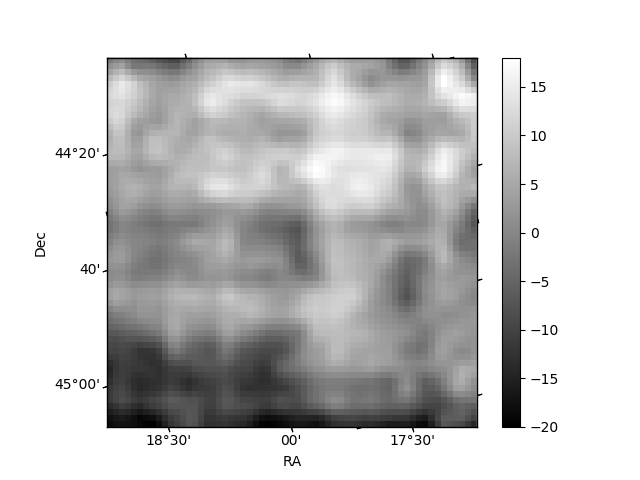
Histogram calculated using DETX and DETY for each event in the final _common_clean file
| Quadrant A | 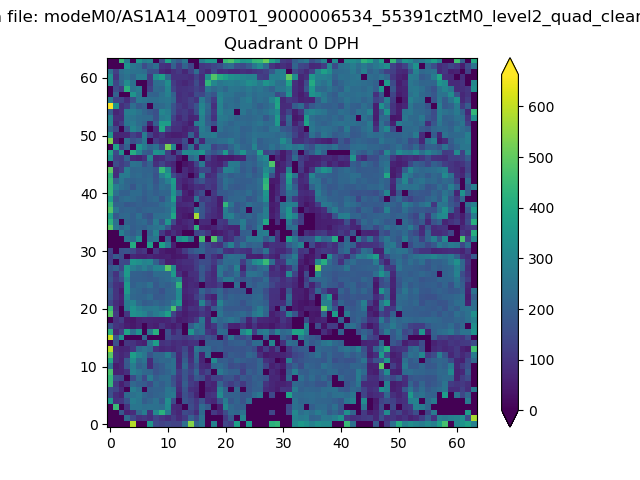 |
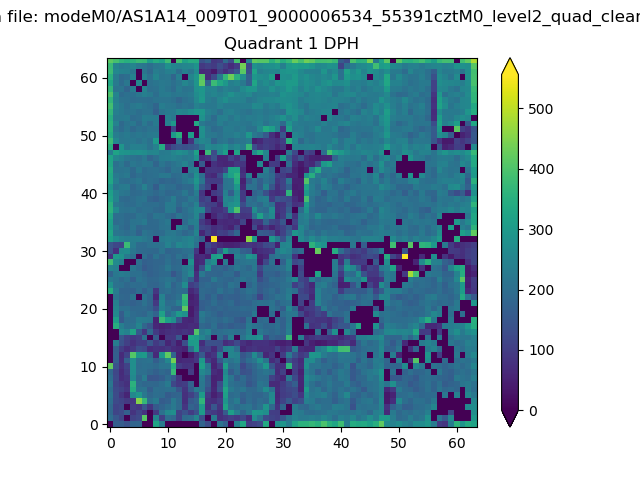 |
Quadrant B |
|---|---|---|---|
| Quadrant D | 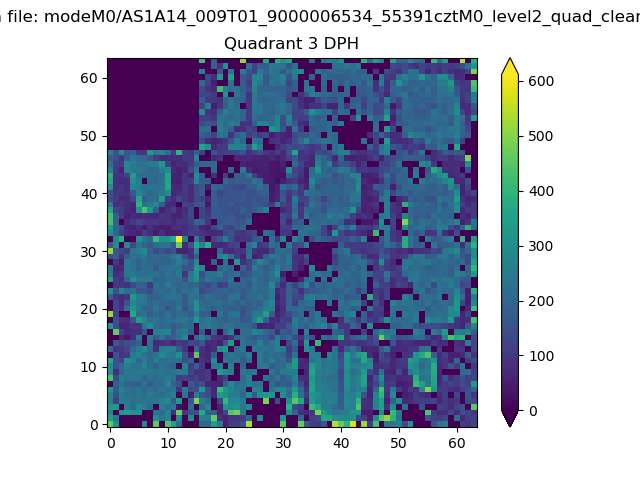 |
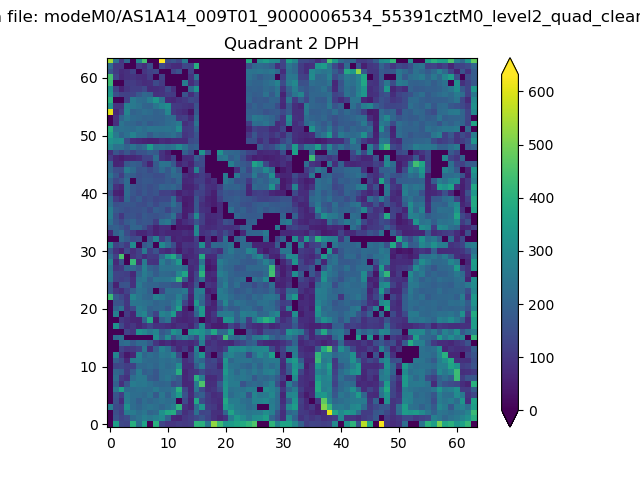 |
Quadrant C |
| Plot type | Count rate plots | Images |
|---|---|---|
| Comparison with Poisson distribution Blue bars denote a histogram of data divided into 1 sec bins. Red curve is a Poisson curve with rate = median count rate of data. |
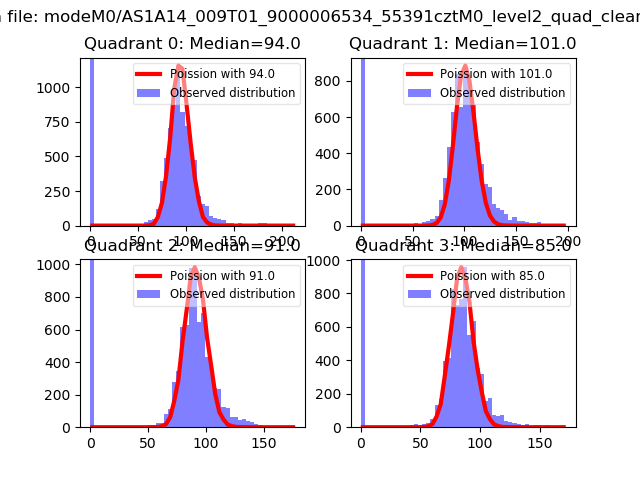 |
 |
| Quadrant-wise count rates Data is divided into 100 sec bins |
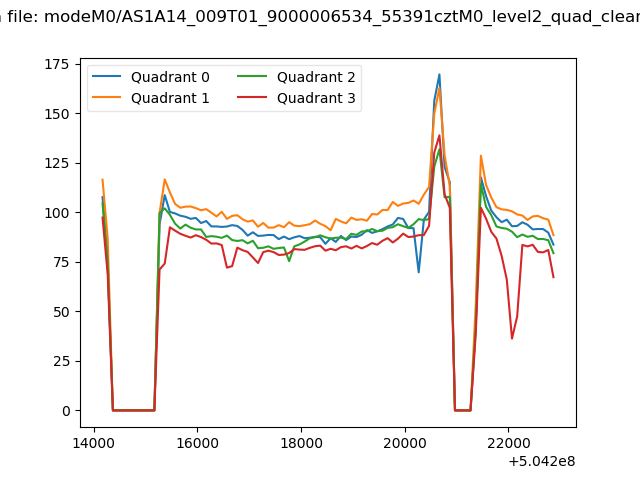 |
|
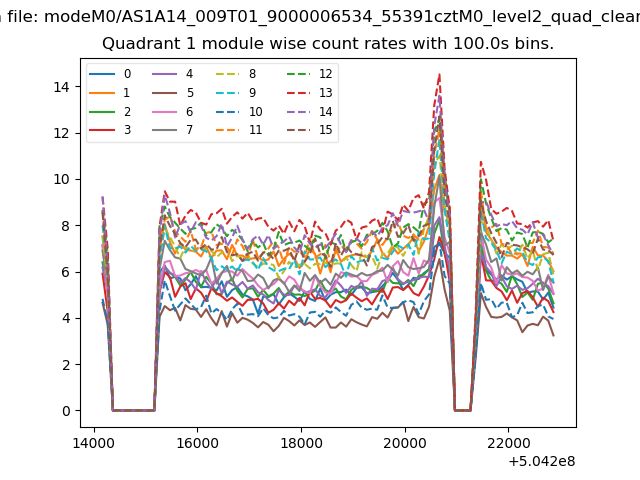
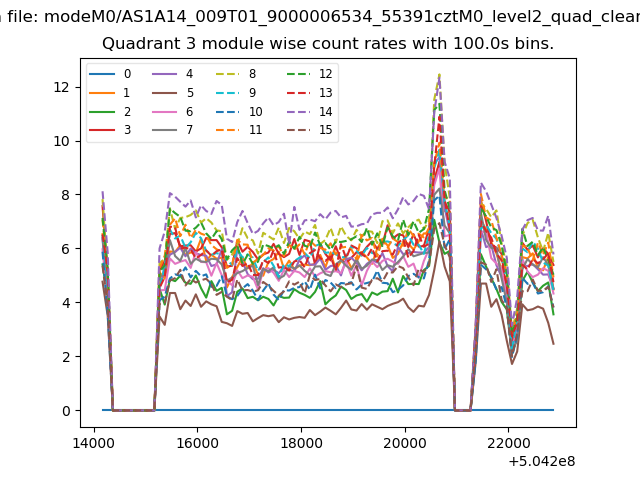
| Module-wise count rates for Quadrant A Data is divided into 100 sec bins |
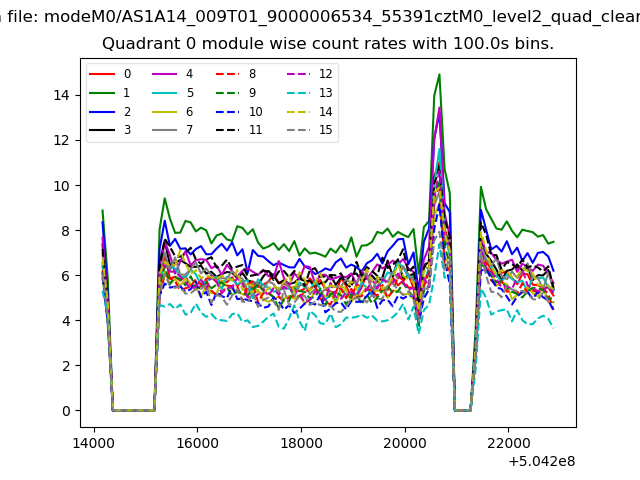 |
 |
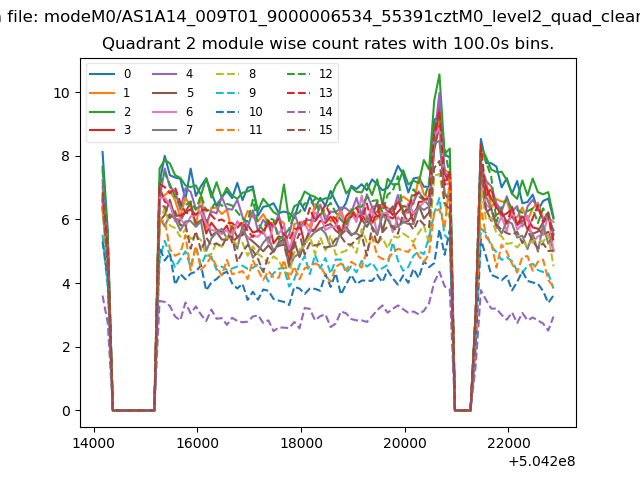
| Module-wise count rates for Quadrant B Data is divided into 100 sec bins |
 |
 |
| Module-wise count rates for Quadrant C Data is divided into 100 sec bins |
 |
 |
| Module-wise count rates for Quadrant D Data is divided into 100 sec bins |
 |
 |
| Parameter | Plot |
|---|---|
| CZT HV Monitor | 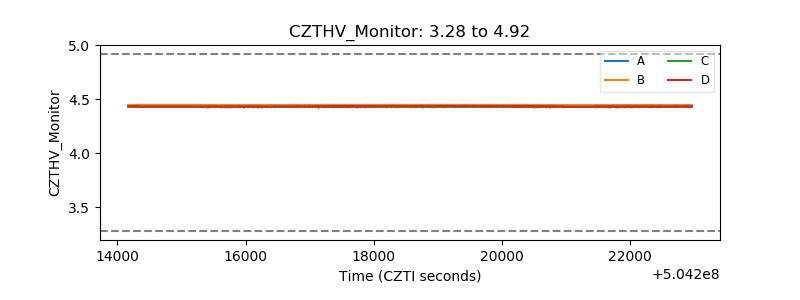 |
| D_VDD | 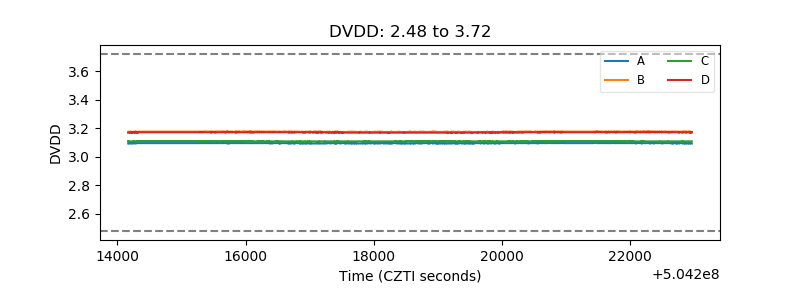 |
| Temperature 1 | 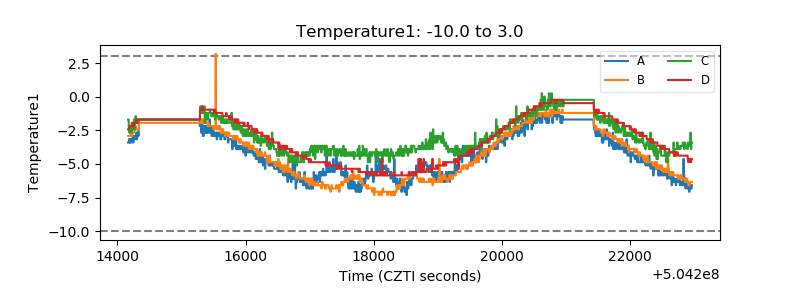 |
| Veto HV Monitor | 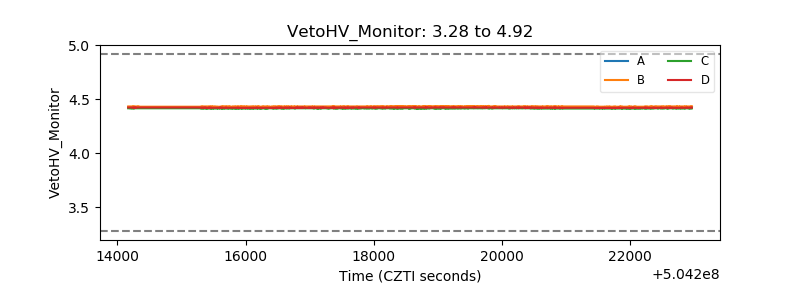 |
| Veto LLD | 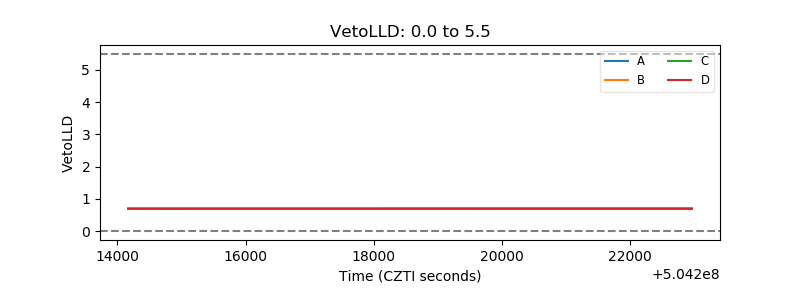 |
| Alpha Counter | 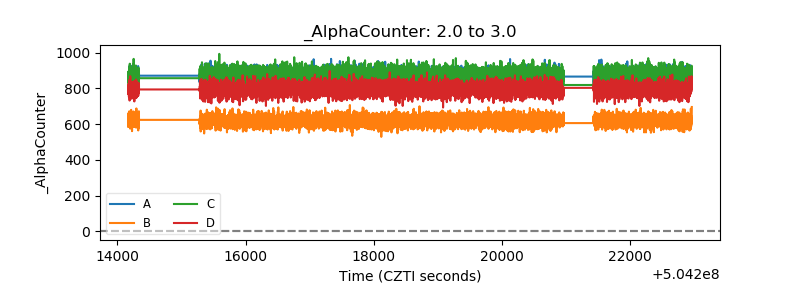 |
| _CPM_Rate | 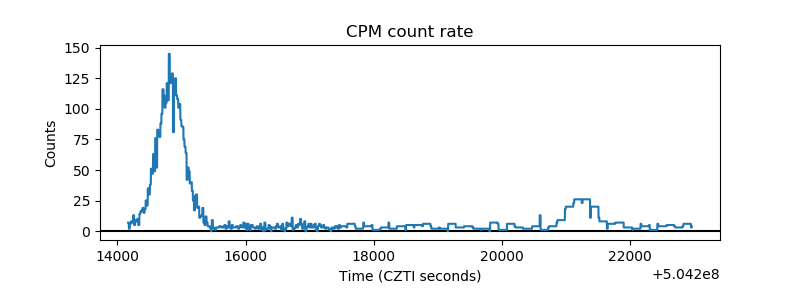 |
| CZT Counter | 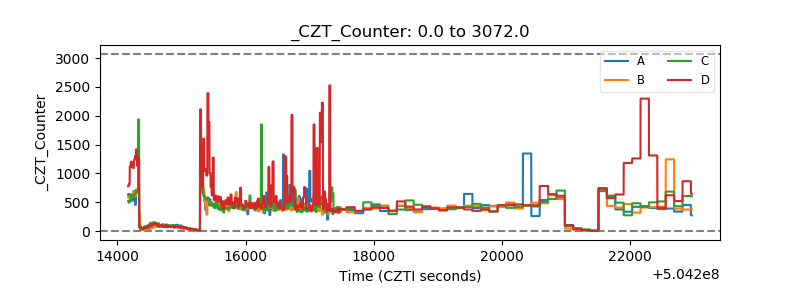 |
| +2.5 Volts monitor |  |
| +5 Volts monitor | 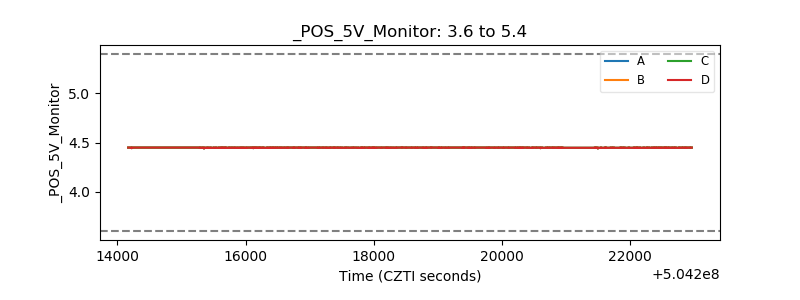 |
| _ROLL_ROT | 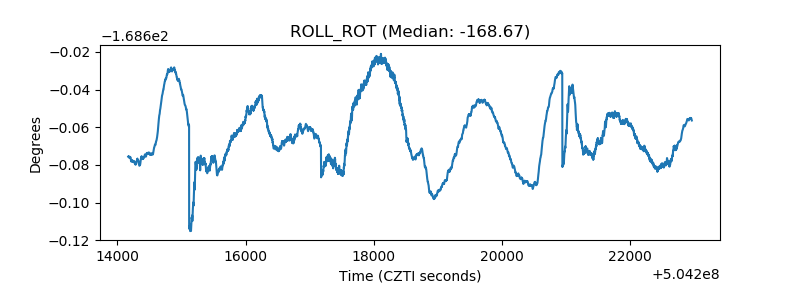 |
| _Roll_DEC | 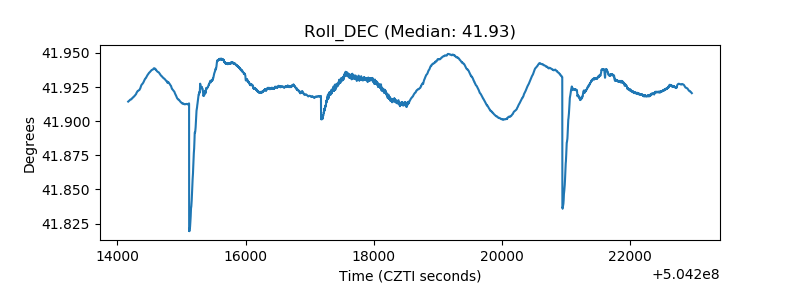 |
| _Roll_RA | 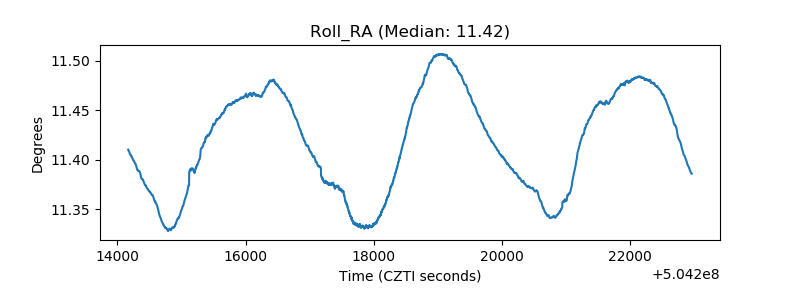 |
| Veto Counter | 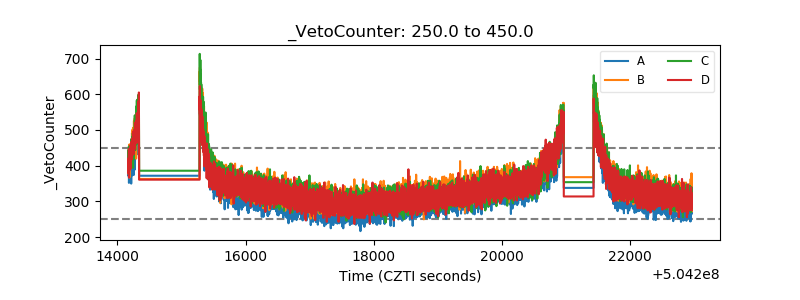 |