| Param | Original file | Final file |
|---|---|---|
| Filename | modeM0/AS1A14_099T01_9000006536_55397cztM0_level2.fits | modeM0/AS1A14_099T01_9000006536_55397cztM0_level2_quad_clean.evt |
| Size (bytes) | 800,856,000 | 133,565,760 |
| Size | 763.8 MB | 127.4 MB |
| Events in quadrant A | 5,858,244 | 891,833 |
| Events in quadrant B | 4,201,836 | 977,671 |
| Events in quadrant C | 7,343,856 | 839,846 |
| Events in quadrant D | 11,488,179 | 660,657 |
| Mode M9 | |||
|---|---|---|---|
| Quadrant | BADHDUFLAG | Total packets | Discarded packets |
| A | 0 | 12 | 0 |
| B | 0 | 12 | 0 |
| C | 0 | 12 | 0 |
| D | 0 | 12 | 0 |
| Mode SS | |||
|---|---|---|---|
| Quadrant | BADHDUFLAG | Total packets | Discarded packets |
| A | 0 | 200 | 0 |
| B | 0 | 200 | 0 |
| C | 0 | 200 | 0 |
| D | 0 | 200 | 0 |
| Mode M0 | |||
|---|---|---|---|
| Quadrant | BADHDUFLAG | Total packets | Discarded packets |
| A | 0 | 24621 | 2 |
| B | 0 | 19954 | 2 |
| C | 0 | 29055 | 2 |
| D | 0 | 40826 | 9 |
| Quadrant | Total seconds | Saturated seconds | Saturation percentage |
|---|---|---|---|
| A | 9714 | 541 | 5.569281% |
| B | 9715 | 153 | 1.574884% |
| C | 9715 | 627 | 6.453937% |
| D | 9714 | 2140 | 22.030060% |
Noise dominated data is calculated using 1-second bins in cleaned event files. If a bin has >2000 counts, and if more than 50% of those come from <1% of pixels, then it is considered to be noise-dominated and hence unusable.
| Quadrant | # 1 sec bins | Bins with >0 counts | Bins with >2000 counts | High rate bins dominated by noise | Noise dominated (total time) | Noise dominated (detector-on time) | Marked lightcurve |
|---|---|---|---|---|---|---|---|
| A | 10998 | 9714 | 366 | 366 | 3.33% | 3.77% | 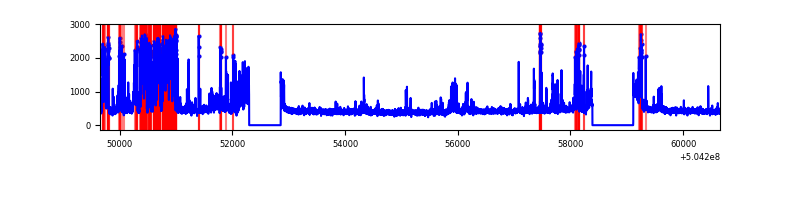 |
| B | 10999 | 9715 | 7 | 7 | 0.06% | 0.07% |  |
| C | 10999 | 9715 | 664 | 664 | 6.04% | 6.83% |  |
| D | 10999 | 9714 | 2160 | 2160 | 19.64% | 22.24% |  |
Top three noisy pixels from each quadrant. If the there are fewer than three noisy pixels in the level2.evt file, extra rows are filled as -1
| Pixel properties | Quadrant properties | ||||||
|---|---|---|---|---|---|---|---|
| Quadrant | DetID | PixID | Counts | Sigma | Mean | Median | Sigma |
| A | 4 | 159 | 1317134 | 5221.62 | 1021 | 994 | 252.1 |
| A | 0 | 8 | 342142 | 1353.46 | 1021 | 994 | 252.1 |
| A | 6 | 162 | 104281 | 409.78 | 1021 | 994 | 252.1 |
| B | 0 | 199 | 39505 | 176.39 | 1019 | 979 | 218.4 |
| B | 10 | 247 | 37749 | 168.35 | 1019 | 979 | 218.4 |
| B | 5 | 185 | 30954 | 137.24 | 1019 | 979 | 218.4 |
| C | 9 | 38 | 3280521 | 12084.81 | 990 | 981 | 271.4 |
| C | 12 | 249 | 79085 | 287.81 | 990 | 981 | 271.4 |
| C | 1 | 241 | 40370 | 145.14 | 990 | 981 | 271.4 |
| D | 11 | 129 | 6110374 | 23725.43 | 898 | 857 | 257.5 |
| D | 2 | 249 | 613833 | 2380.4 | 898 | 857 | 257.5 |
| D | 8 | 160 | 610381 | 2367.0 | 898 | 857 | 257.5 |
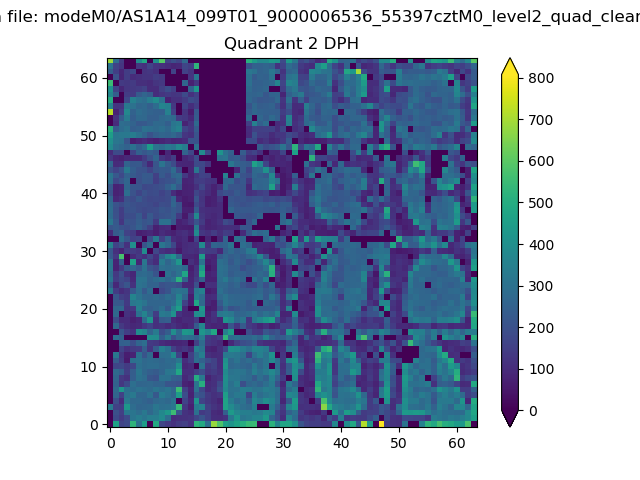
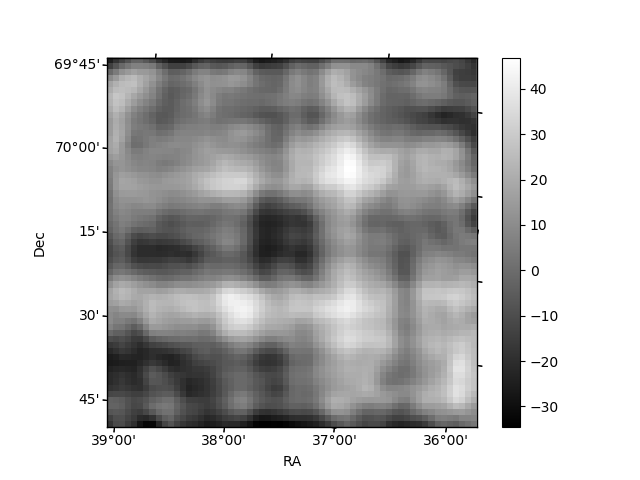
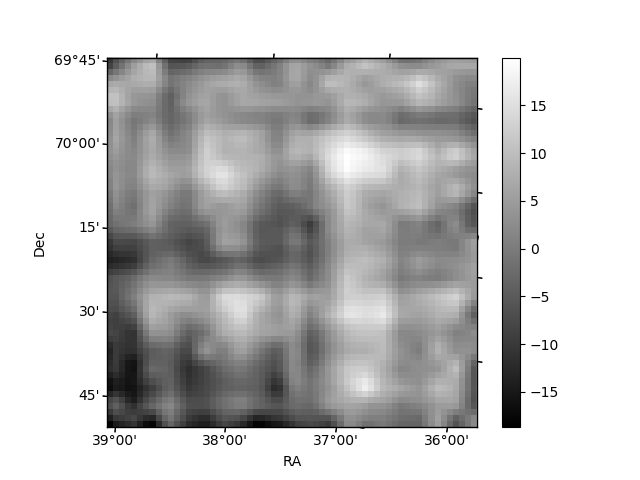
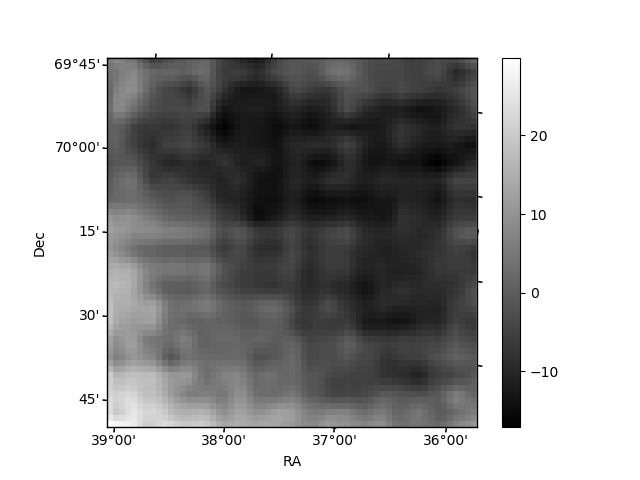
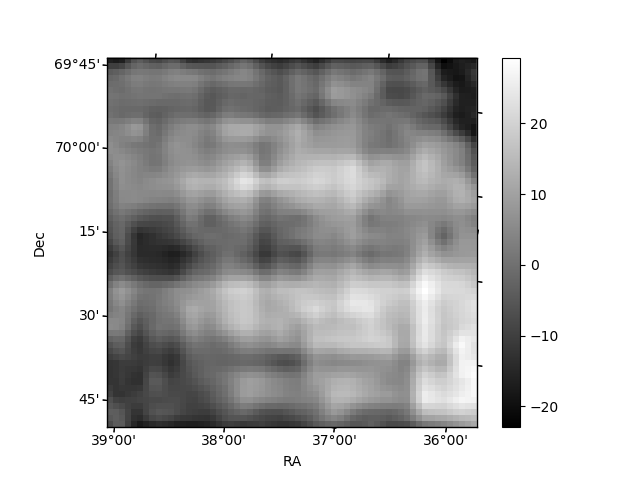
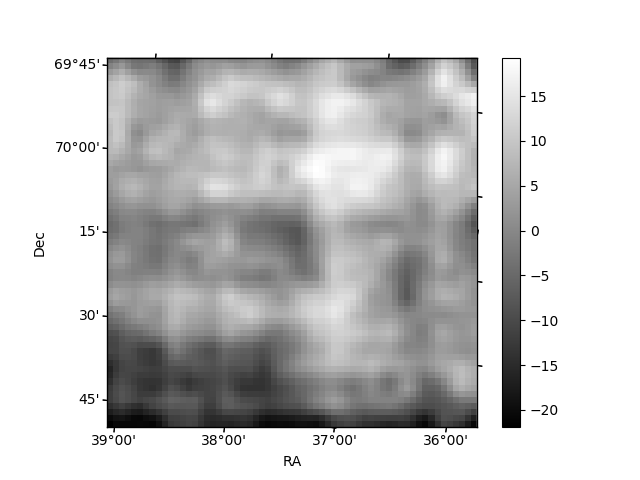
Histogram calculated using DETX and DETY for each event in the final _common_clean file
| Quadrant A | 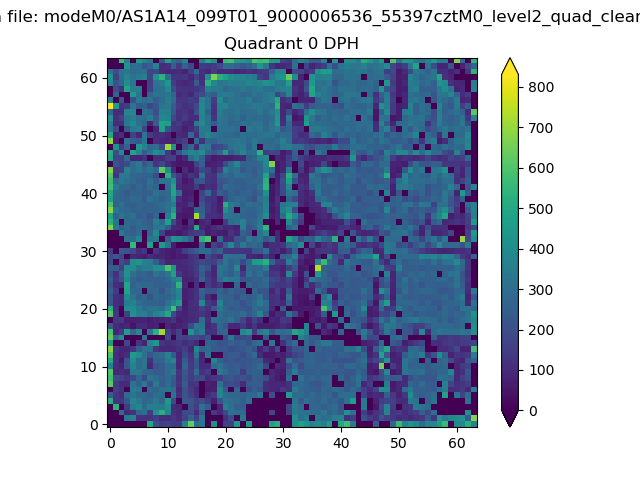 |
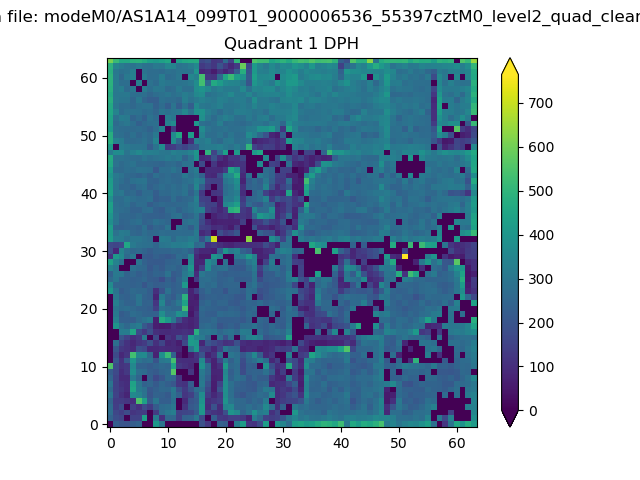 |
Quadrant B |
|---|---|---|---|
| Quadrant D | 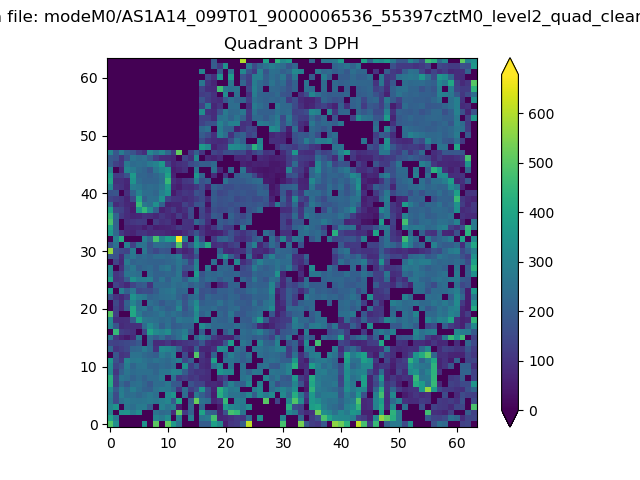 |
 |
Quadrant C |
| Plot type | Count rate plots | Images |
|---|---|---|
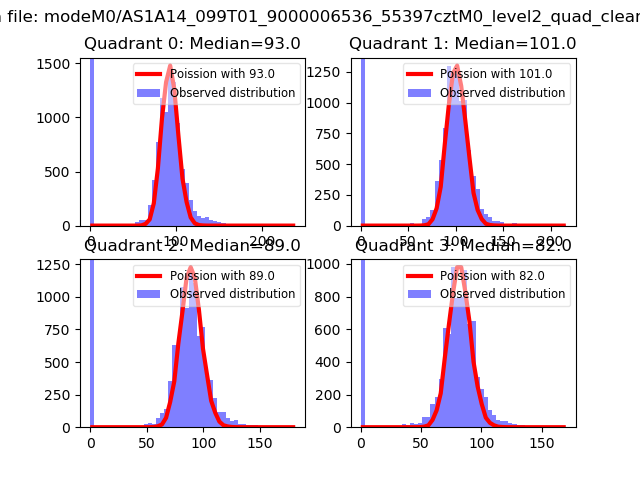
| Comparison with Poisson distribution Blue bars denote a histogram of data divided into 1 sec bins. Red curve is a Poisson curve with rate = median count rate of data. |
 |
 |
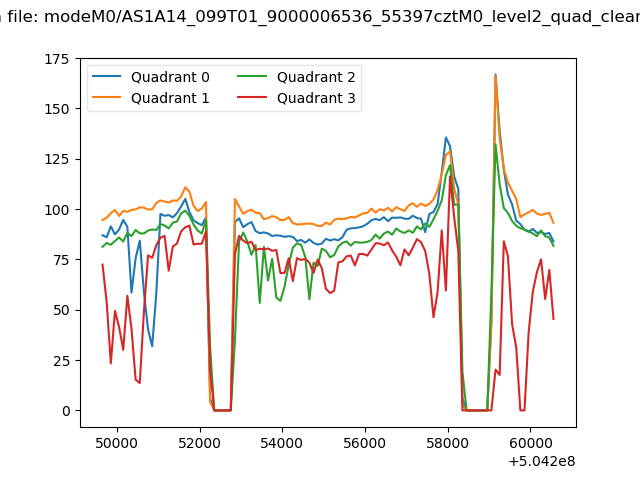
| Quadrant-wise count rates Data is divided into 100 sec bins |
 |
|
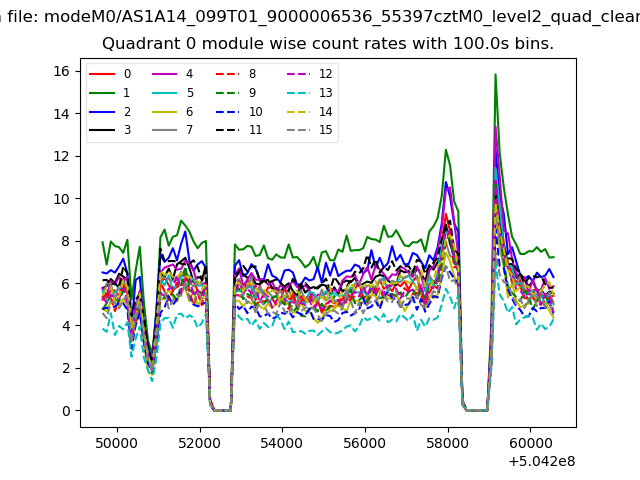
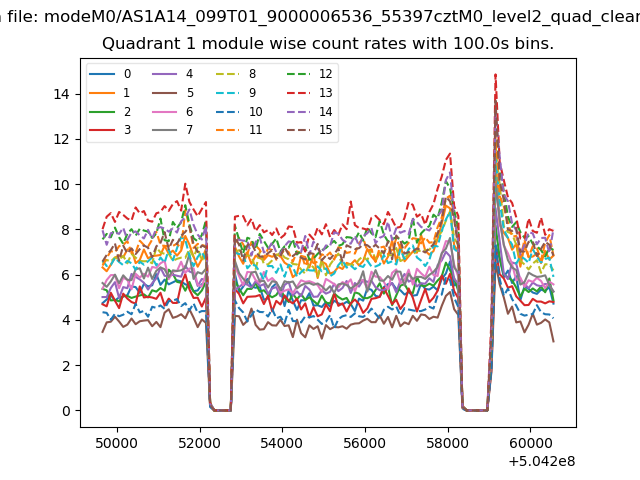
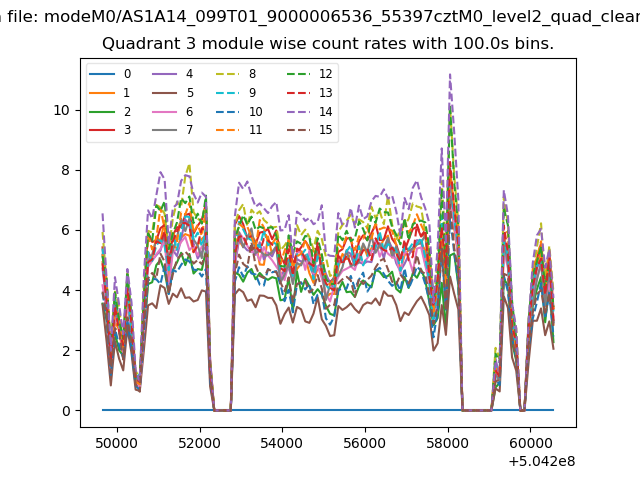
| Module-wise count rates for Quadrant A Data is divided into 100 sec bins |
 |
 |
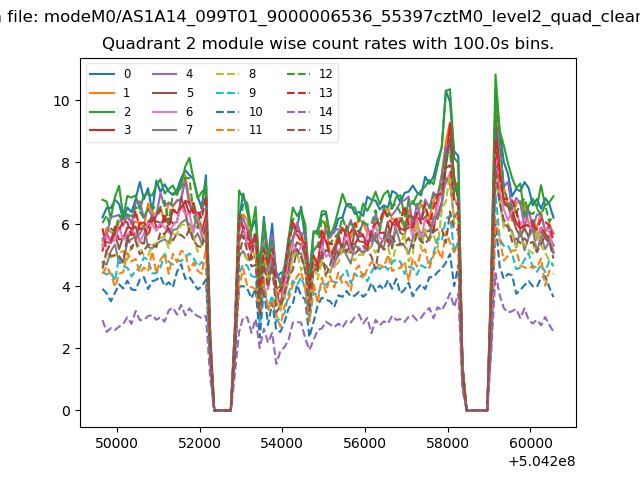
| Module-wise count rates for Quadrant B Data is divided into 100 sec bins |
 |
 |
| Module-wise count rates for Quadrant C Data is divided into 100 sec bins |
 |
 |
| Module-wise count rates for Quadrant D Data is divided into 100 sec bins |
 |
 |
| Parameter | Plot |
|---|---|
| CZT HV Monitor | 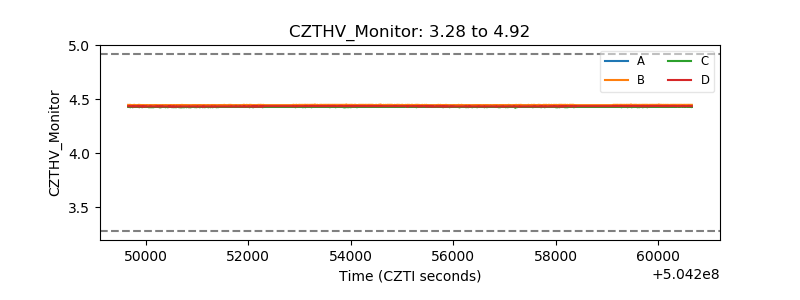 |
| D_VDD | 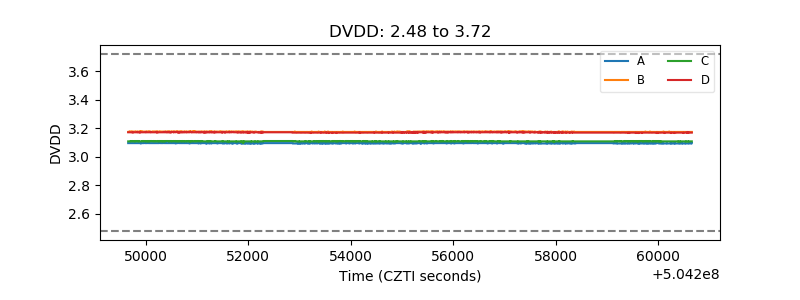 |
| Temperature 1 | 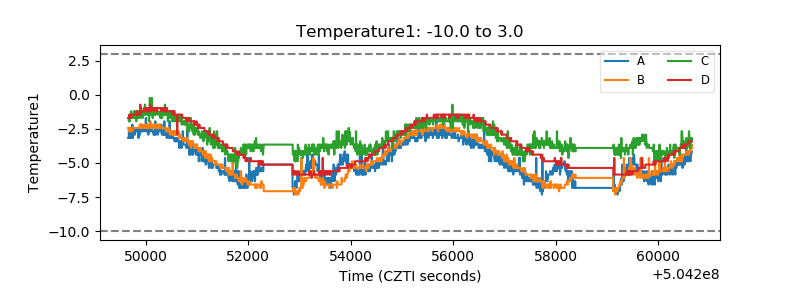 |
| Veto HV Monitor | 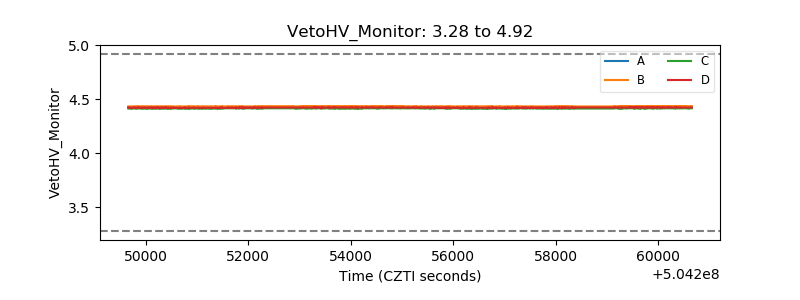 |
| Veto LLD | 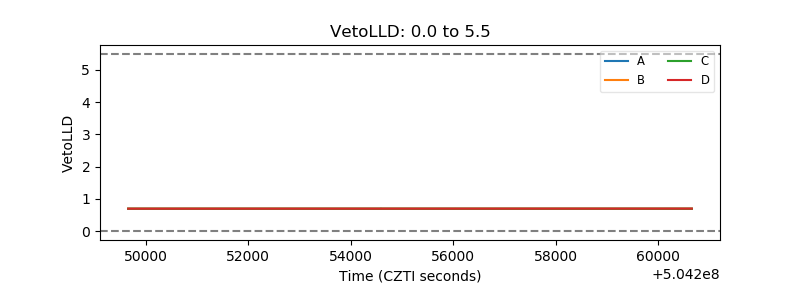 |
| Alpha Counter | 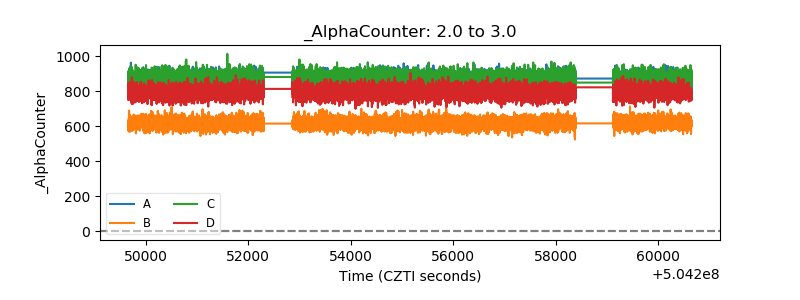 |
| _CPM_Rate | 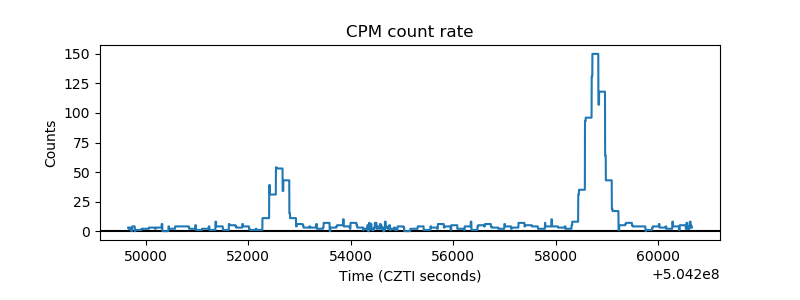 |
| CZT Counter | 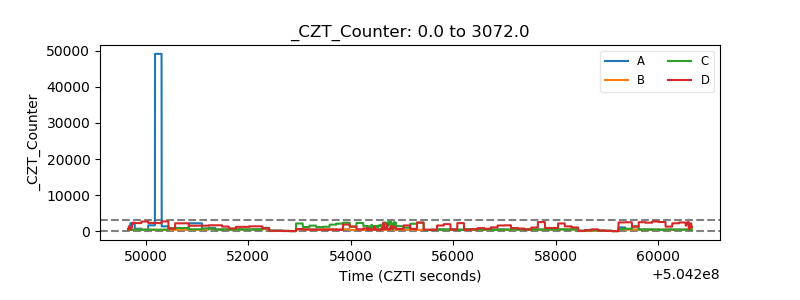 |
| +2.5 Volts monitor |  |
| +5 Volts monitor | 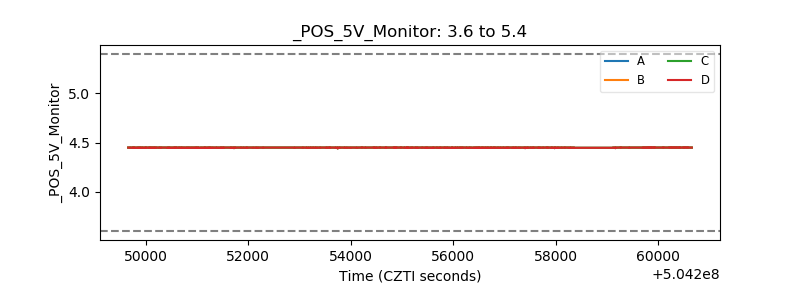 |
| _ROLL_ROT | 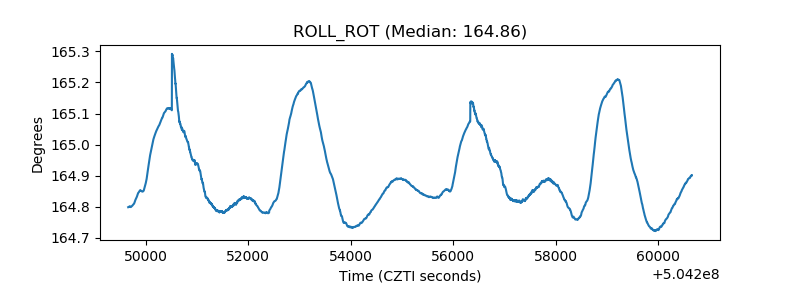 |
| _Roll_DEC | 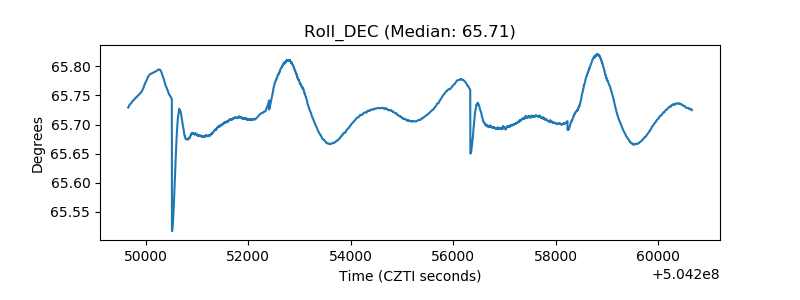 |
| _Roll_RA | 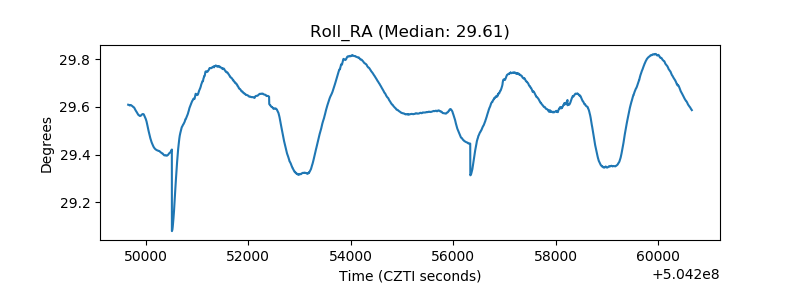 |
| Veto Counter | 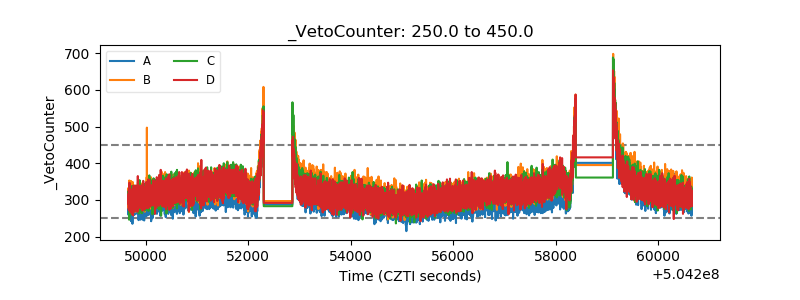 |