| Param | Original file | Final file |
|---|---|---|
| Filename | modeM0/AS1A14_099T01_9000006536_55398cztM0_level2.fits | modeM0/AS1A14_099T01_9000006536_55398cztM0_level2_quad_clean.evt |
| Size (bytes) | 425,249,280 | 89,642,880 |
| Size | 405.5 MB | 85.5 MB |
| Events in quadrant A | 2,666,339 | 607,566 |
| Events in quadrant B | 2,702,009 | 639,351 |
| Events in quadrant C | 2,811,281 | 563,172 |
| Events in quadrant D | 7,073,911 | 466,572 |
| Mode M9 | |||
|---|---|---|---|
| Quadrant | BADHDUFLAG | Total packets | Discarded packets |
| A | 0 | 9 | 0 |
| B | 0 | 9 | 0 |
| C | 0 | 9 | 0 |
| D | 0 | 9 | 0 |
| Mode SS | |||
|---|---|---|---|
| Quadrant | BADHDUFLAG | Total packets | Discarded packets |
| A | 0 | 128 | 0 |
| B | 0 | 128 | 0 |
| C | 0 | 128 | 0 |
| D | 0 | 128 | 0 |
| Mode M0 | |||
|---|---|---|---|
| Quadrant | BADHDUFLAG | Total packets | Discarded packets |
| A | 0 | 12769 | 1 |
| B | 0 | 12813 | 1 |
| C | 0 | 13346 | 1 |
| D | 0 | 25346 | 1 |
| Quadrant | Total seconds | Saturated seconds | Saturation percentage |
|---|---|---|---|
| A | 6268 | 64 | 1.021059% |
| B | 6269 | 73 | 1.164460% |
| C | 6269 | 78 | 1.244218% |
| D | 6269 | 1089 | 17.371192% |
Noise dominated data is calculated using 1-second bins in cleaned event files. If a bin has >2000 counts, and if more than 50% of those come from <1% of pixels, then it is considered to be noise-dominated and hence unusable.
| Quadrant | # 1 sec bins | Bins with >0 counts | Bins with >2000 counts | High rate bins dominated by noise | Noise dominated (total time) | Noise dominated (detector-on time) | Marked lightcurve |
|---|---|---|---|---|---|---|---|
| A | 7178 | 6269 | 0 | 0 | 0.00% | 0.00% | 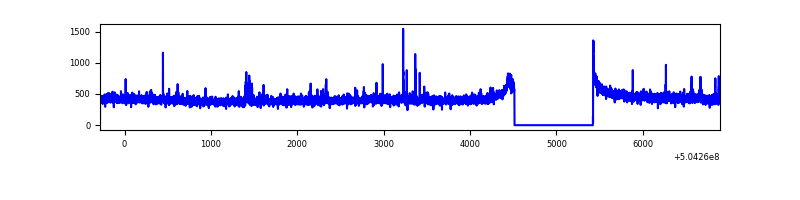 |
| B | 7179 | 6270 | 2 | 2 | 0.03% | 0.03% | 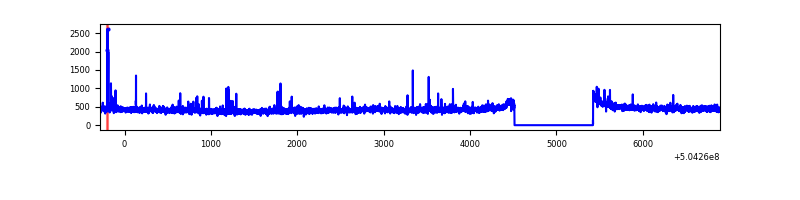 |
| C | 7179 | 6270 | 26 | 26 | 0.36% | 0.41% | 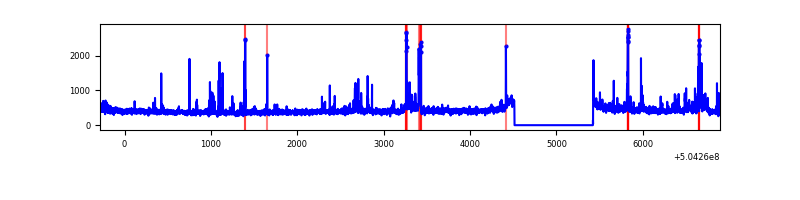 |
| D | 7179 | 6270 | 1115 | 1115 | 15.53% | 17.78% | 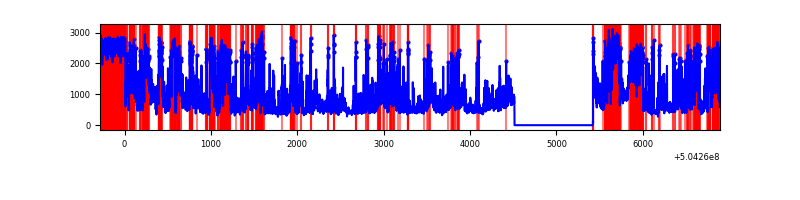 |
Top three noisy pixels from each quadrant. If the there are fewer than three noisy pixels in the level2.evt file, extra rows are filled as -1
| Pixel properties | Quadrant properties | ||||||
|---|---|---|---|---|---|---|---|
| Quadrant | DetID | PixID | Counts | Sigma | Mean | Median | Sigma |
| A | 4 | 3 | 27274 | 161.38 | 664 | 647 | 165.0 |
| A | 8 | 6 | 24562 | 144.94 | 664 | 647 | 165.0 |
| A | 0 | 8 | 17045 | 99.38 | 664 | 647 | 165.0 |
| B | 5 | 172 | 63152 | 446.7 | 650 | 627 | 140.0 |
| B | 10 | 247 | 29720 | 207.85 | 650 | 627 | 140.0 |
| B | 0 | 182 | 21616 | 149.95 | 650 | 627 | 140.0 |
| C | 12 | 249 | 165128 | 943.19 | 635 | 628 | 174.4 |
| C | 13 | 3 | 78647 | 447.34 | 635 | 628 | 174.4 |
| C | 12 | 2 | 33477 | 188.35 | 635 | 628 | 174.4 |
| D | 11 | 129 | 3724468 | 22271.4 | 593 | 565 | 167.2 |
| D | 8 | 160 | 763464 | 4562.64 | 593 | 565 | 167.2 |
| D | 11 | 176 | 81574 | 484.49 | 593 | 565 | 167.2 |
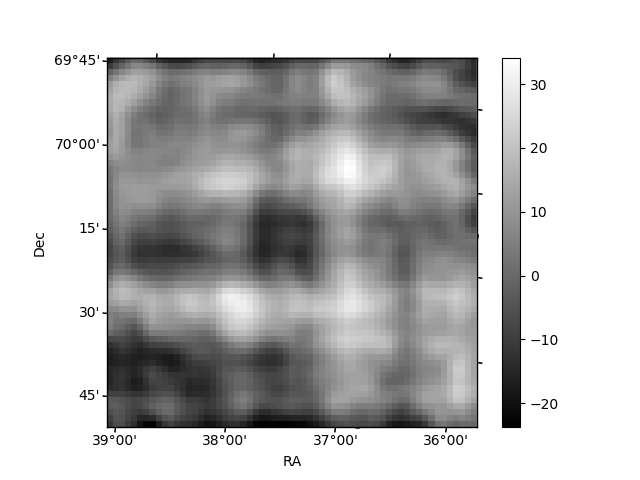
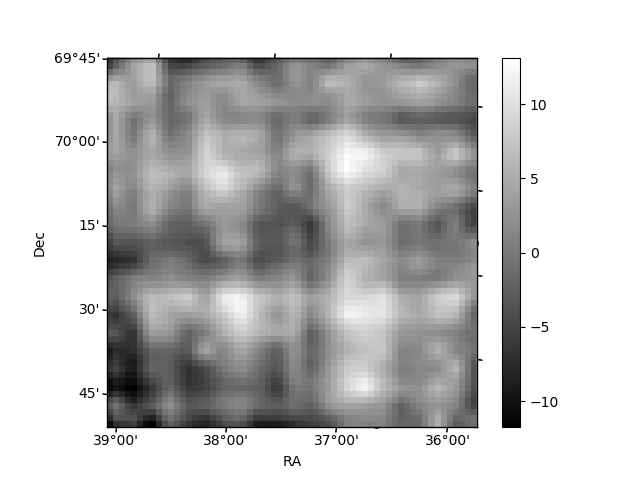
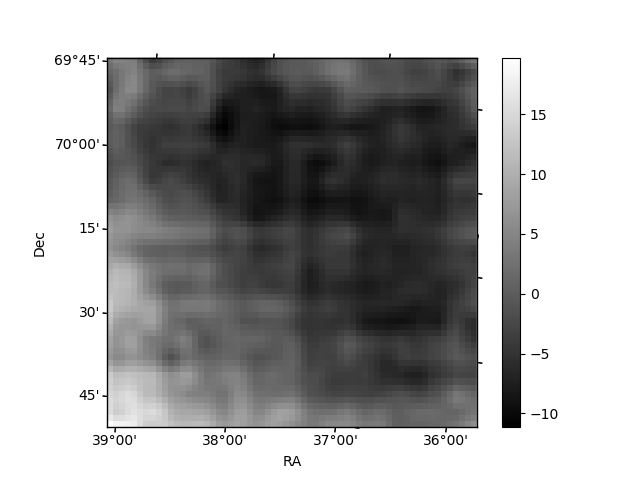
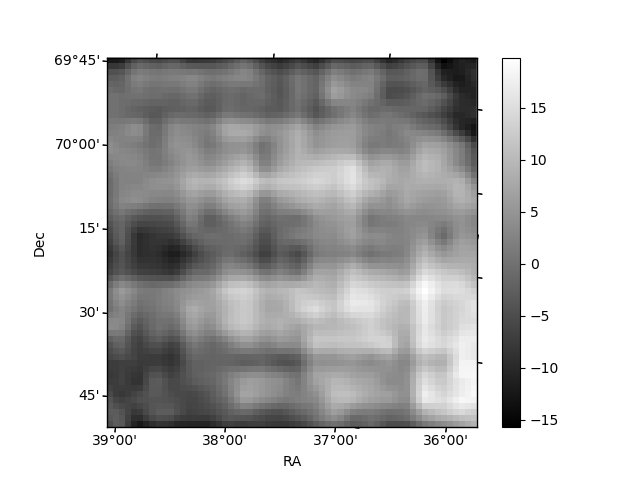
Histogram calculated using DETX and DETY for each event in the final _common_clean file
| Quadrant A | 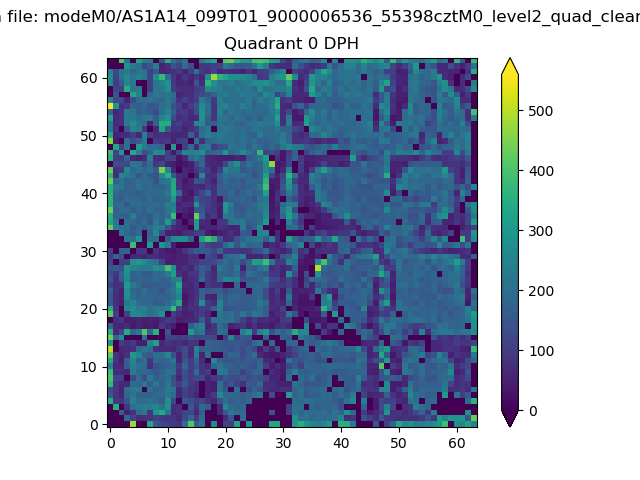 |
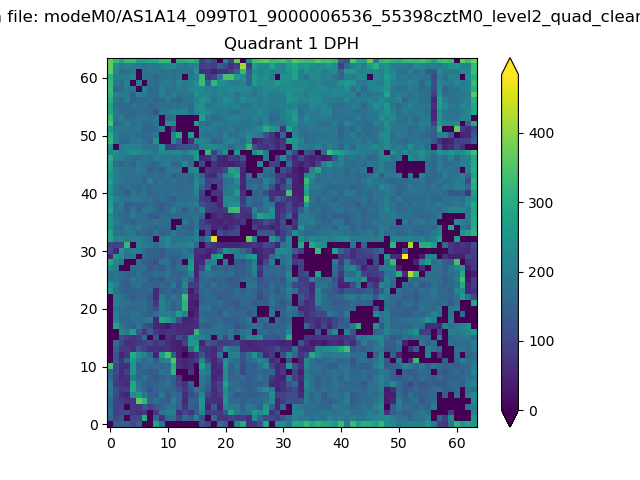 |
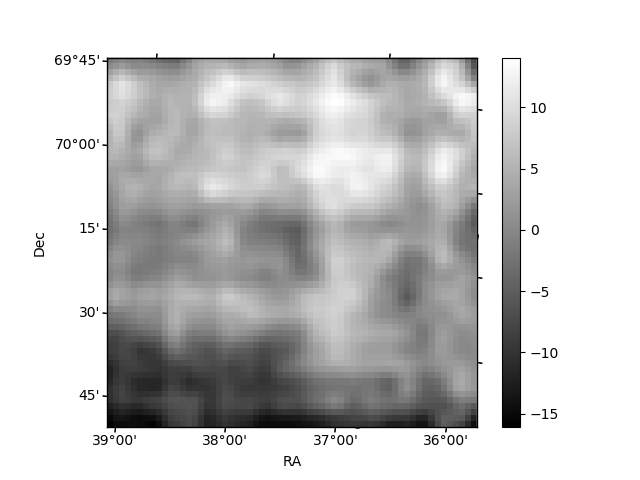
Quadrant B |
|---|---|---|---|
| Quadrant D | 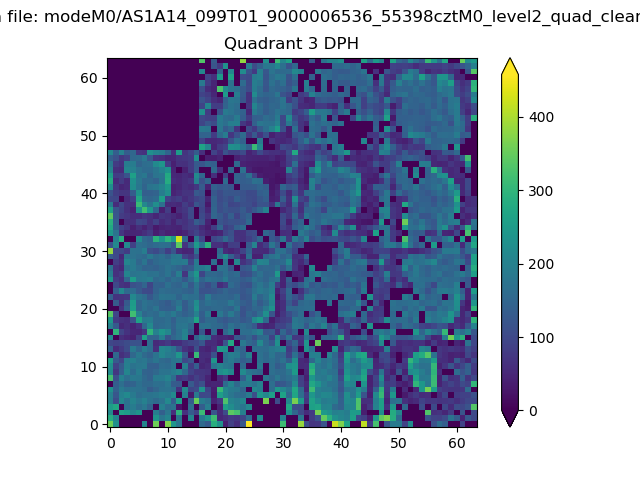 |
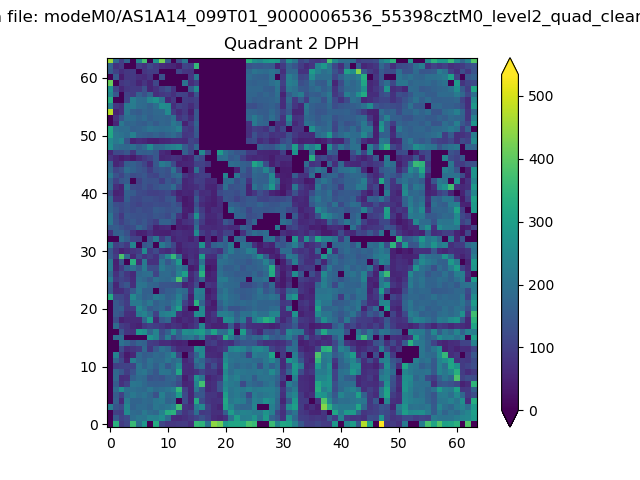 |
Quadrant C |
| Plot type | Count rate plots | Images |
|---|---|---|
| Comparison with Poisson distribution Blue bars denote a histogram of data divided into 1 sec bins. Red curve is a Poisson curve with rate = median count rate of data. |
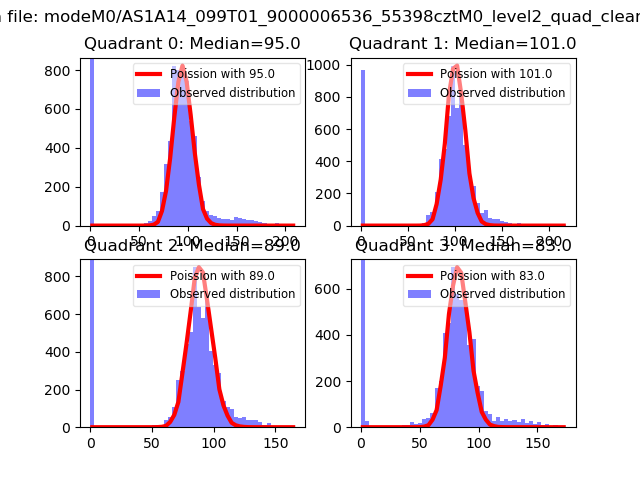 |
 |
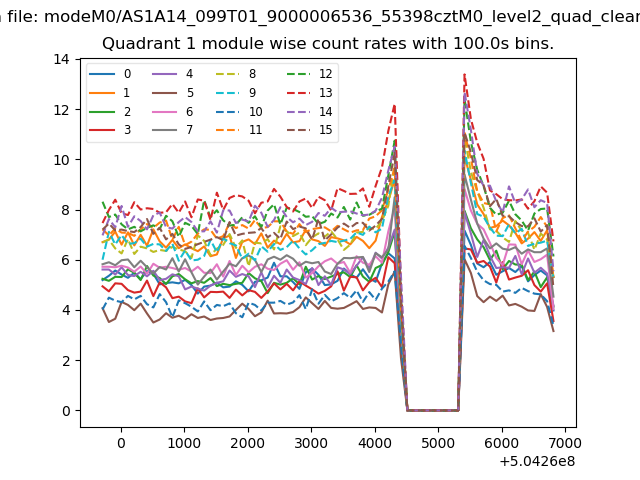
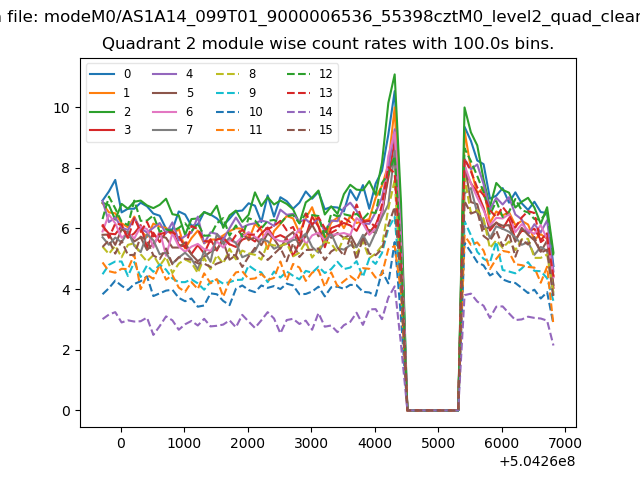
| Quadrant-wise count rates Data is divided into 100 sec bins |
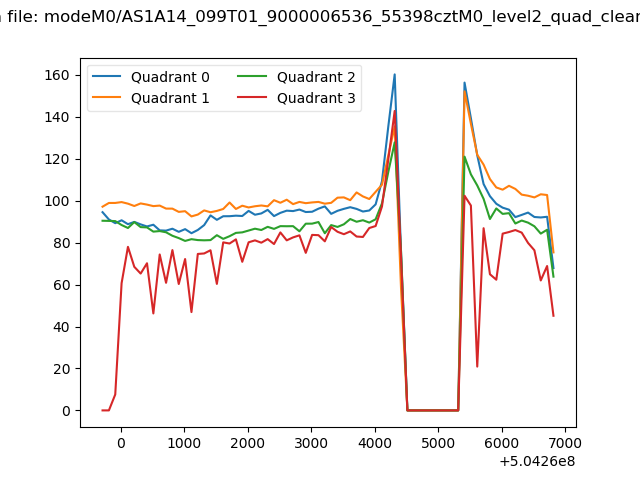 |
|
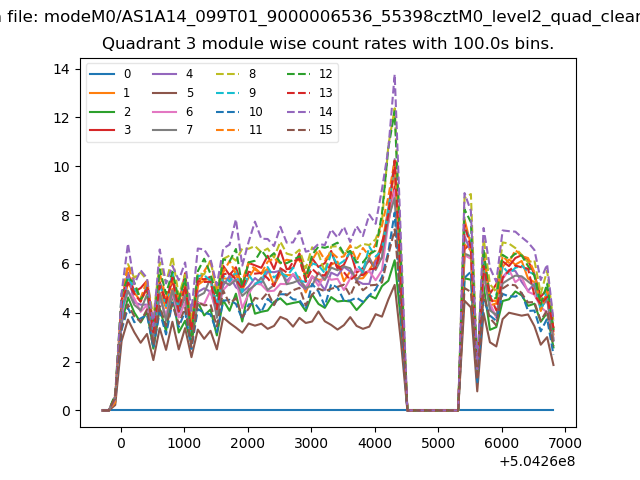
| Module-wise count rates for Quadrant A Data is divided into 100 sec bins |
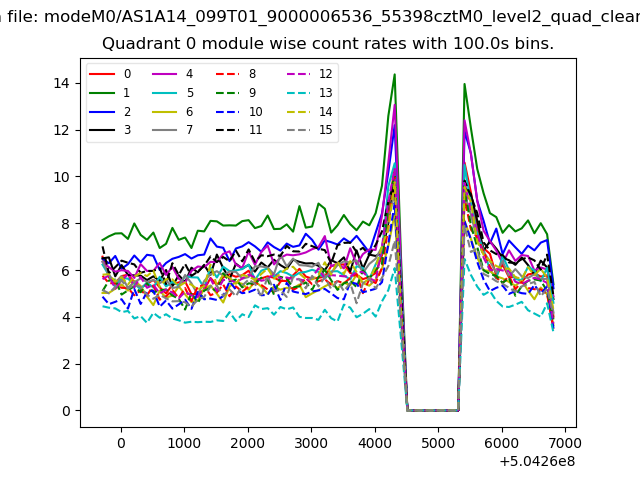 |
 |
| Module-wise count rates for Quadrant B Data is divided into 100 sec bins |
 |
 |
| Module-wise count rates for Quadrant C Data is divided into 100 sec bins |
 |
 |
| Module-wise count rates for Quadrant D Data is divided into 100 sec bins |
 |
 |
| Parameter | Plot |
|---|---|
| CZT HV Monitor | 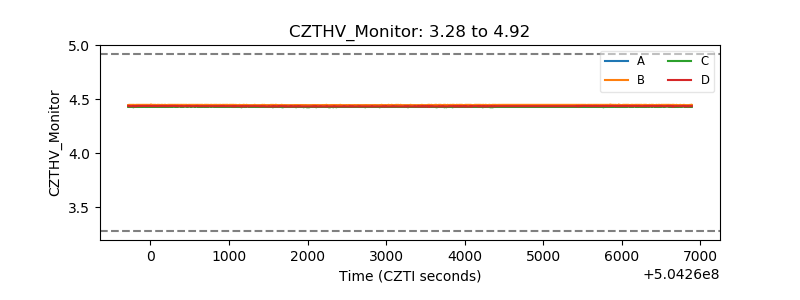 |
| D_VDD | 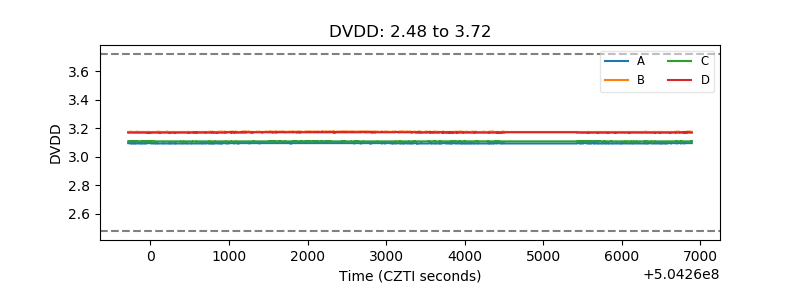 |
| Temperature 1 | 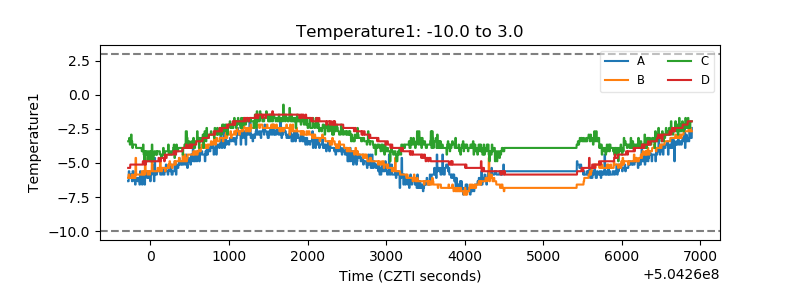 |
| Veto HV Monitor |  |
| Veto LLD | 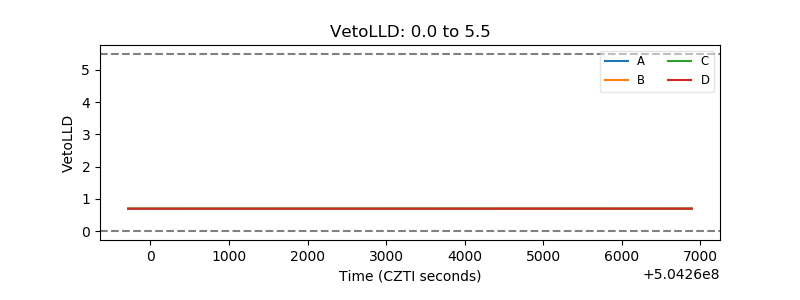 |
| Alpha Counter | 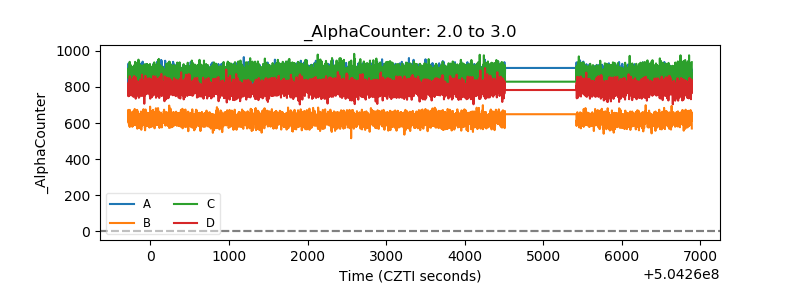 |
| _CPM_Rate | 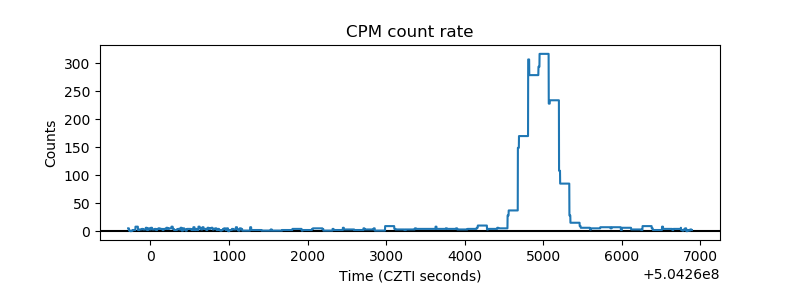 |
| CZT Counter | 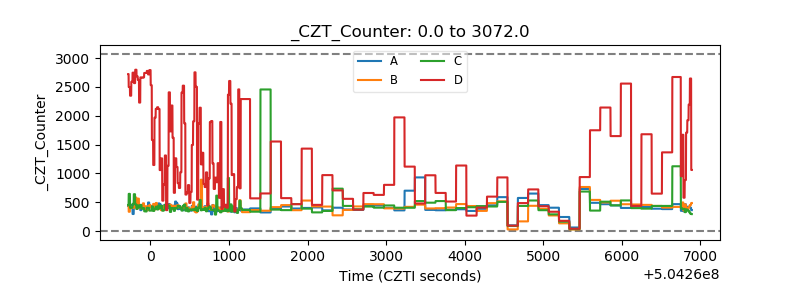 |
| +2.5 Volts monitor | 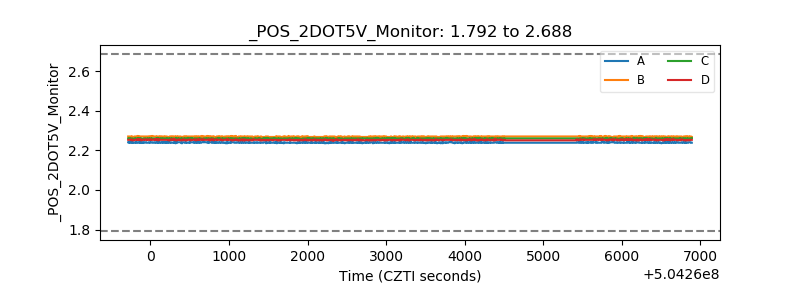 |
| +5 Volts monitor | 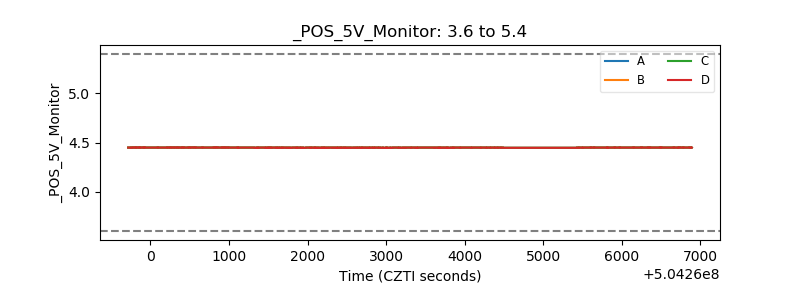 |
| _ROLL_ROT | 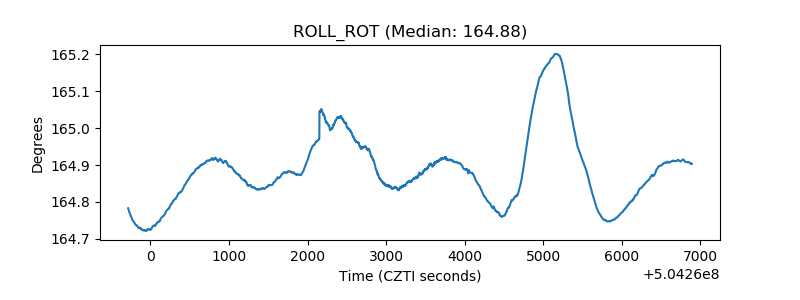 |
| _Roll_DEC | 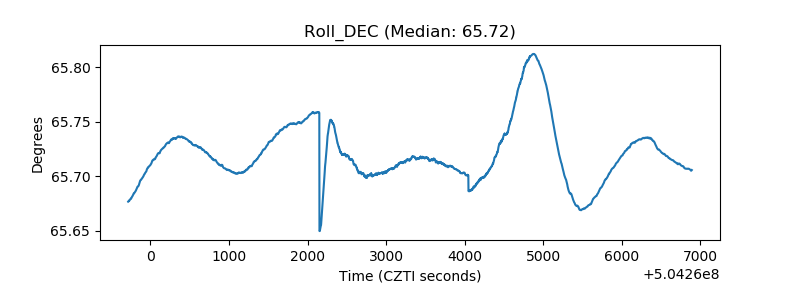 |
| _Roll_RA | 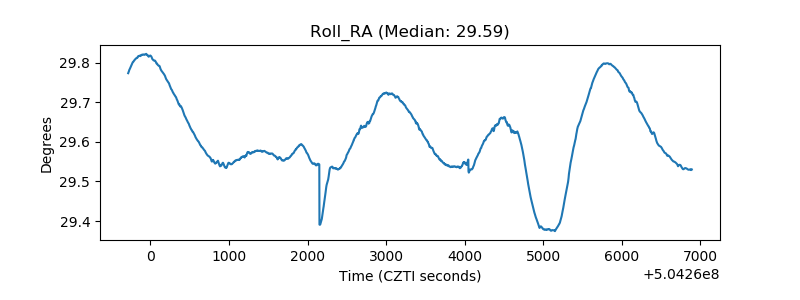 |
| Veto Counter | 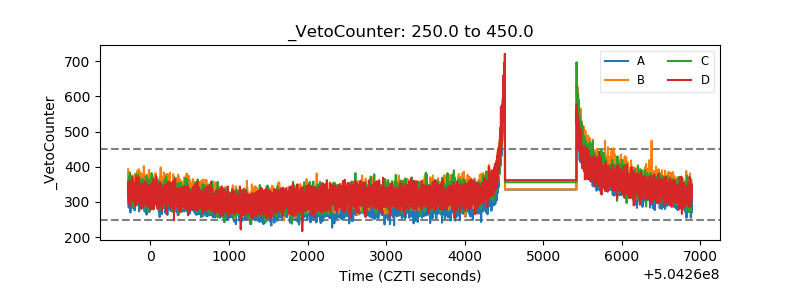 |