| Param | Original file | Final file |
|---|---|---|
| Filename | modeM0/AS1A14_099T01_9000006536_55400cztM0_level2.fits | modeM0/AS1A14_099T01_9000006536_55400cztM0_level2_quad_clean.evt |
| Size (bytes) | 443,905,920 | 85,582,080 |
| Size | 423.3 MB | 81.6 MB |
| Events in quadrant A | 2,885,315 | 583,090 |
| Events in quadrant B | 2,906,328 | 622,035 |
| Events in quadrant C | 2,834,314 | 544,723 |
| Events in quadrant D | 7,343,939 | 426,828 |
| Mode M9 | |||
|---|---|---|---|
| Quadrant | BADHDUFLAG | Total packets | Discarded packets |
| A | 0 | 10 | 0 |
| B | 0 | 10 | 0 |
| C | 0 | 10 | 0 |
| D | 0 | 10 | 0 |
| Mode SS | |||
|---|---|---|---|
| Quadrant | BADHDUFLAG | Total packets | Discarded packets |
| A | 0 | 120 | 0 |
| B | 0 | 120 | 0 |
| C | 0 | 120 | 0 |
| D | 0 | 120 | 0 |
| Mode M0 | |||
|---|---|---|---|
| Quadrant | BADHDUFLAG | Total packets | Discarded packets |
| A | 0 | 13057 | 1 |
| B | 0 | 12531 | 1 |
| C | 0 | 12996 | 1 |
| D | 0 | 25868 | 4 |
| Quadrant | Total seconds | Saturated seconds | Saturation percentage |
|---|---|---|---|
| A | 5937 | 124 | 2.088597% |
| B | 5937 | 86 | 1.448543% |
| C | 5938 | 112 | 1.886157% |
| D | 5936 | 1426 | 24.022911% |
Noise dominated data is calculated using 1-second bins in cleaned event files. If a bin has >2000 counts, and if more than 50% of those come from <1% of pixels, then it is considered to be noise-dominated and hence unusable.
| Quadrant | # 1 sec bins | Bins with >0 counts | Bins with >2000 counts | High rate bins dominated by noise | Noise dominated (total time) | Noise dominated (detector-on time) | Marked lightcurve |
|---|---|---|---|---|---|---|---|
| A | 6967 | 5938 | 33 | 33 | 0.47% | 0.56% | 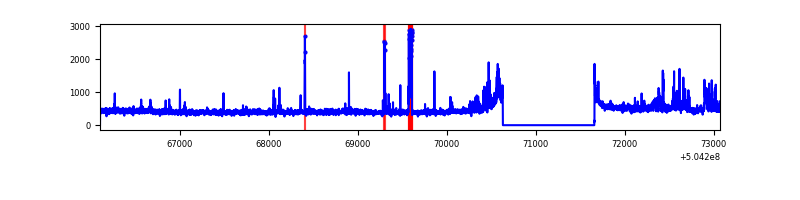 |
| B | 6967 | 5938 | 6 | 6 | 0.09% | 0.10% | 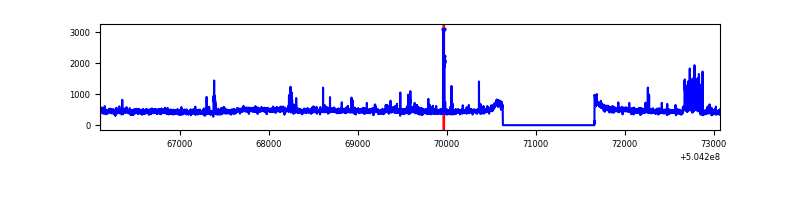 |
| C | 6968 | 5939 | 36 | 36 | 0.52% | 0.61% | 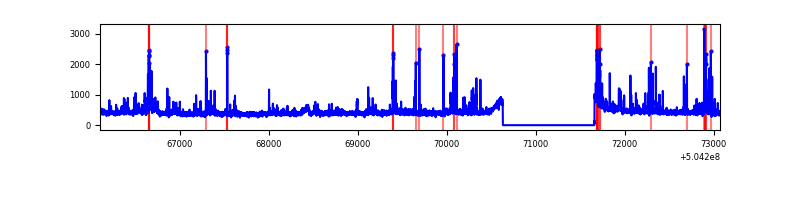 |
| D | 6968 | 5938 | 1471 | 1471 | 21.11% | 24.77% | 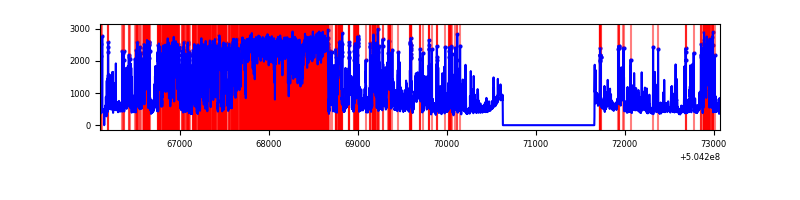 |
Top three noisy pixels from each quadrant. If the there are fewer than three noisy pixels in the level2.evt file, extra rows are filled as -1
| Pixel properties | Quadrant properties | ||||||
|---|---|---|---|---|---|---|---|
| Quadrant | DetID | PixID | Counts | Sigma | Mean | Median | Sigma |
| A | 4 | 159 | 217372 | 1370.03 | 634 | 620 | 158.2 |
| A | 3 | 62 | 76381 | 478.87 | 634 | 620 | 158.2 |
| A | 4 | 3 | 44111 | 274.89 | 634 | 620 | 158.2 |
| B | 5 | 172 | 265240 | 1966.42 | 622 | 598 | 134.6 |
| B | 5 | 236 | 116967 | 864.68 | 622 | 598 | 134.6 |
| B | 10 | 247 | 37109 | 271.29 | 622 | 598 | 134.6 |
| C | 12 | 249 | 151501 | 901.05 | 608 | 602 | 167.5 |
| C | 13 | 3 | 149077 | 886.58 | 608 | 602 | 167.5 |
| C | 12 | 2 | 95249 | 565.16 | 608 | 602 | 167.5 |
| D | 11 | 129 | 4554489 | 27769.85 | 569 | 545 | 164.0 |
| D | 8 | 160 | 209247 | 1272.66 | 569 | 545 | 164.0 |
| D | 11 | 176 | 86617 | 524.87 | 569 | 545 | 164.0 |
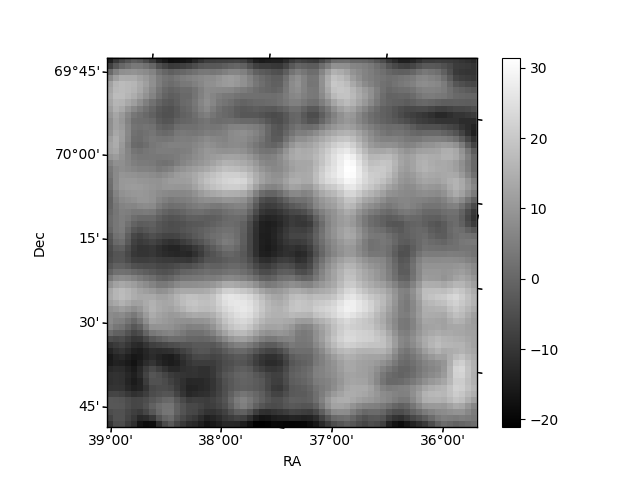
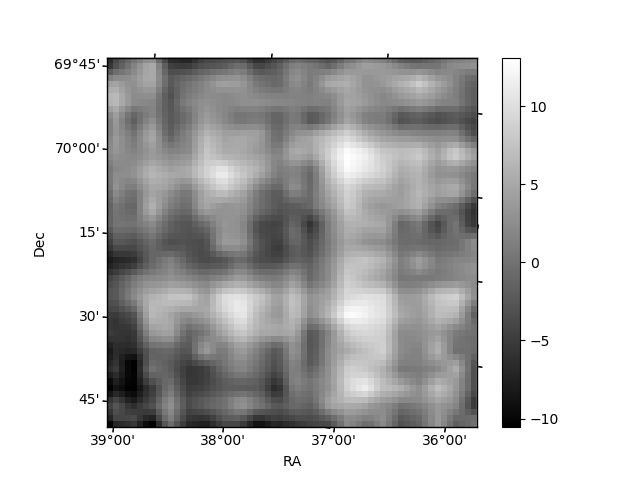
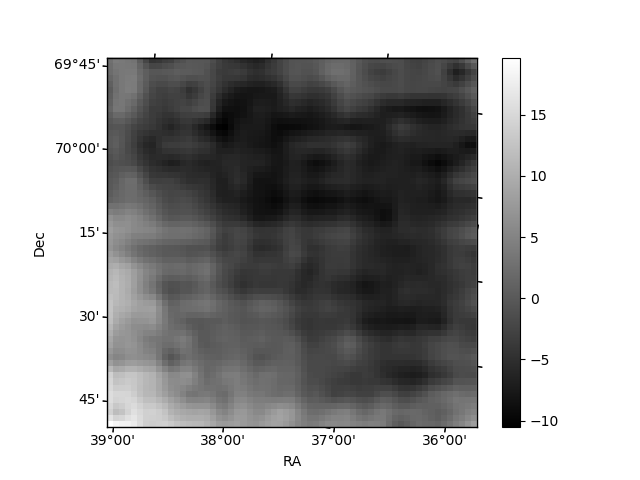
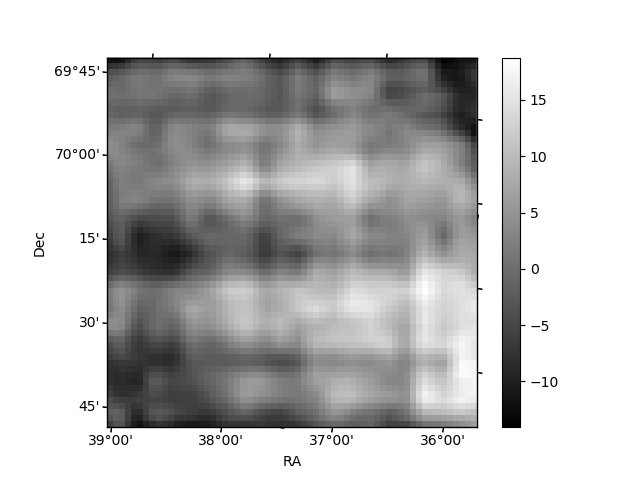
Histogram calculated using DETX and DETY for each event in the final _common_clean file
| Quadrant A | 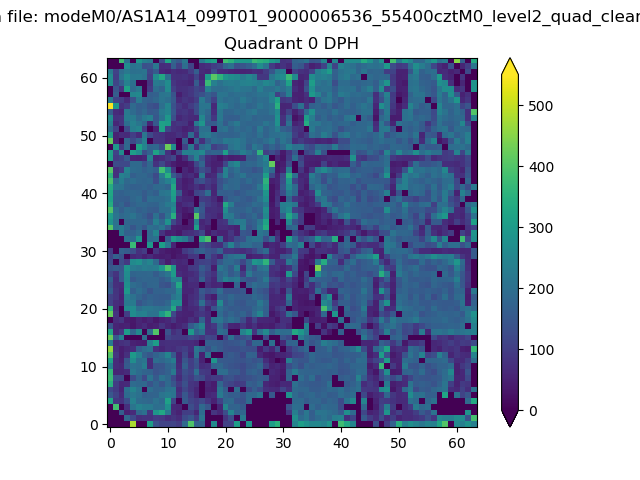 |
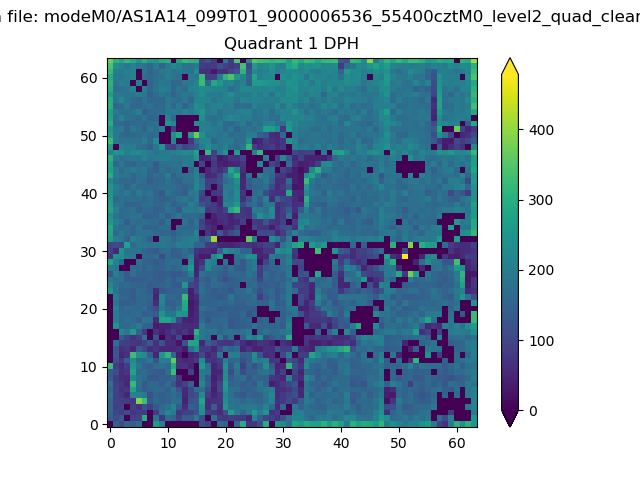 |
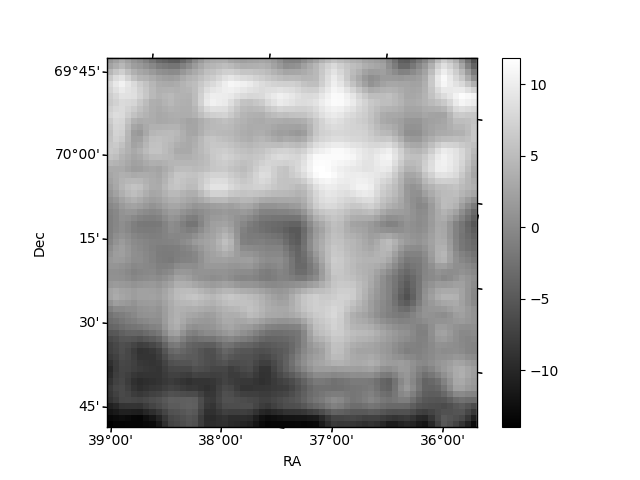
Quadrant B |
|---|---|---|---|
| Quadrant D | 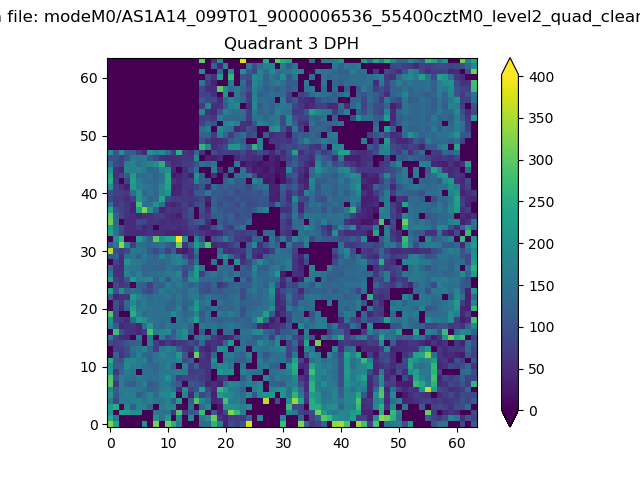 |
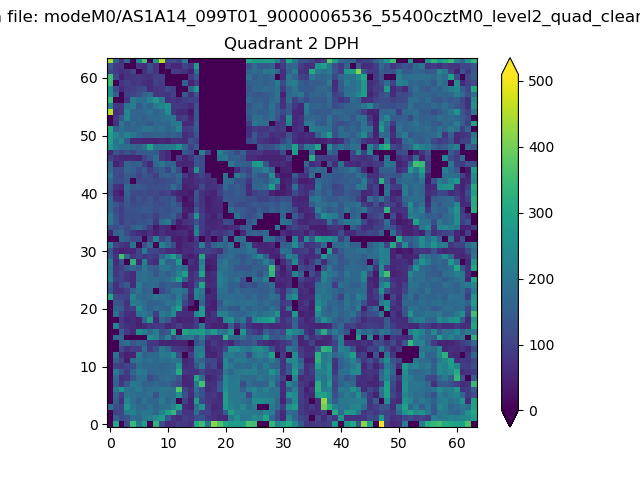 |
Quadrant C |
| Plot type | Count rate plots | Images |
|---|---|---|
| Comparison with Poisson distribution Blue bars denote a histogram of data divided into 1 sec bins. Red curve is a Poisson curve with rate = median count rate of data. |
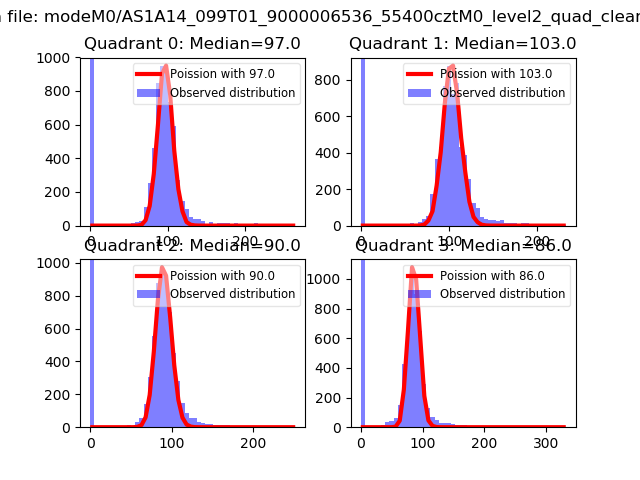 |
 |
| Quadrant-wise count rates Data is divided into 100 sec bins |
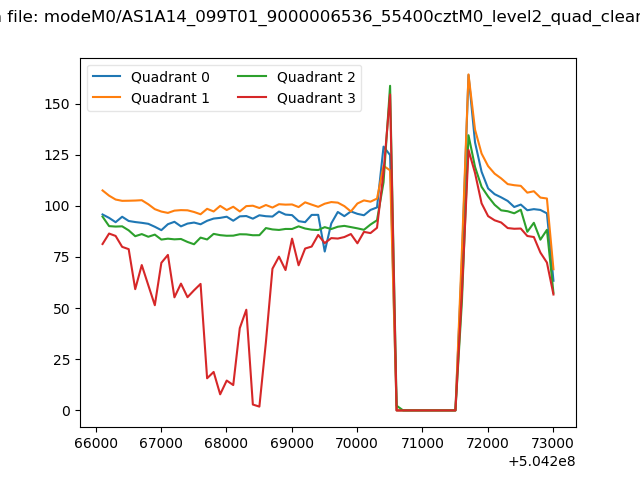 |
|
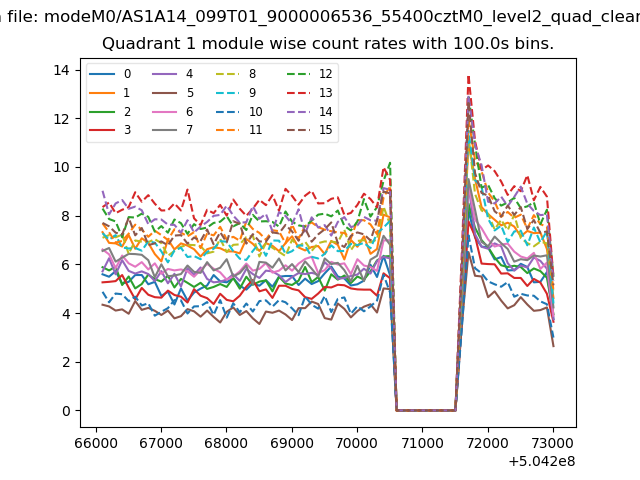
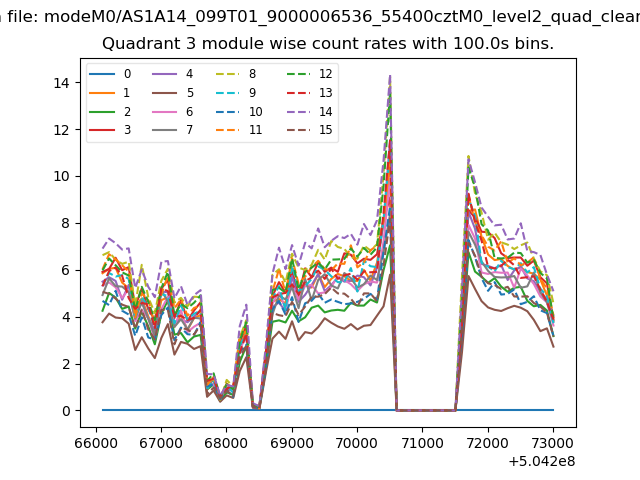
| Module-wise count rates for Quadrant A Data is divided into 100 sec bins |
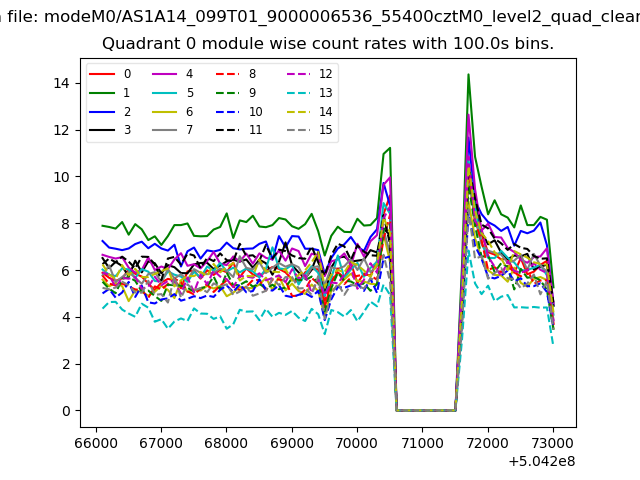 |
 |
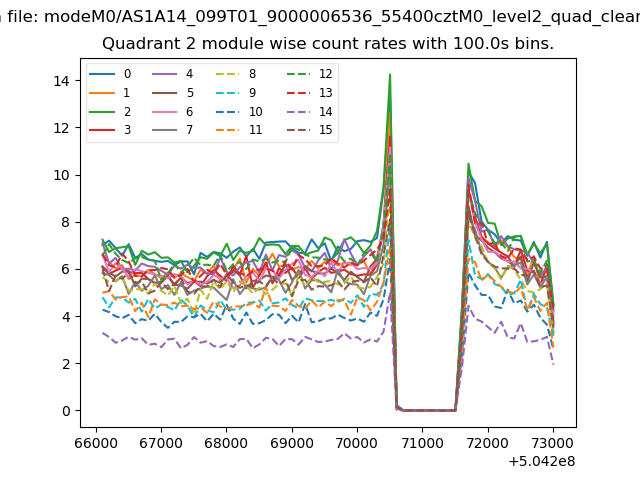
| Module-wise count rates for Quadrant B Data is divided into 100 sec bins |
 |
 |
| Module-wise count rates for Quadrant C Data is divided into 100 sec bins |
 |
 |
| Module-wise count rates for Quadrant D Data is divided into 100 sec bins |
 |
 |
| Parameter | Plot |
|---|---|
| CZT HV Monitor | 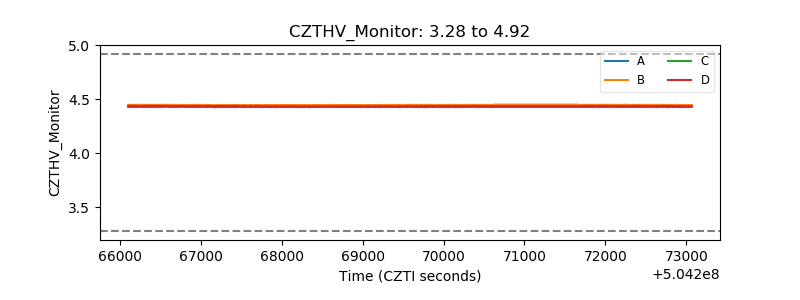 |
| D_VDD | 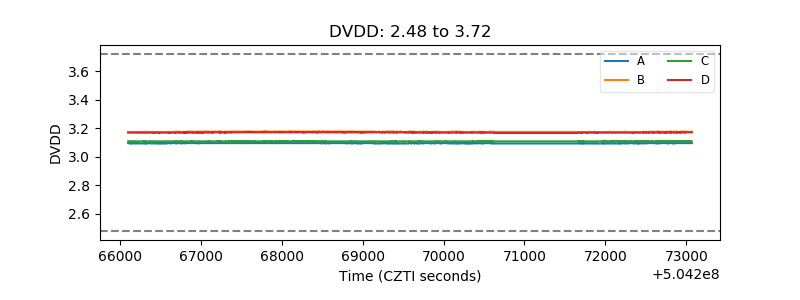 |
| Temperature 1 | 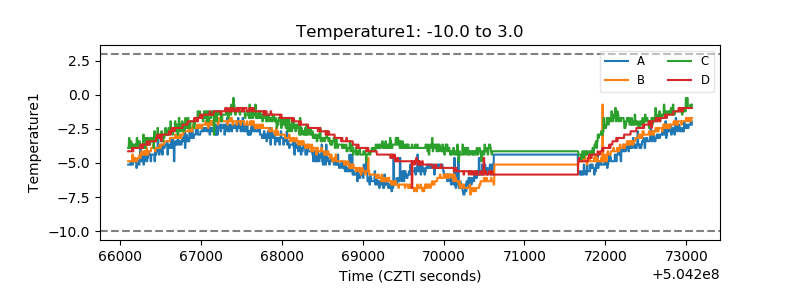 |
| Veto HV Monitor | 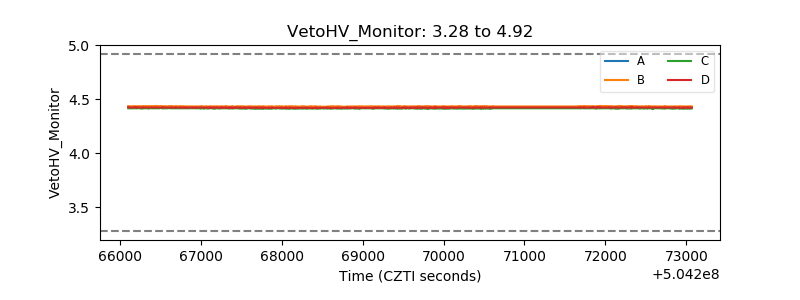 |
| Veto LLD | 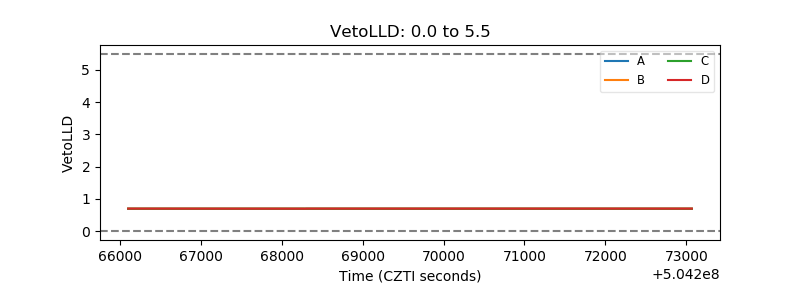 |
| Alpha Counter | 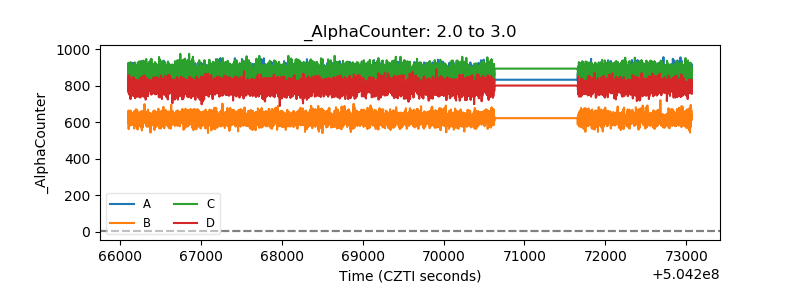 |
| _CPM_Rate | 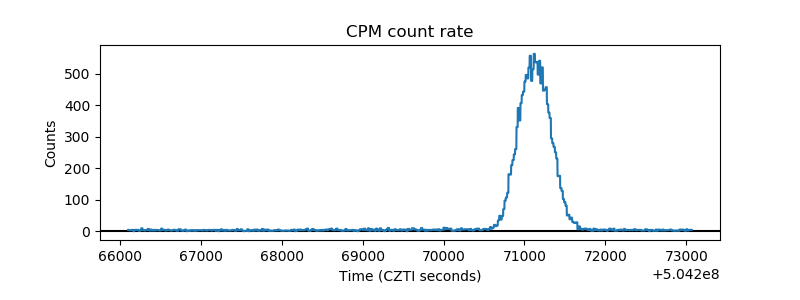 |
| CZT Counter | 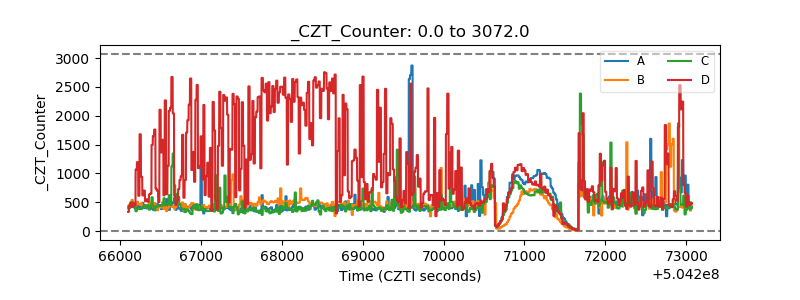 |
| +2.5 Volts monitor | 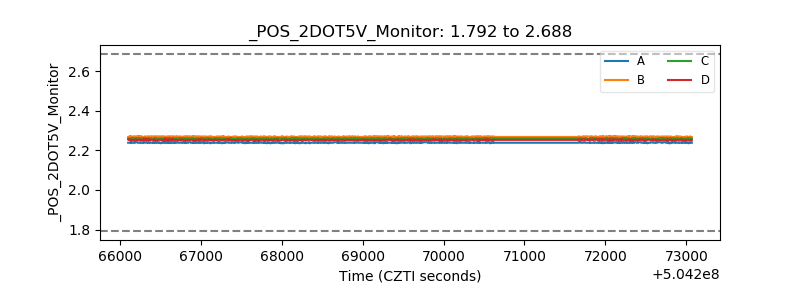 |
| +5 Volts monitor | 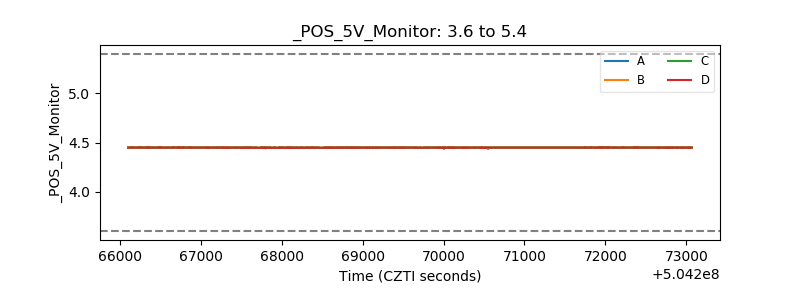 |
| _ROLL_ROT | 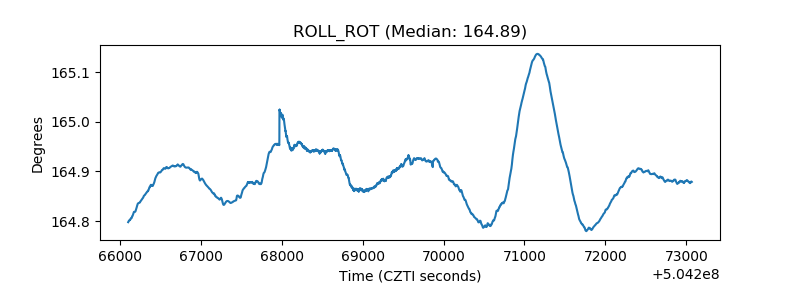 |
| _Roll_DEC | 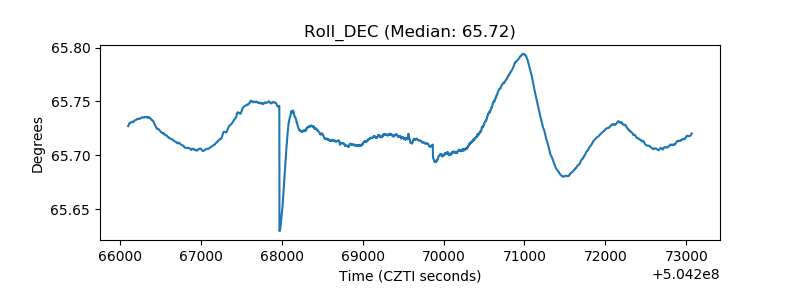 |
| _Roll_RA | 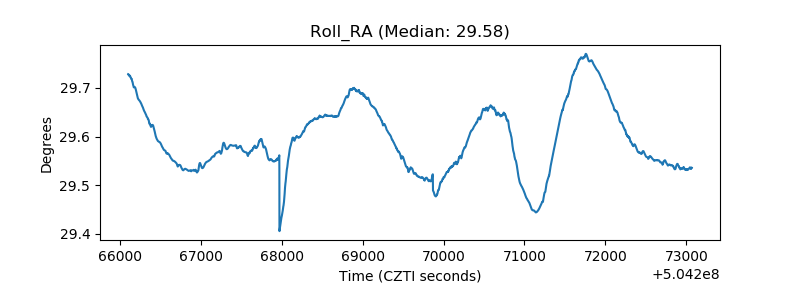 |
| Veto Counter | 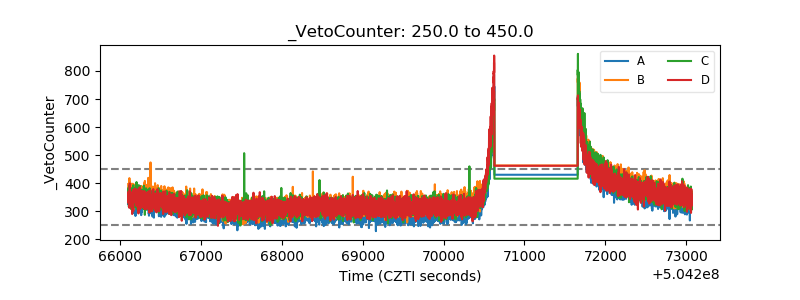 |