| Param | Original file | Final file |
|---|---|---|
| Filename | modeM0/AS1A14_099T01_9000006536_55401cztM0_level2.fits | modeM0/AS1A14_099T01_9000006536_55401cztM0_level2_quad_clean.evt |
| Size (bytes) | 451,601,280 | 88,194,240 |
| Size | 430.7 MB | 84.1 MB |
| Events in quadrant A | 3,332,803 | 605,859 |
| Events in quadrant B | 2,809,508 | 645,488 |
| Events in quadrant C | 3,506,533 | 543,627 |
| Events in quadrant D | 6,591,562 | 447,989 |
| Mode M9 | |||
|---|---|---|---|
| Quadrant | BADHDUFLAG | Total packets | Discarded packets |
| A | 0 | 12 | 0 |
| B | 0 | 12 | 0 |
| C | 0 | 12 | 0 |
| D | 0 | 12 | 0 |
| Mode SS | |||
|---|---|---|---|
| Quadrant | BADHDUFLAG | Total packets | Discarded packets |
| A | 0 | 124 | 0 |
| B | 0 | 124 | 0 |
| C | 0 | 124 | 0 |
| D | 0 | 124 | 0 |
| Mode M0 | |||
|---|---|---|---|
| Quadrant | BADHDUFLAG | Total packets | Discarded packets |
| A | 0 | 14303 | 1 |
| B | 0 | 12904 | 2 |
| C | 0 | 14940 | 1 |
| D | 0 | 23837 | 1 |
| Quadrant | Total seconds | Saturated seconds | Saturation percentage |
|---|---|---|---|
| A | 6123 | 110 | 1.796505% |
| B | 6122 | 82 | 1.339432% |
| C | 6123 | 353 | 5.765148% |
| D | 6123 | 1157 | 18.895966% |
Noise dominated data is calculated using 1-second bins in cleaned event files. If a bin has >2000 counts, and if more than 50% of those come from <1% of pixels, then it is considered to be noise-dominated and hence unusable.
| Quadrant | # 1 sec bins | Bins with >0 counts | Bins with >2000 counts | High rate bins dominated by noise | Noise dominated (total time) | Noise dominated (detector-on time) | Marked lightcurve |
|---|---|---|---|---|---|---|---|
| A | 7242 | 6123 | 35 | 35 | 0.48% | 0.57% | 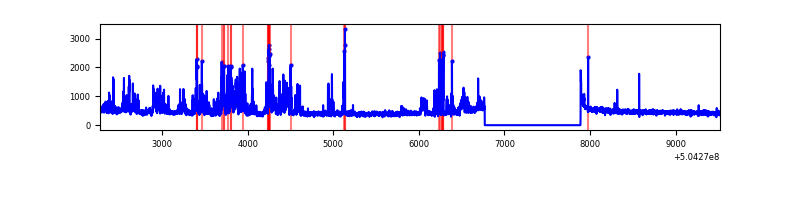 |
| B | 7241 | 6122 | 17 | 17 | 0.23% | 0.28% | 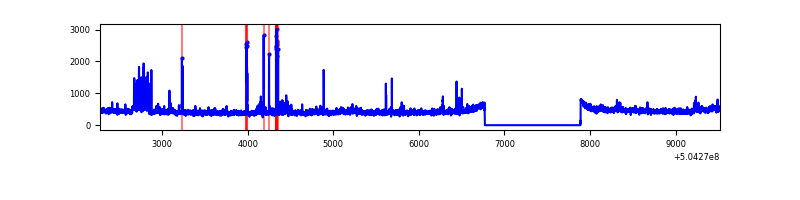 |
| C | 7243 | 6124 | 172 | 172 | 2.37% | 2.81% | 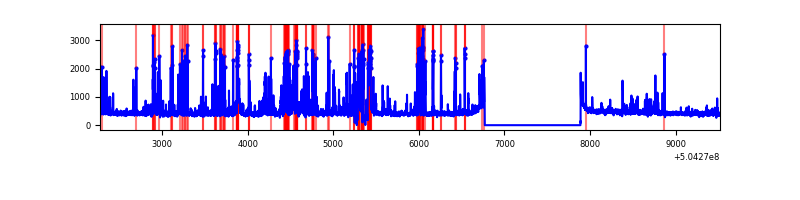 |
| D | 7243 | 6124 | 1162 | 1162 | 16.04% | 18.97% | 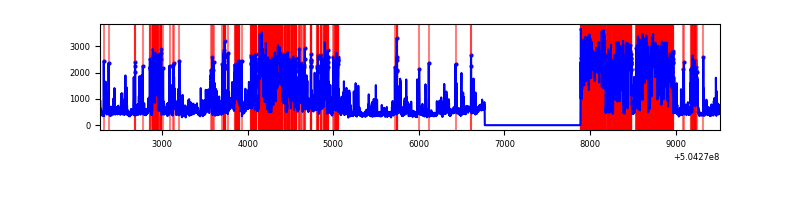 |
Top three noisy pixels from each quadrant. If the there are fewer than three noisy pixels in the level2.evt file, extra rows are filled as -1
| Pixel properties | Quadrant properties | ||||||
|---|---|---|---|---|---|---|---|
| Quadrant | DetID | PixID | Counts | Sigma | Mean | Median | Sigma |
| A | 4 | 159 | 498956 | 3083.47 | 654 | 638 | 161.6 |
| A | 0 | 8 | 158823 | 978.81 | 654 | 638 | 161.6 |
| A | 5 | 242 | 66462 | 407.3 | 654 | 638 | 161.6 |
| B | 5 | 236 | 105381 | 771.56 | 642 | 619 | 135.8 |
| B | 5 | 185 | 76848 | 561.42 | 642 | 619 | 135.8 |
| B | 5 | 172 | 31933 | 230.62 | 642 | 619 | 135.8 |
| C | 13 | 3 | 877170 | 5201.69 | 613 | 606 | 168.5 |
| C | 12 | 249 | 95905 | 565.52 | 613 | 606 | 168.5 |
| C | 12 | 2 | 48379 | 283.49 | 613 | 606 | 168.5 |
| D | 8 | 160 | 2145929 | 13100.38 | 577 | 552 | 163.8 |
| D | 11 | 129 | 1614007 | 9852.29 | 577 | 552 | 163.8 |
| D | 2 | 249 | 228328 | 1390.88 | 577 | 552 | 163.8 |
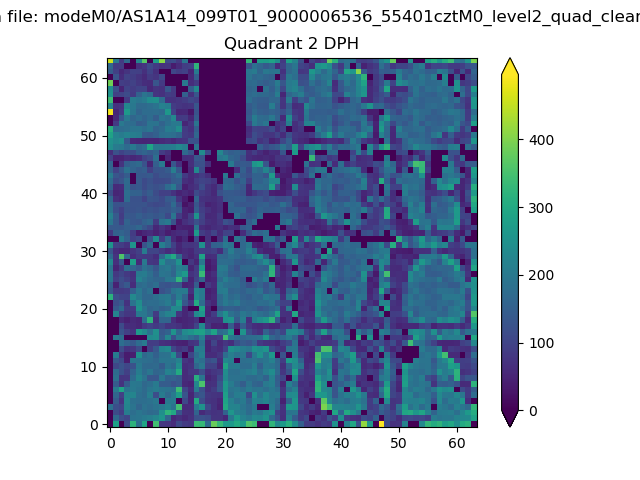
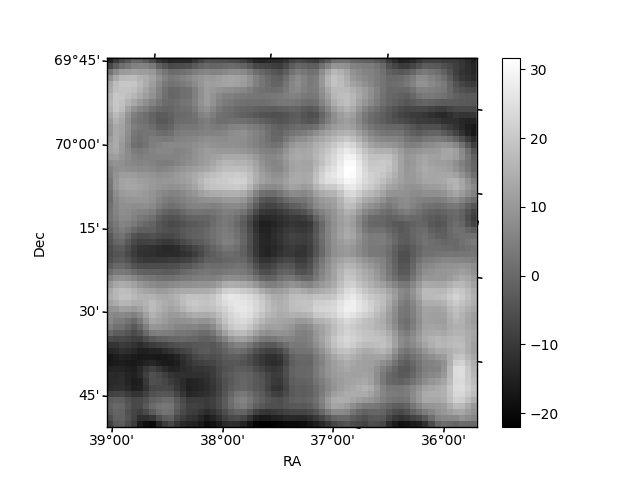
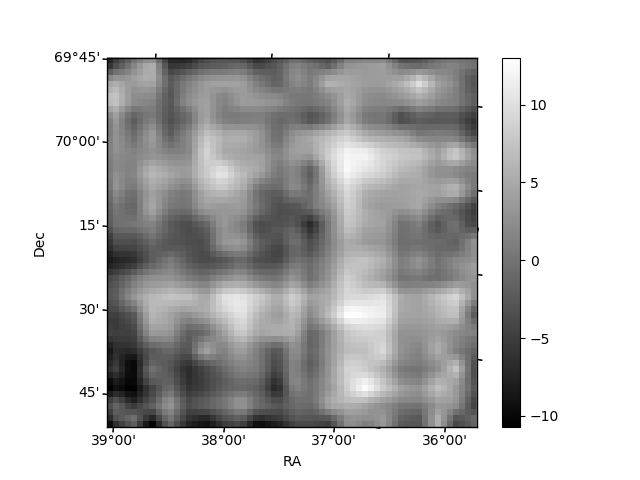
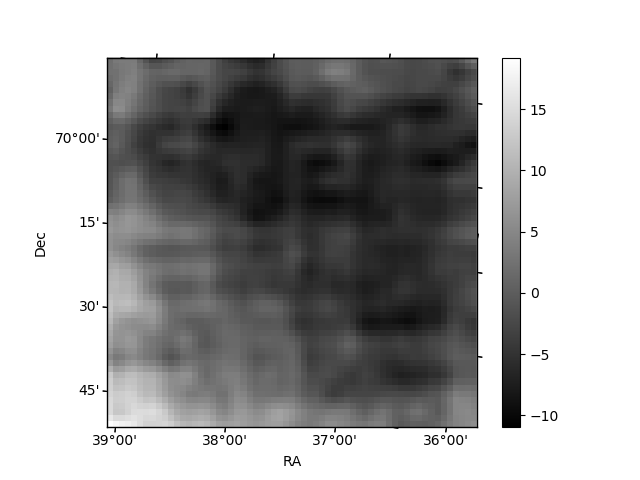
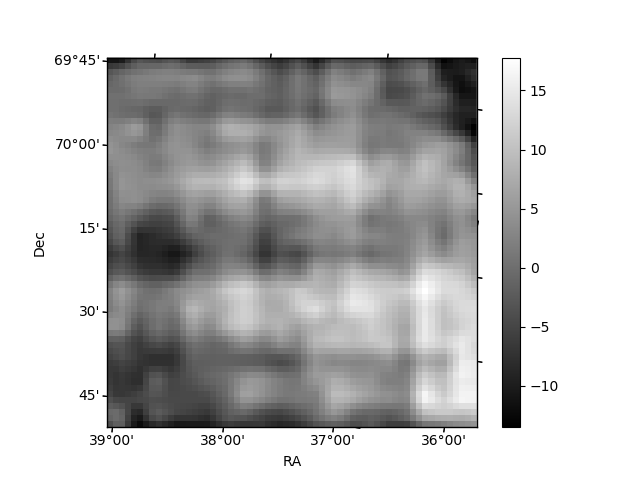
Histogram calculated using DETX and DETY for each event in the final _common_clean file
| Quadrant A | 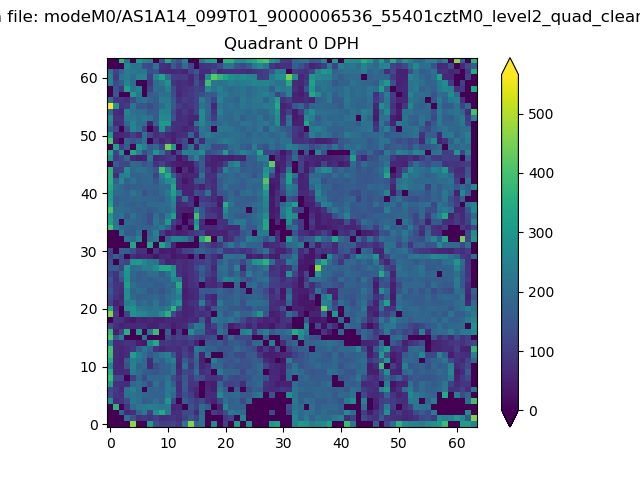 |
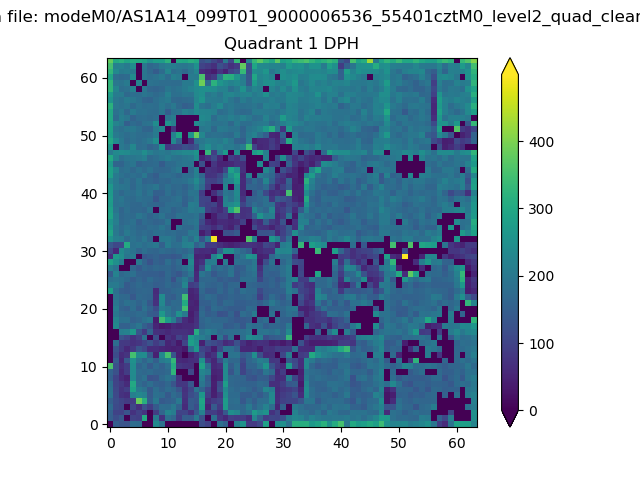 |
Quadrant B |
|---|---|---|---|
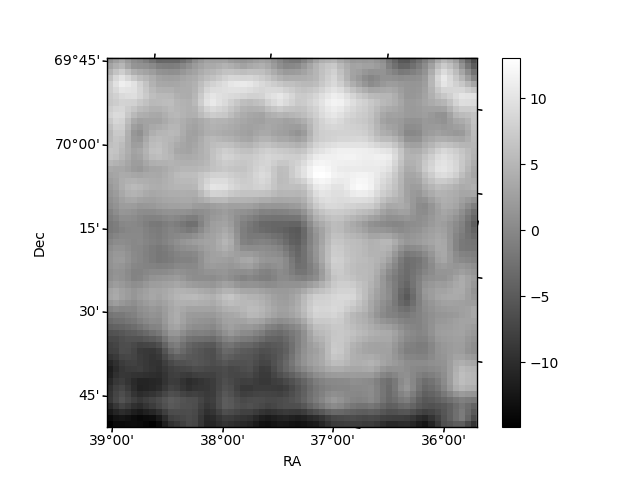
| Quadrant D | 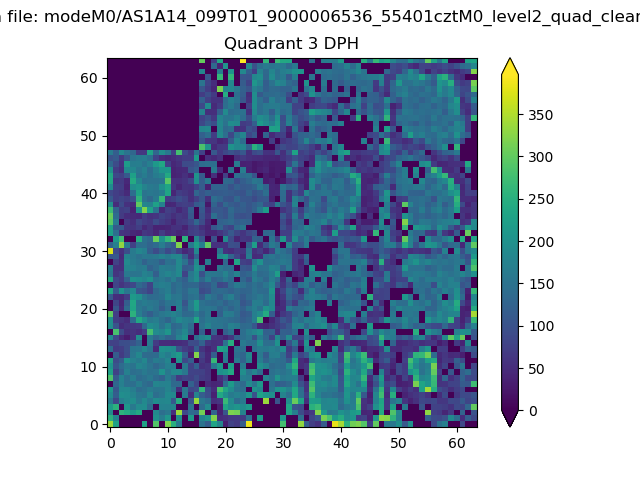 |
 |
Quadrant C |
| Plot type | Count rate plots | Images |
|---|---|---|
| Comparison with Poisson distribution Blue bars denote a histogram of data divided into 1 sec bins. Red curve is a Poisson curve with rate = median count rate of data. |
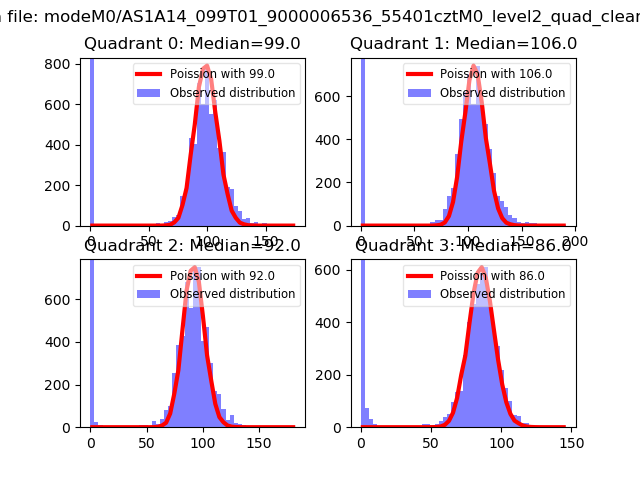 |
 |
| Quadrant-wise count rates Data is divided into 100 sec bins |
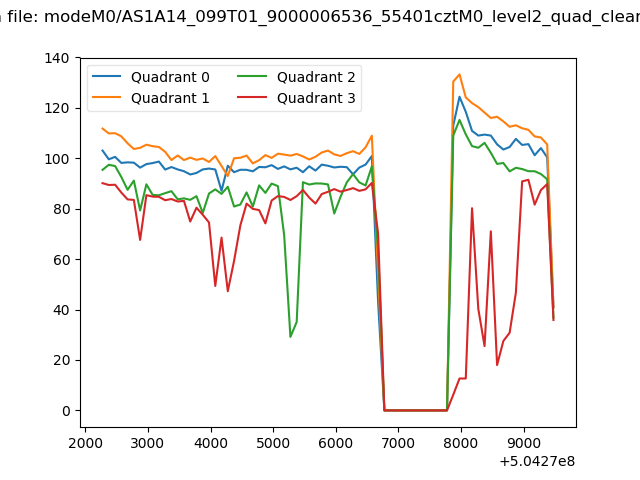 |
|
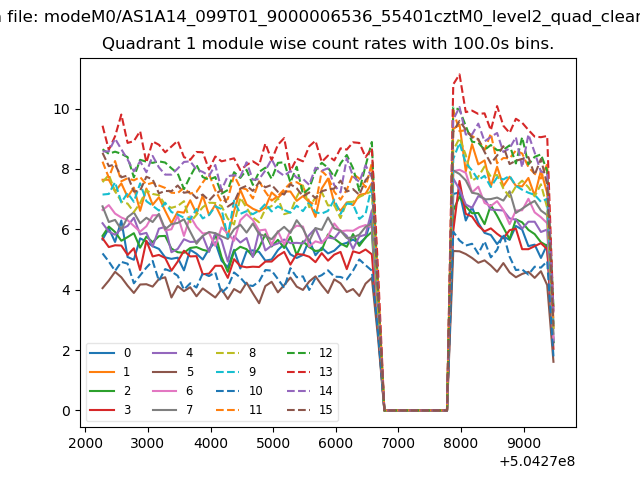
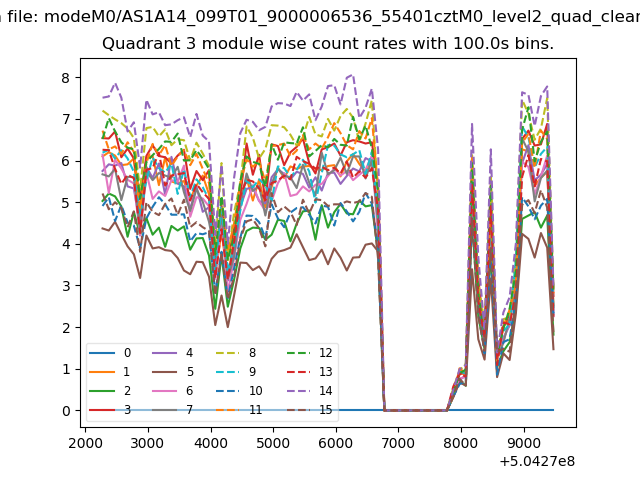
| Module-wise count rates for Quadrant A Data is divided into 100 sec bins |
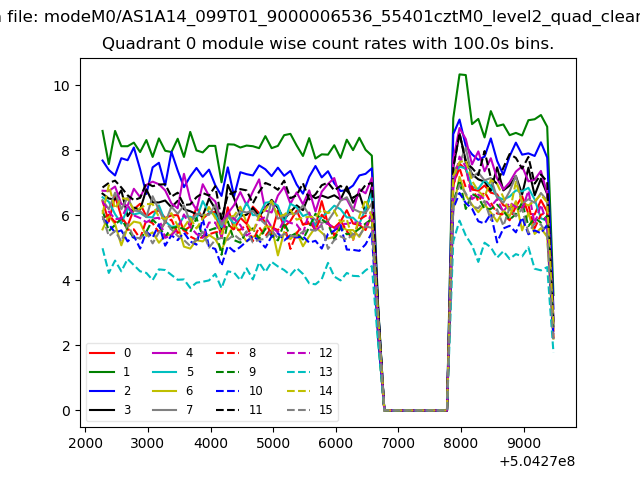 |
 |
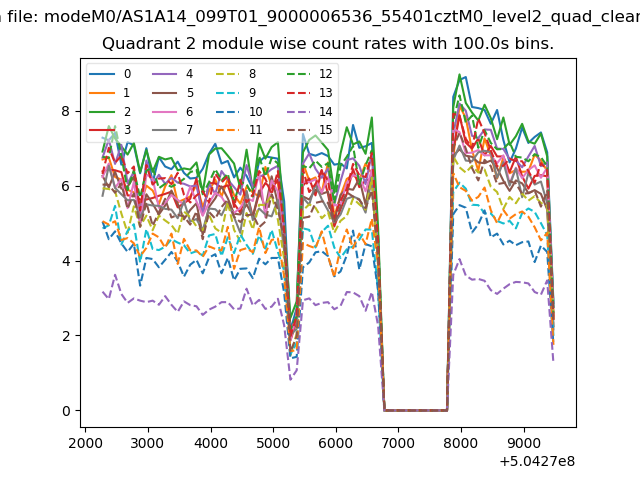
| Module-wise count rates for Quadrant B Data is divided into 100 sec bins |
 |
 |
| Module-wise count rates for Quadrant C Data is divided into 100 sec bins |
 |
 |
| Module-wise count rates for Quadrant D Data is divided into 100 sec bins |
 |
 |
| Parameter | Plot |
|---|---|
| CZT HV Monitor | 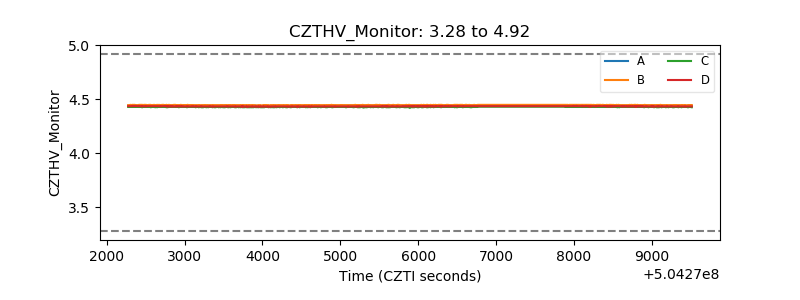 |
| D_VDD | 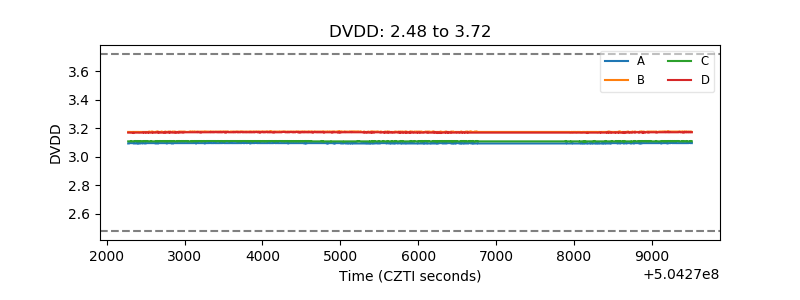 |
| Temperature 1 | 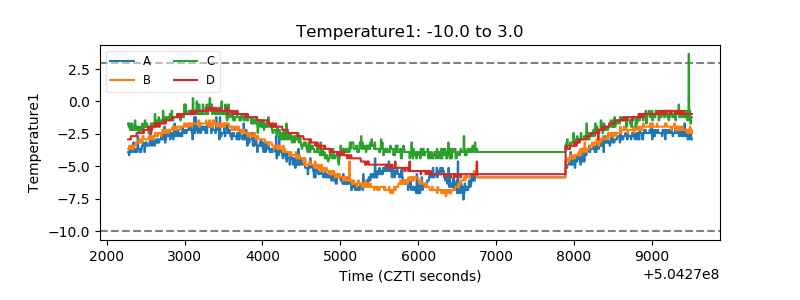 |
| Veto HV Monitor | 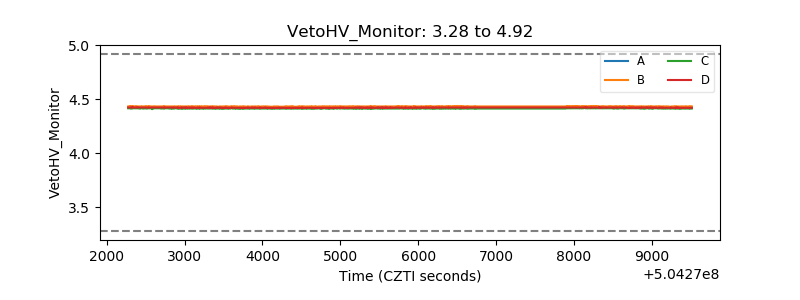 |
| Veto LLD | 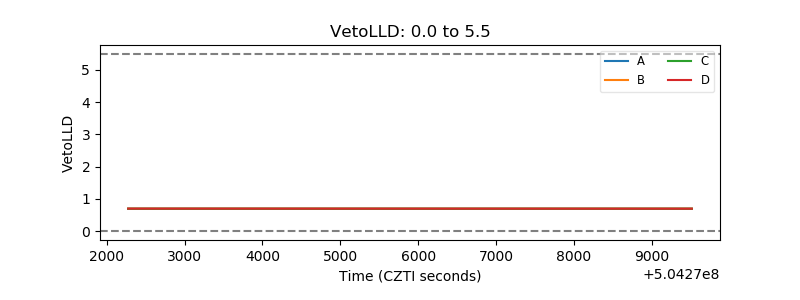 |
| Alpha Counter | 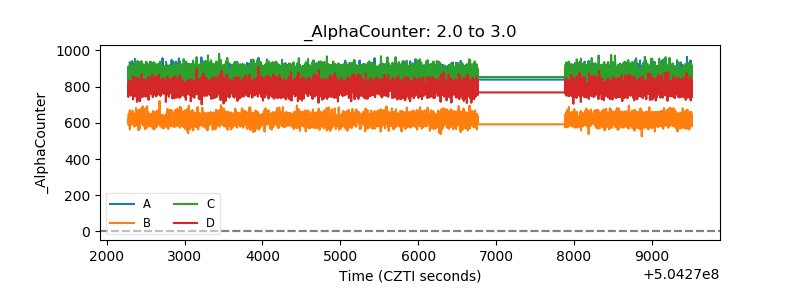 |
| _CPM_Rate | 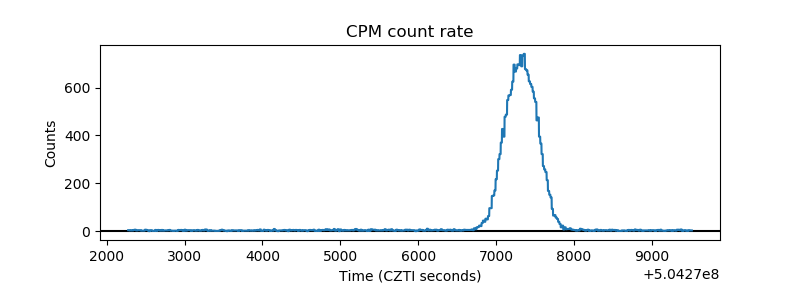 |
| CZT Counter | 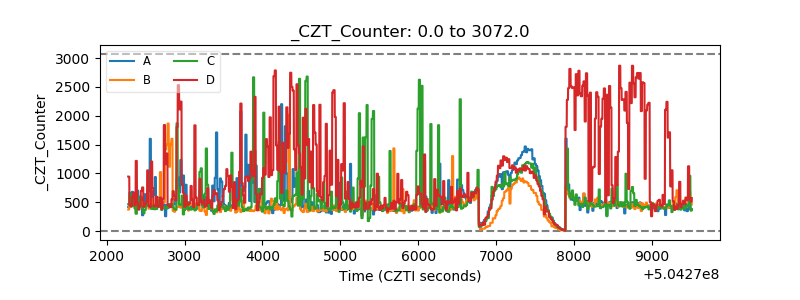 |
| +2.5 Volts monitor | 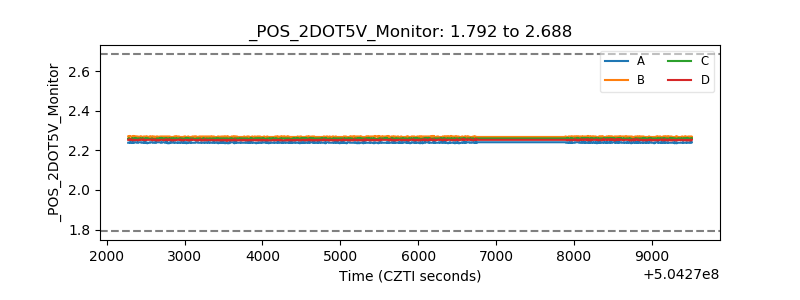 |
| +5 Volts monitor | 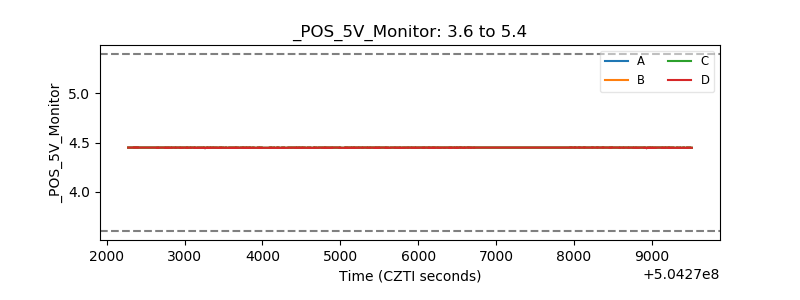 |
| _ROLL_ROT | 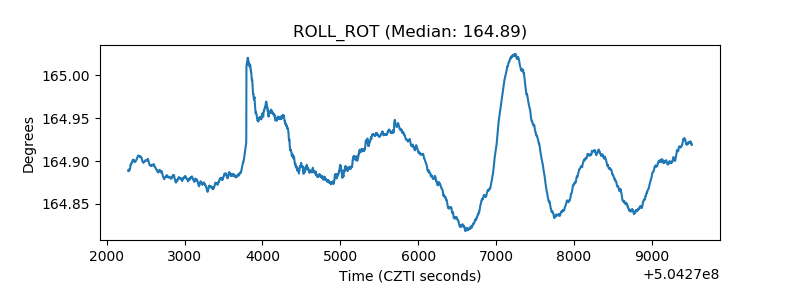 |
| _Roll_DEC | 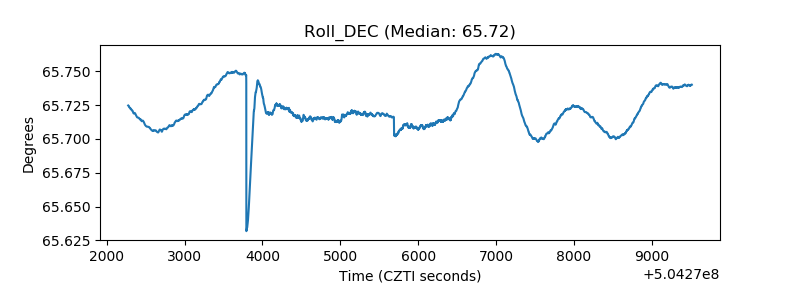 |
| _Roll_RA | 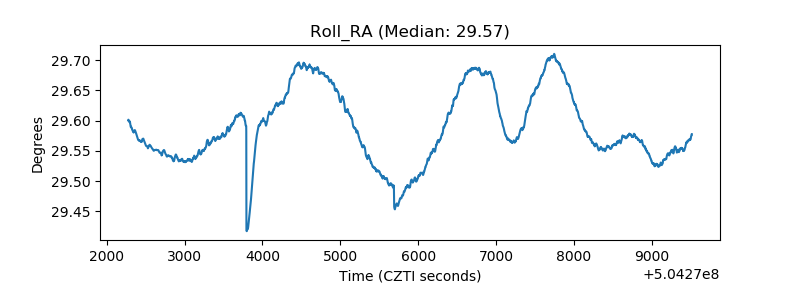 |
| Veto Counter | 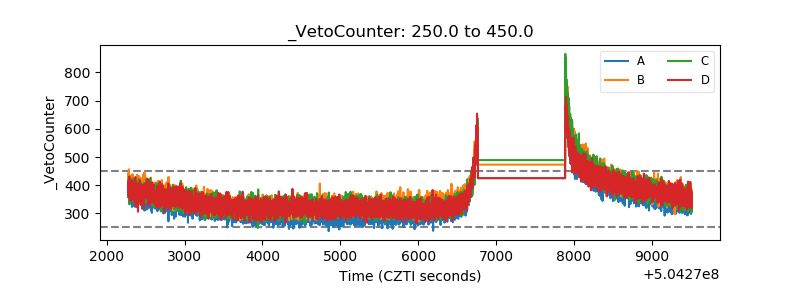 |