| Param | Original file | Final file |
|---|---|---|
| Filename | modeM0/AS1A14_099T01_9000006536_55403cztM0_level2.fits | modeM0/AS1A14_099T01_9000006536_55403cztM0_level2_quad_clean.evt |
| Size (bytes) | 450,538,560 | 97,948,800 |
| Size | 429.7 MB | 93.4 MB |
| Events in quadrant A | 3,677,164 | 659,015 |
| Events in quadrant B | 2,879,219 | 711,447 |
| Events in quadrant C | 2,953,422 | 632,229 |
| Events in quadrant D | 6,654,233 | 503,201 |
| Mode M9 | |||
|---|---|---|---|
| Quadrant | BADHDUFLAG | Total packets | Discarded packets |
| A | 0 | 12 | 0 |
| B | 0 | 12 | 0 |
| C | 0 | 13 | 0 |
| D | 0 | 13 | 0 |
| Mode SS | |||
|---|---|---|---|
| Quadrant | BADHDUFLAG | Total packets | Discarded packets |
| A | 0 | 134 | 0 |
| B | 0 | 134 | 0 |
| C | 0 | 134 | 0 |
| D | 0 | 134 | 0 |
| Mode M0 | |||
|---|---|---|---|
| Quadrant | BADHDUFLAG | Total packets | Discarded packets |
| A | 0 | 15875 | 2 |
| B | 0 | 13533 | 2 |
| C | 0 | 13832 | 2 |
| D | 0 | 24420 | 2 |
| Quadrant | Total seconds | Saturated seconds | Saturation percentage |
|---|---|---|---|
| A | 6598 | 163 | 2.470446% |
| B | 6598 | 36 | 0.545620% |
| C | 6597 | 42 | 0.636653% |
| D | 6597 | 1171 | 17.750493% |
Noise dominated data is calculated using 1-second bins in cleaned event files. If a bin has >2000 counts, and if more than 50% of those come from <1% of pixels, then it is considered to be noise-dominated and hence unusable.
| Quadrant | # 1 sec bins | Bins with >0 counts | Bins with >2000 counts | High rate bins dominated by noise | Noise dominated (total time) | Noise dominated (detector-on time) | Marked lightcurve |
|---|---|---|---|---|---|---|---|
| A | 7788 | 6599 | 117 | 117 | 1.50% | 1.77% | 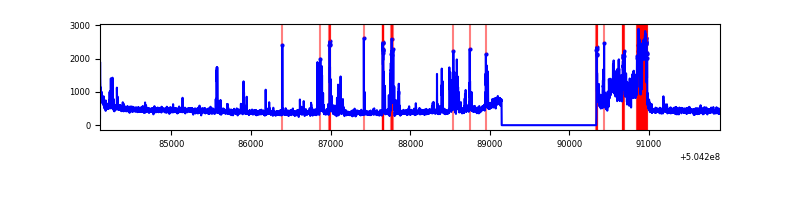 |
| B | 7788 | 6599 | 3 | 3 | 0.04% | 0.05% | 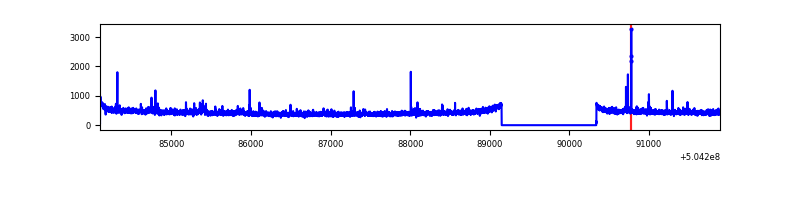 |
| C | 7787 | 6598 | 12 | 12 | 0.15% | 0.18% | 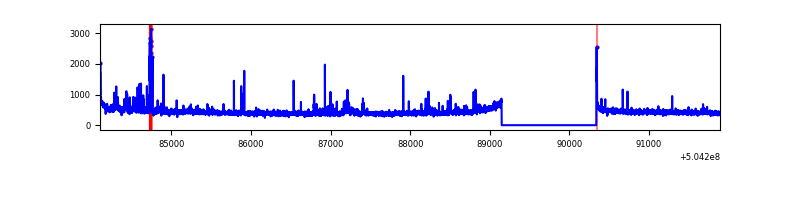 |
| D | 7787 | 6598 | 1159 | 1159 | 14.88% | 17.57% | 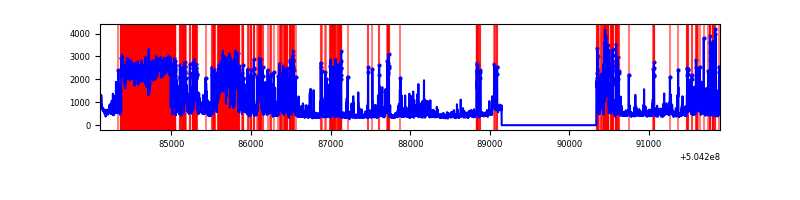 |
Top three noisy pixels from each quadrant. If the there are fewer than three noisy pixels in the level2.evt file, extra rows are filled as -1
| Pixel properties | Quadrant properties | ||||||
|---|---|---|---|---|---|---|---|
| Quadrant | DetID | PixID | Counts | Sigma | Mean | Median | Sigma |
| A | 12 | 115 | 462142 | 2637.59 | 710 | 691 | 175.0 |
| A | 7 | 14 | 180414 | 1027.27 | 710 | 691 | 175.0 |
| A | 0 | 8 | 134055 | 762.29 | 710 | 691 | 175.0 |
| B | 5 | 236 | 30848 | 203.81 | 702 | 678 | 148.0 |
| B | 5 | 172 | 26904 | 177.17 | 702 | 678 | 148.0 |
| B | 10 | 247 | 19210 | 125.19 | 702 | 678 | 148.0 |
| C | 9 | 38 | 65403 | 339.61 | 697 | 689 | 190.6 |
| C | 12 | 2 | 47449 | 245.39 | 697 | 689 | 190.6 |
| C | 13 | 3 | 26127 | 133.49 | 697 | 689 | 190.6 |
| D | 11 | 129 | 1471210 | 8029.91 | 646 | 617 | 183.1 |
| D | 10 | 181 | 1417866 | 7738.64 | 646 | 617 | 183.1 |
| D | 8 | 160 | 667666 | 3642.3 | 646 | 617 | 183.1 |
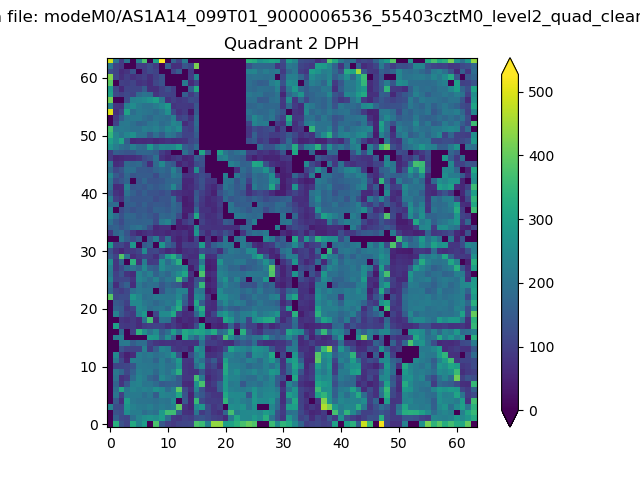
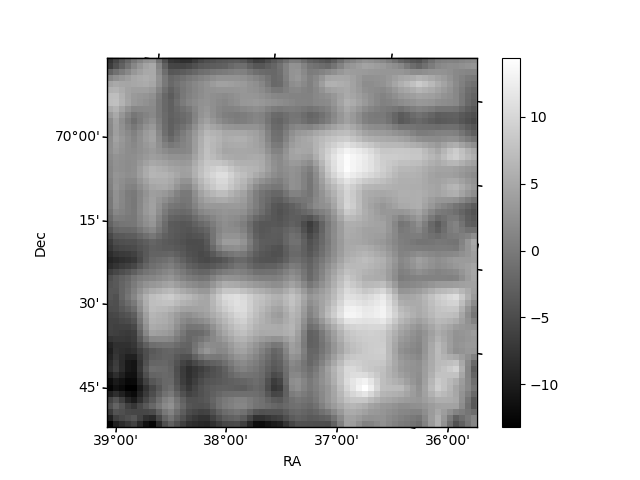
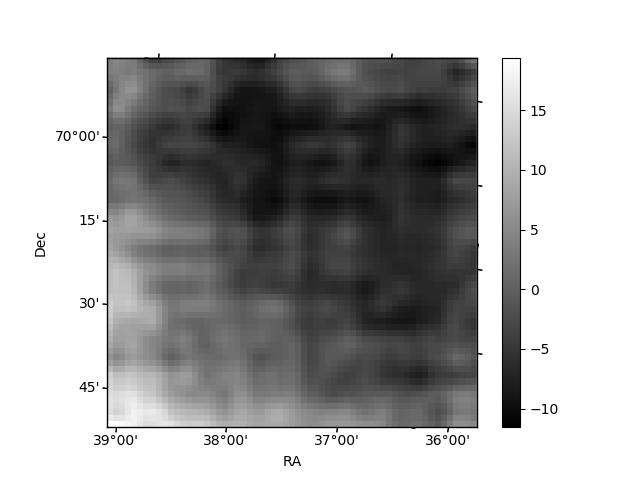
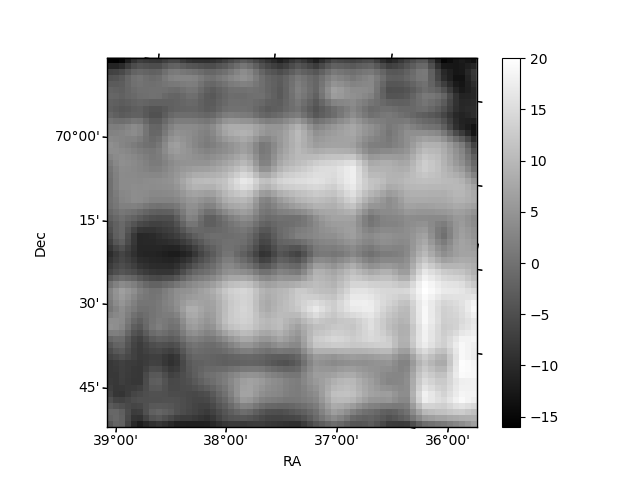
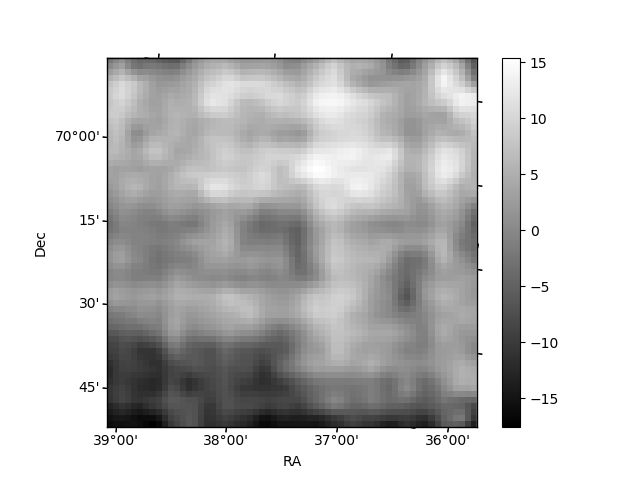
Histogram calculated using DETX and DETY for each event in the final _common_clean file
| Quadrant A | 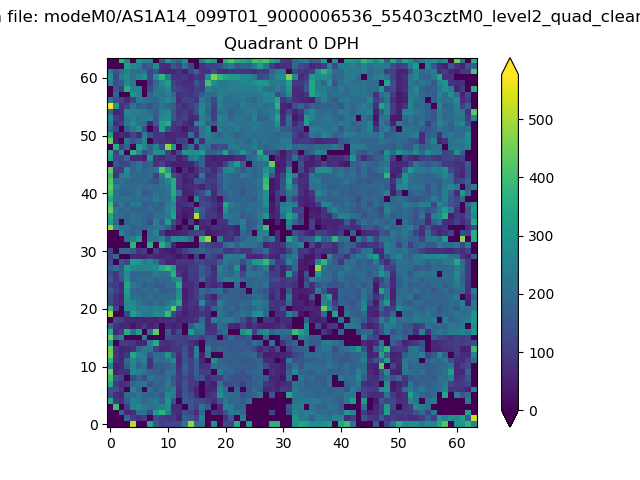 |
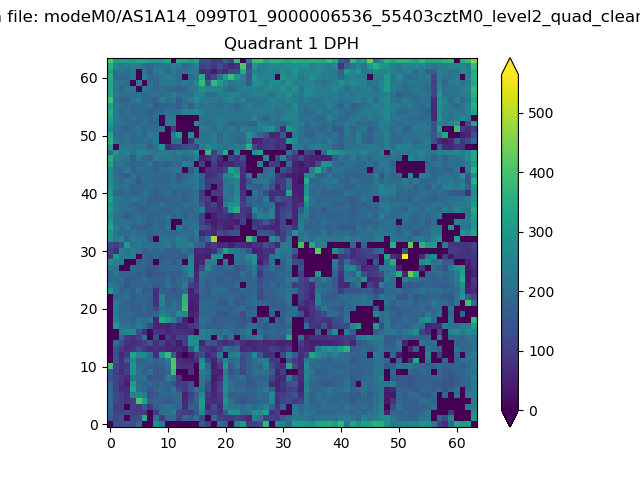 |
Quadrant B |
|---|---|---|---|
| Quadrant D | 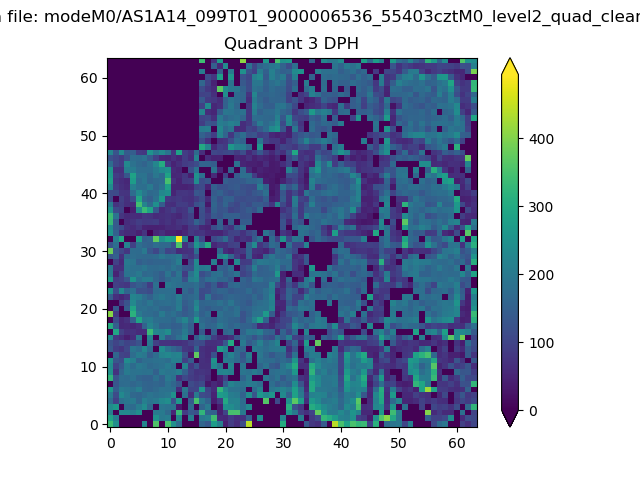 |
 |
Quadrant C |
| Plot type | Count rate plots | Images |
|---|---|---|
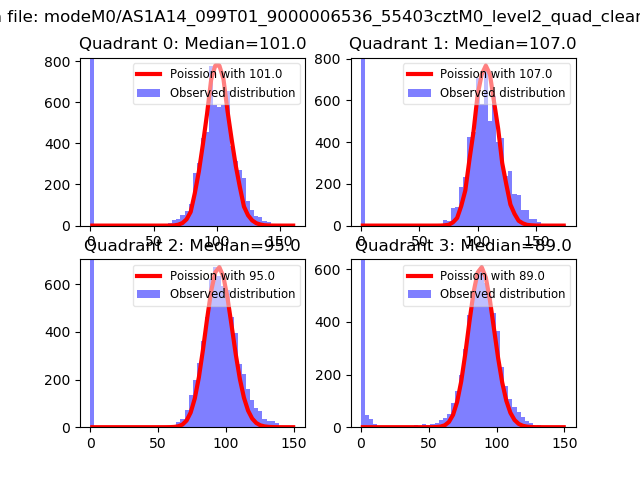
| Comparison with Poisson distribution Blue bars denote a histogram of data divided into 1 sec bins. Red curve is a Poisson curve with rate = median count rate of data. |
 |
 |
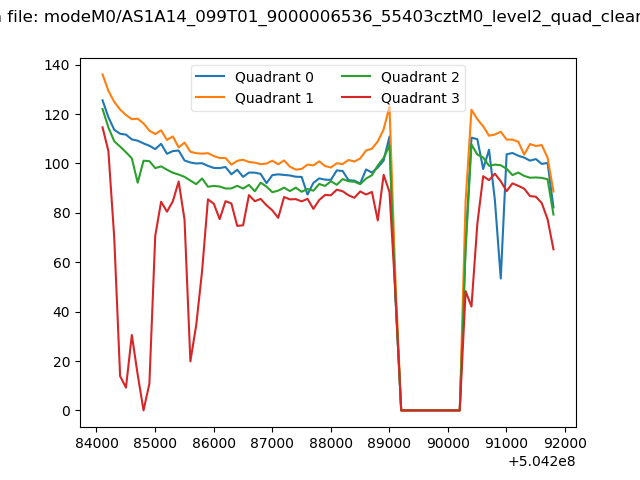
| Quadrant-wise count rates Data is divided into 100 sec bins |
 |
|
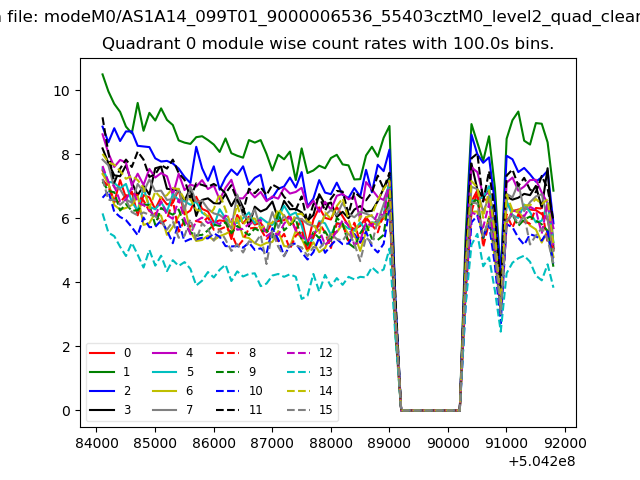
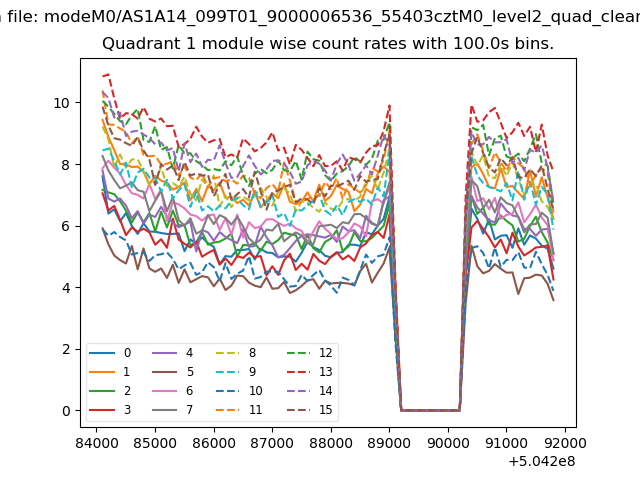
| Module-wise count rates for Quadrant A Data is divided into 100 sec bins |
 |
 |
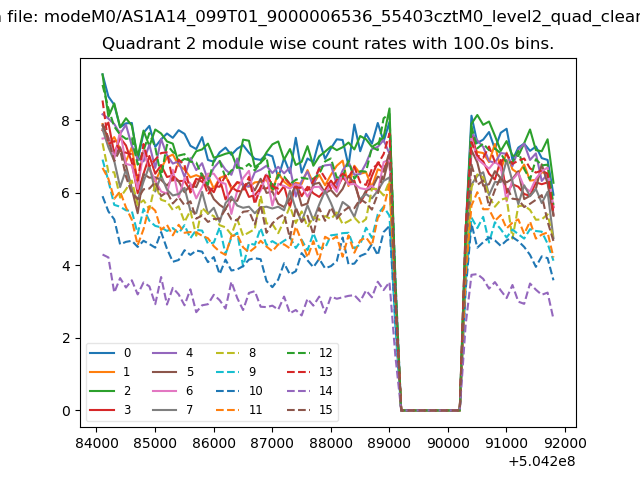
| Module-wise count rates for Quadrant B Data is divided into 100 sec bins |
 |
 |
| Module-wise count rates for Quadrant C Data is divided into 100 sec bins |
 |
 |
| Module-wise count rates for Quadrant D Data is divided into 100 sec bins |
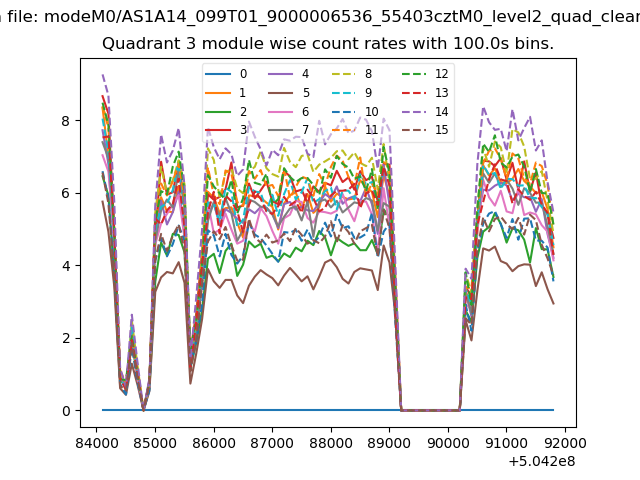 |
 |
| Parameter | Plot |
|---|---|
| CZT HV Monitor | 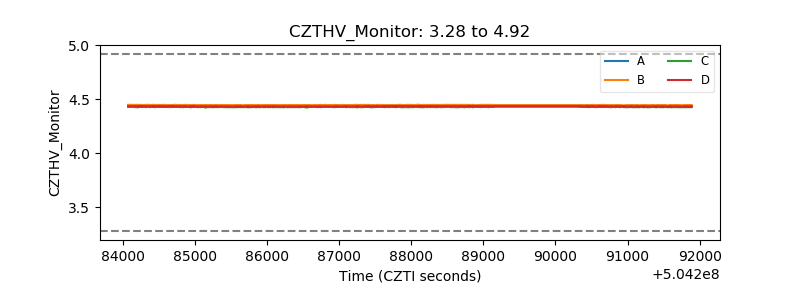 |
| D_VDD | 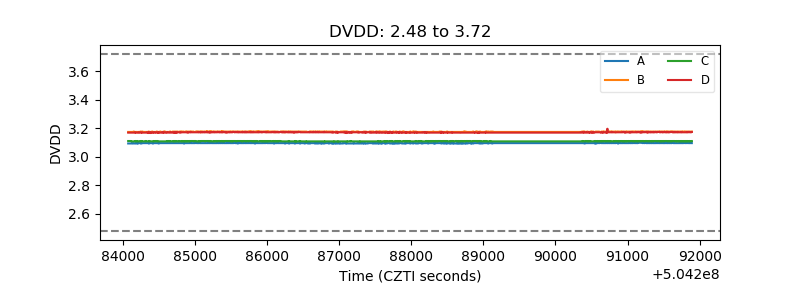 |
| Temperature 1 | 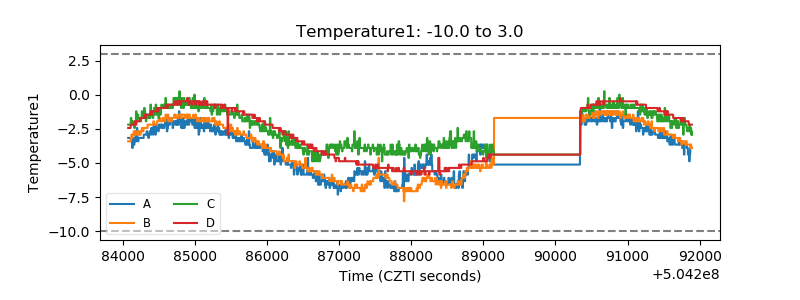 |
| Veto HV Monitor | 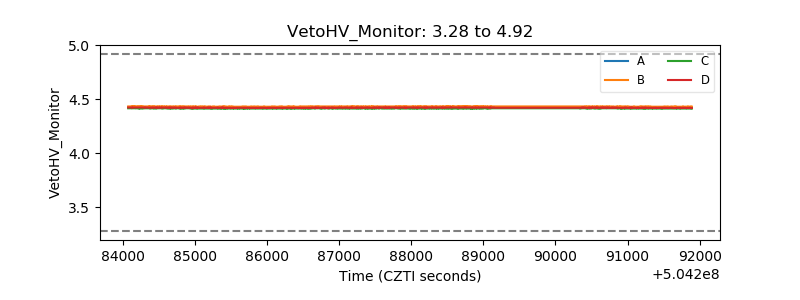 |
| Veto LLD | 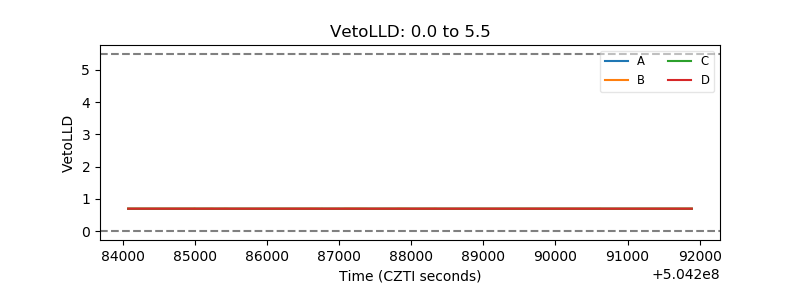 |
| Alpha Counter | 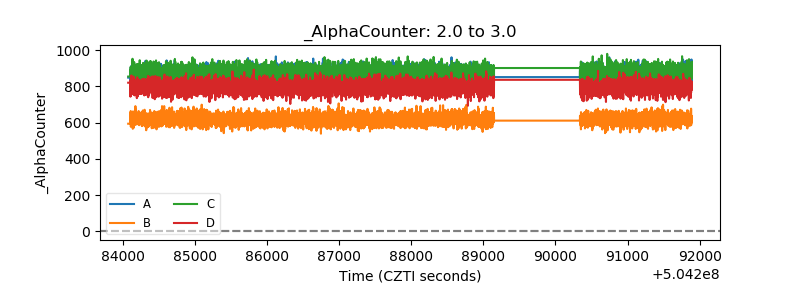 |
| _CPM_Rate | 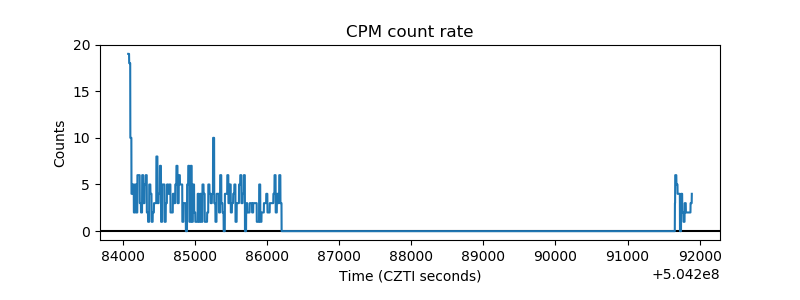 |
| CZT Counter | 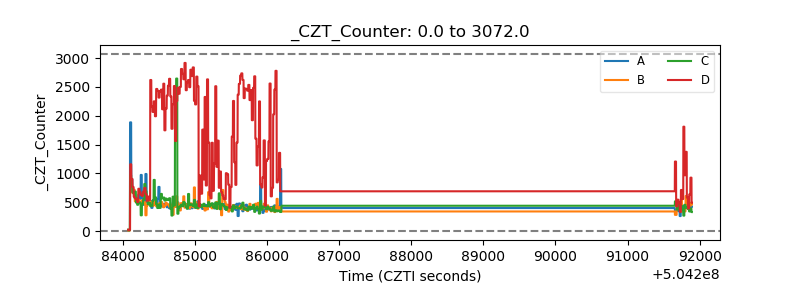 |
| +2.5 Volts monitor | 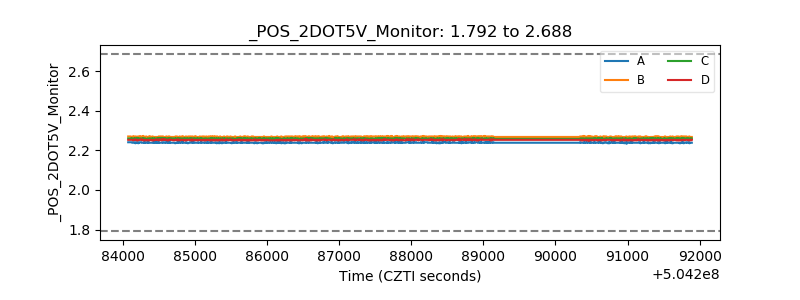 |
| +5 Volts monitor | 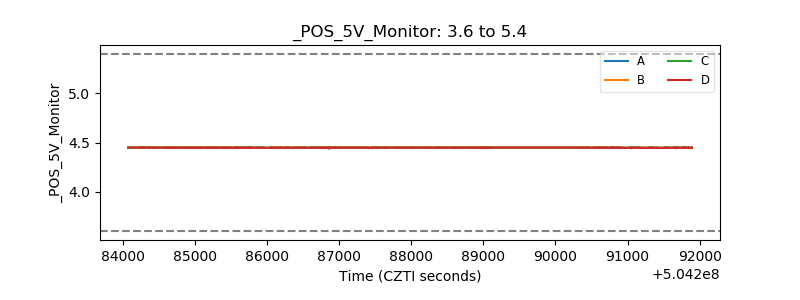 |
| _ROLL_ROT | 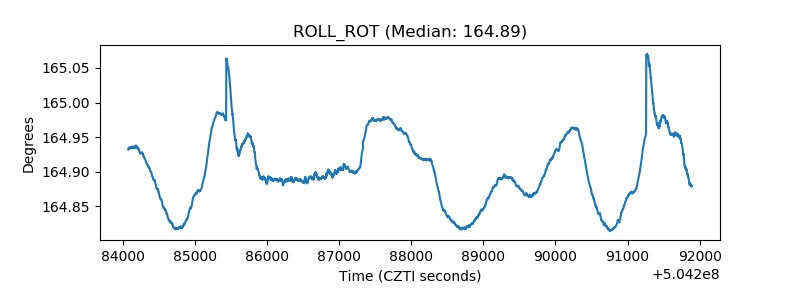 |
| _Roll_DEC | 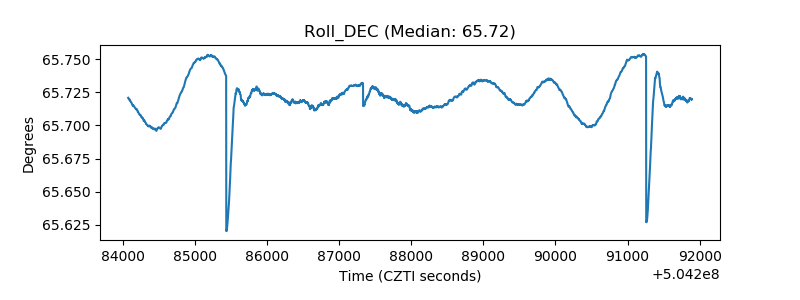 |
| _Roll_RA | 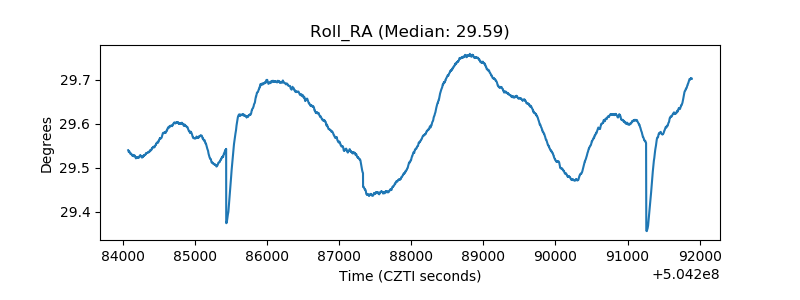 |
| Veto Counter | 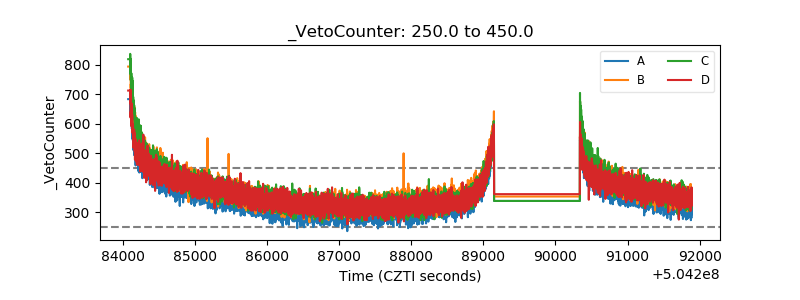 |