| Param | Original file | Final file |
|---|---|---|
| Filename | modeM0/AS1A14_099T01_9000006536_55405cztM0_level2.fits | modeM0/AS1A14_099T01_9000006536_55405cztM0_level2_quad_clean.evt |
| Size (bytes) | 461,401,920 | 97,842,240 |
| Size | 440.0 MB | 93.3 MB |
| Events in quadrant A | 4,043,564 | 647,167 |
| Events in quadrant B | 3,222,052 | 696,940 |
| Events in quadrant C | 3,188,170 | 623,774 |
| Events in quadrant D | 6,089,690 | 515,036 |
| Mode M9 | |||
|---|---|---|---|
| Quadrant | BADHDUFLAG | Total packets | Discarded packets |
| A | 0 | 16 | 0 |
| B | 0 | 16 | 0 |
| C | 0 | 17 | 0 |
| D | 0 | 17 | 0 |
| Mode SS | |||
|---|---|---|---|
| Quadrant | BADHDUFLAG | Total packets | Discarded packets |
| A | 0 | 138 | 0 |
| B | 0 | 138 | 0 |
| C | 0 | 138 | 0 |
| D | 0 | 138 | 0 |
| Mode M0 | |||
|---|---|---|---|
| Quadrant | BADHDUFLAG | Total packets | Discarded packets |
| A | 0 | 17077 | 8 |
| B | 0 | 14981 | 2 |
| C | 0 | 14885 | 6 |
| D | 0 | 23053 | 6 |
| Quadrant | Total seconds | Saturated seconds | Saturation percentage |
|---|---|---|---|
| A | 6891 | 188 | 2.728196% |
| B | 6892 | 107 | 1.552525% |
| C | 6889 | 44 | 0.638699% |
| D | 6891 | 1022 | 14.830939% |
Noise dominated data is calculated using 1-second bins in cleaned event files. If a bin has >2000 counts, and if more than 50% of those come from <1% of pixels, then it is considered to be noise-dominated and hence unusable.
| Quadrant | # 1 sec bins | Bins with >0 counts | Bins with >2000 counts | High rate bins dominated by noise | Noise dominated (total time) | Noise dominated (detector-on time) | Marked lightcurve |
|---|---|---|---|---|---|---|---|
| A | 7657 | 6893 | 169 | 169 | 2.21% | 2.45% | 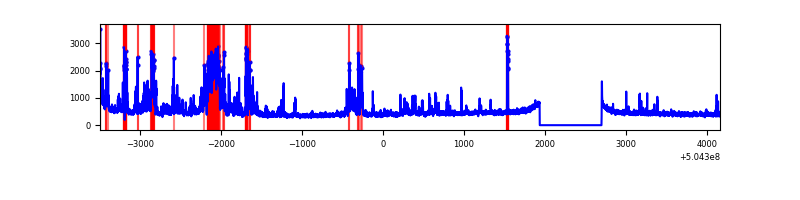 |
| B | 7657 | 6893 | 47 | 47 | 0.61% | 0.68% | 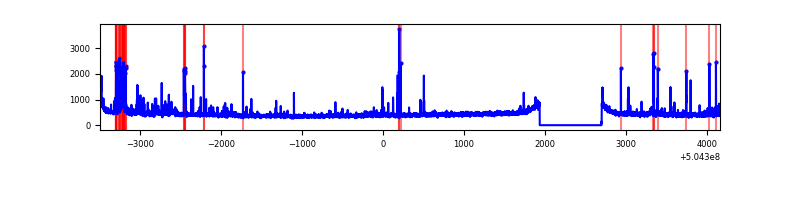 |
| C | 7657 | 6892 | 20 | 20 | 0.26% | 0.29% | 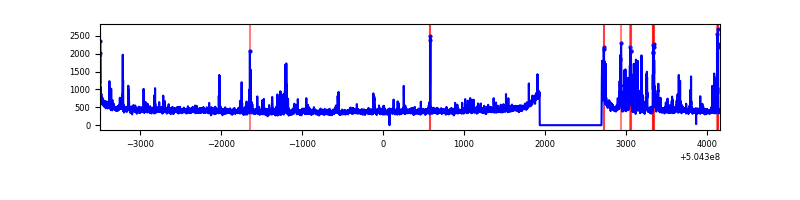 |
| D | 7657 | 6893 | 883 | 883 | 11.53% | 12.81% | 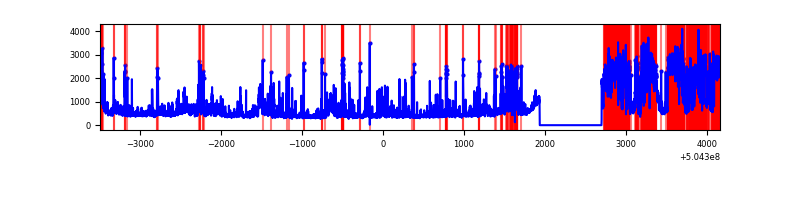 |
Top three noisy pixels from each quadrant. If the there are fewer than three noisy pixels in the level2.evt file, extra rows are filled as -1
| Pixel properties | Quadrant properties | ||||||
|---|---|---|---|---|---|---|---|
| Quadrant | DetID | PixID | Counts | Sigma | Mean | Median | Sigma |
| A | 12 | 115 | 695345 | 3902.35 | 718 | 701 | 178.0 |
| A | 4 | 159 | 357420 | 2003.96 | 718 | 701 | 178.0 |
| A | 4 | 3 | 52114 | 288.83 | 718 | 701 | 178.0 |
| B | 5 | 236 | 203783 | 1346.49 | 714 | 689 | 150.8 |
| B | 10 | 247 | 70676 | 464.01 | 714 | 689 | 150.8 |
| B | 5 | 185 | 51017 | 333.67 | 714 | 689 | 150.8 |
| C | 1 | 241 | 248254 | 1274.5 | 711 | 705 | 194.2 |
| C | 12 | 252 | 61914 | 315.13 | 711 | 705 | 194.2 |
| C | 11 | 244 | 28101 | 141.05 | 711 | 705 | 194.2 |
| D | 11 | 129 | 2802887 | 14951.48 | 657 | 628 | 187.4 |
| D | 10 | 181 | 219636 | 1168.52 | 657 | 628 | 187.4 |
| D | 8 | 160 | 95210 | 504.64 | 657 | 628 | 187.4 |
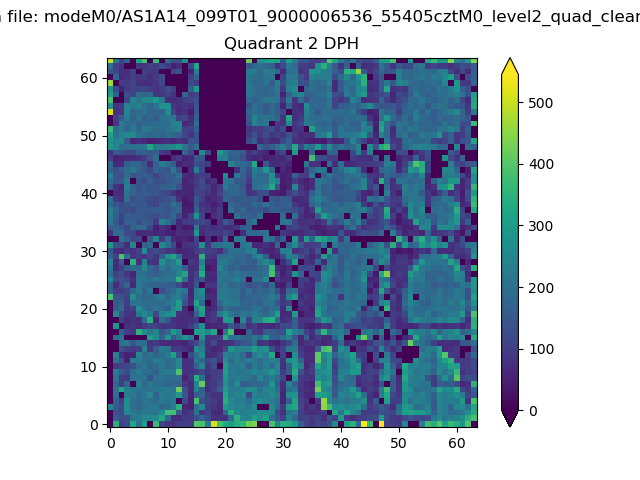
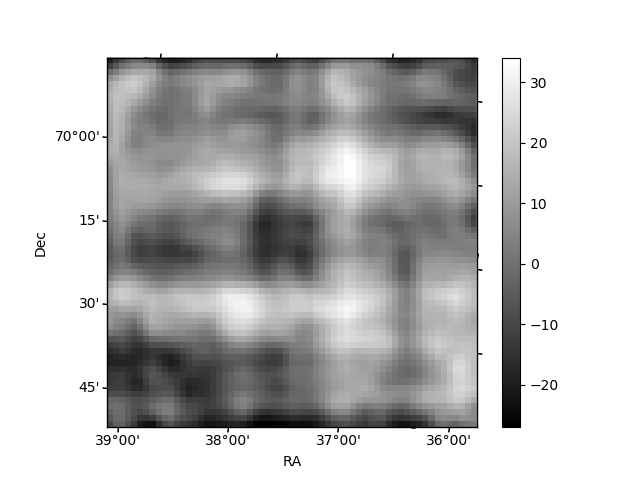
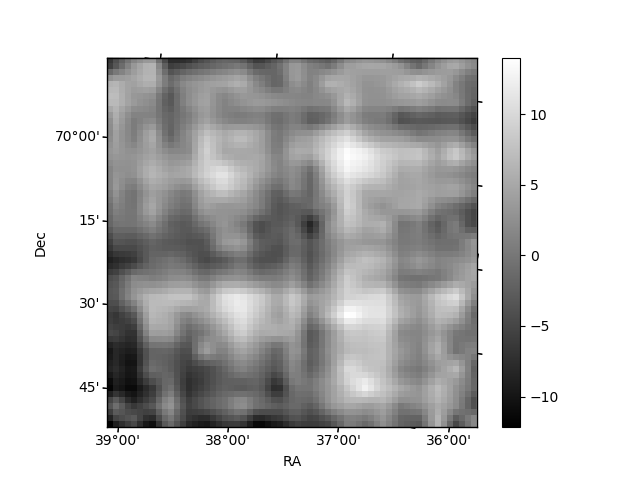
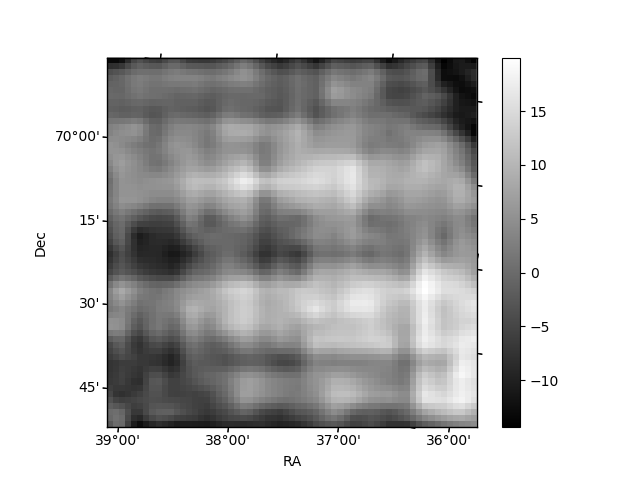
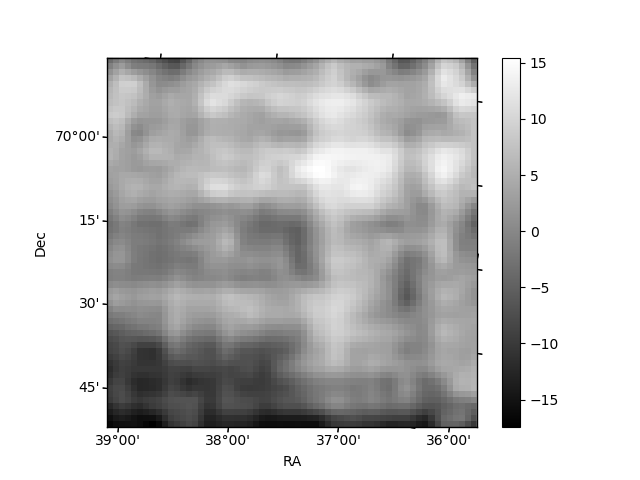
Histogram calculated using DETX and DETY for each event in the final _common_clean file
| Quadrant A | 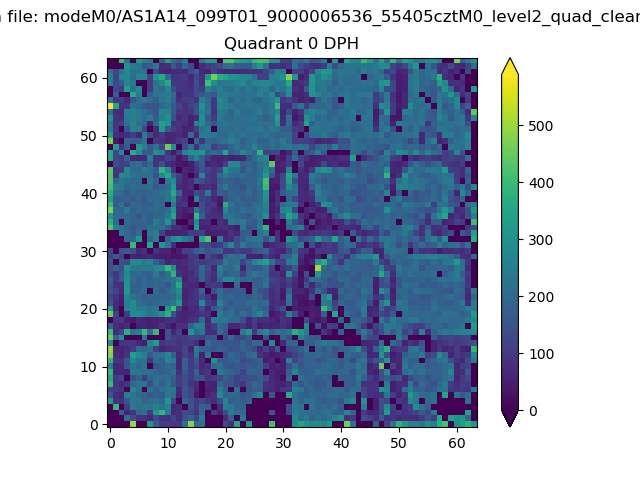 |
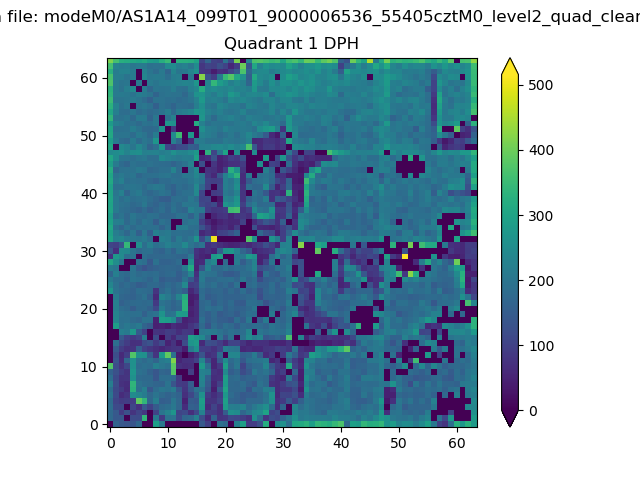 |
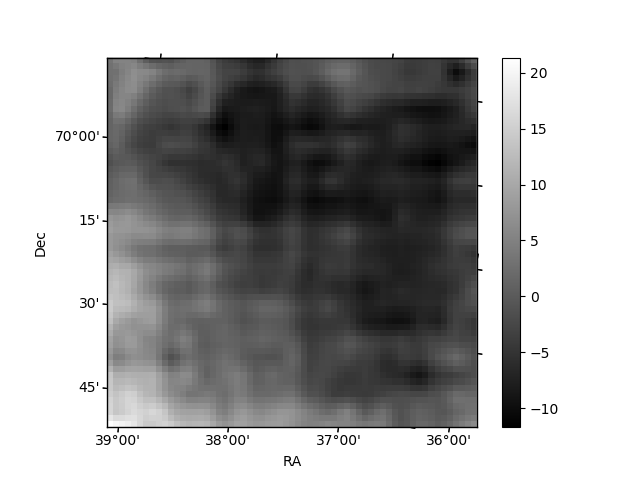
Quadrant B |
|---|---|---|---|
| Quadrant D | 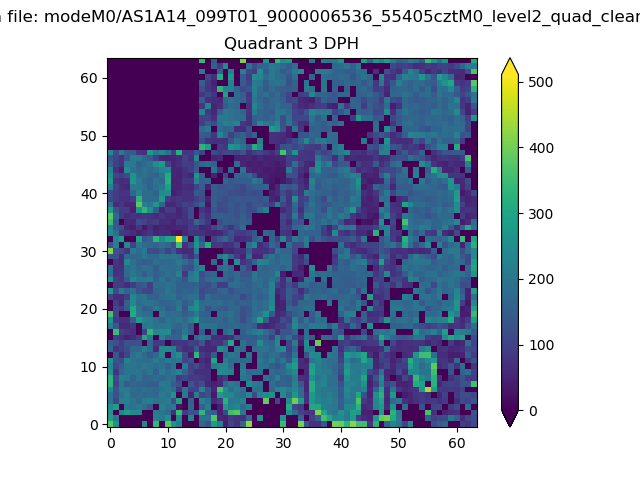 |
 |
Quadrant C |
| Plot type | Count rate plots | Images |
|---|---|---|
| Comparison with Poisson distribution Blue bars denote a histogram of data divided into 1 sec bins. Red curve is a Poisson curve with rate = median count rate of data. |
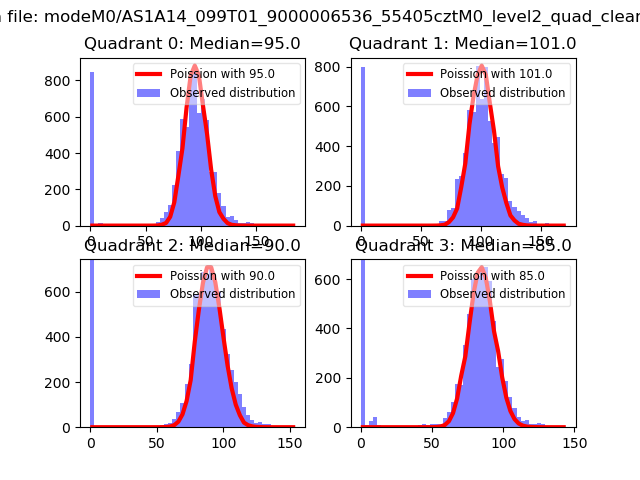 |
 |
| Quadrant-wise count rates Data is divided into 100 sec bins |
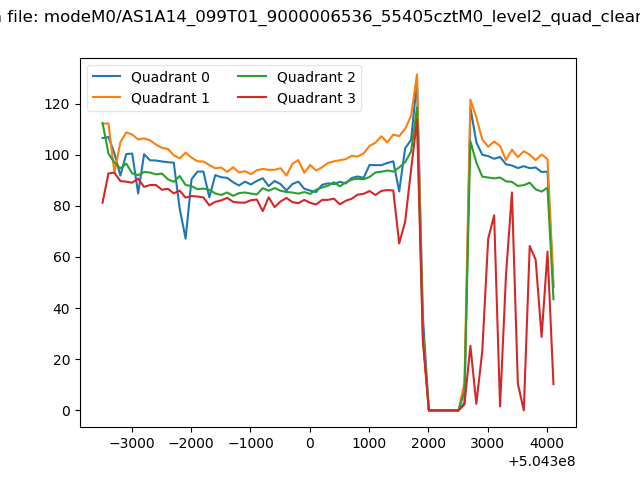 |
|
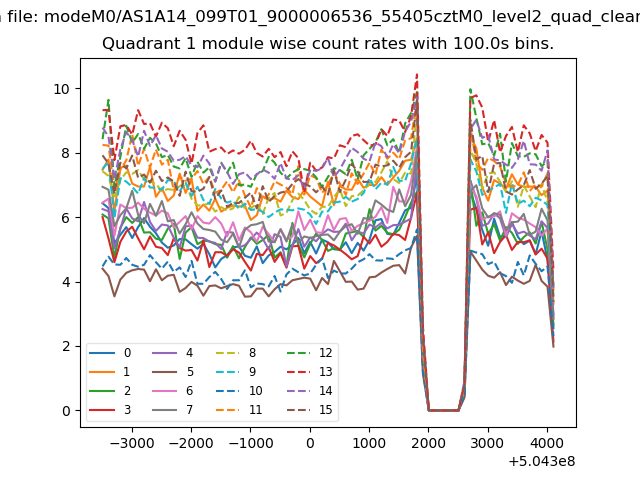
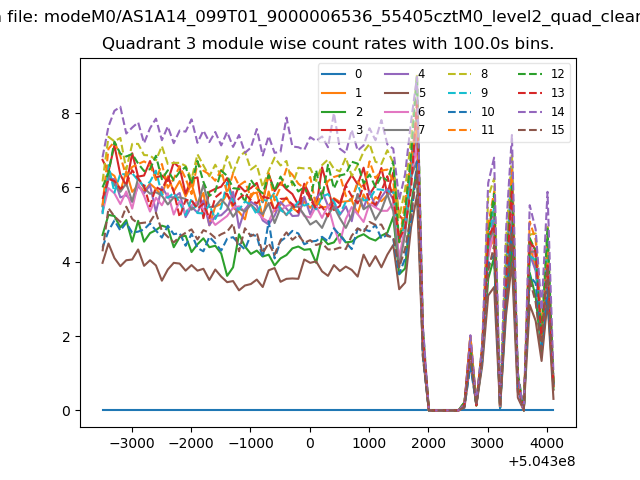
| Module-wise count rates for Quadrant A Data is divided into 100 sec bins |
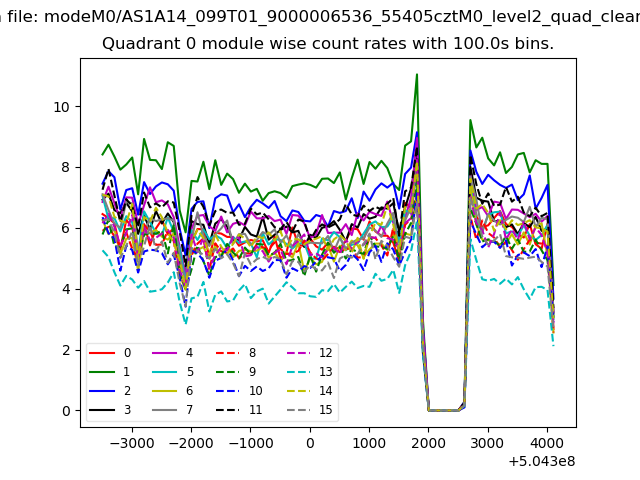 |
 |
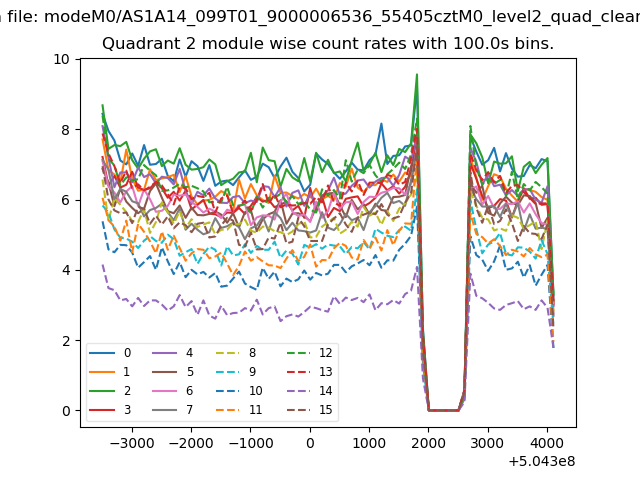
| Module-wise count rates for Quadrant B Data is divided into 100 sec bins |
 |
 |
| Module-wise count rates for Quadrant C Data is divided into 100 sec bins |
 |
 |
| Module-wise count rates for Quadrant D Data is divided into 100 sec bins |
 |
 |
| Parameter | Plot |
|---|---|
| CZT HV Monitor | 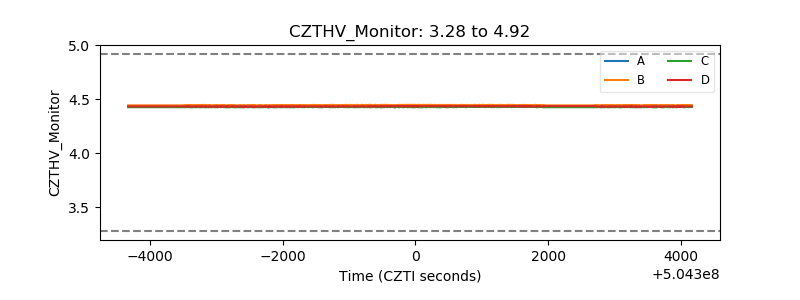 |
| D_VDD | 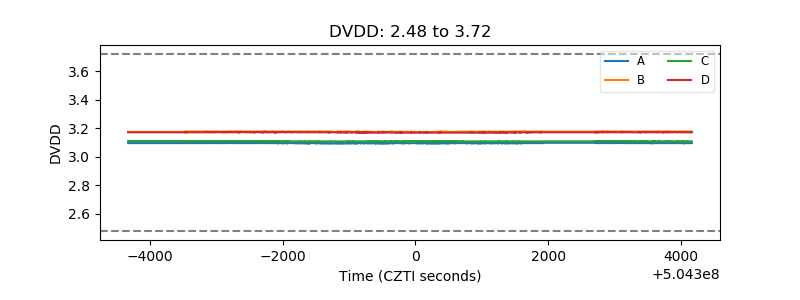 |
| Temperature 1 | 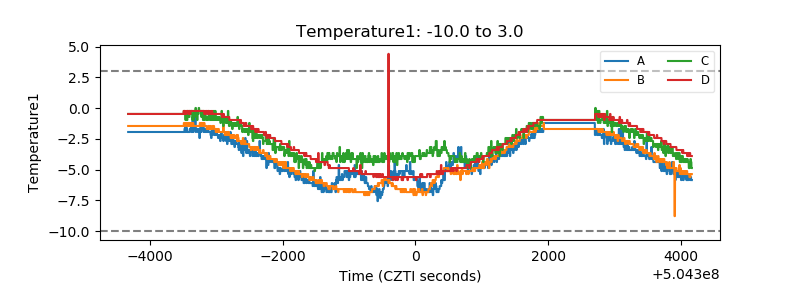 |
| Veto HV Monitor | 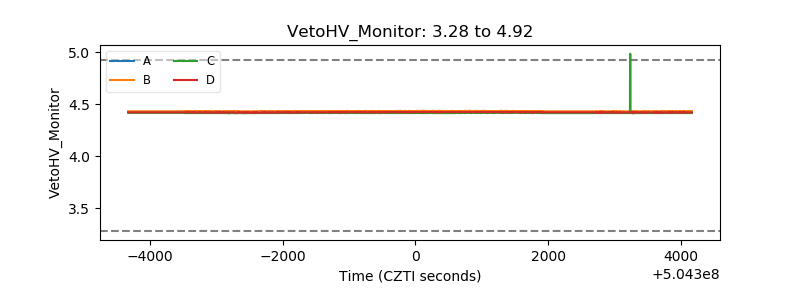 |
| Veto LLD | 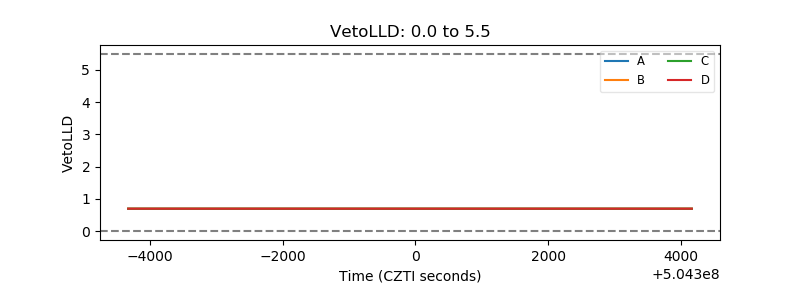 |
| Alpha Counter | 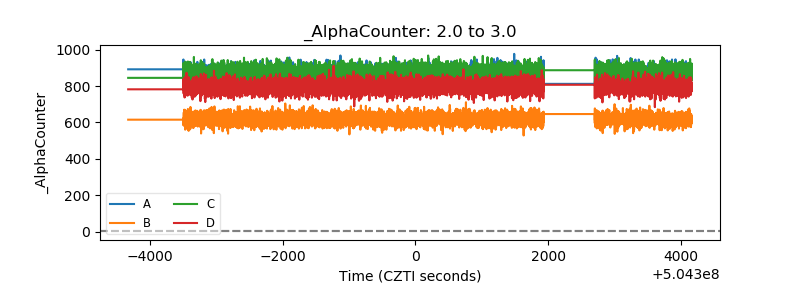 |
| _CPM_Rate | 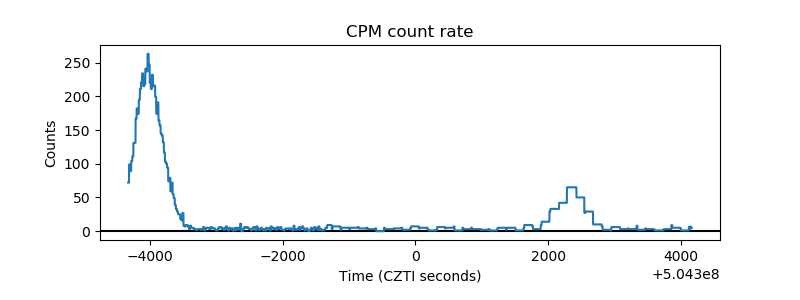 |
| CZT Counter | 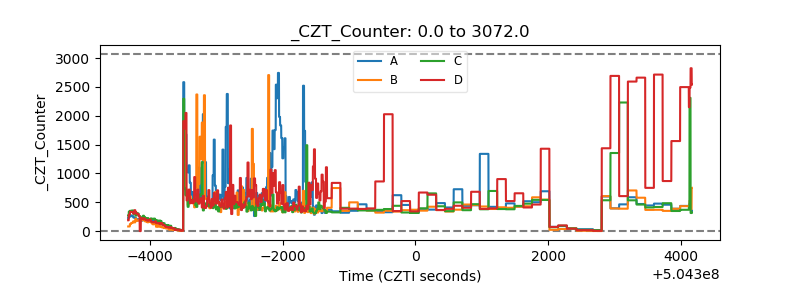 |
| +2.5 Volts monitor | 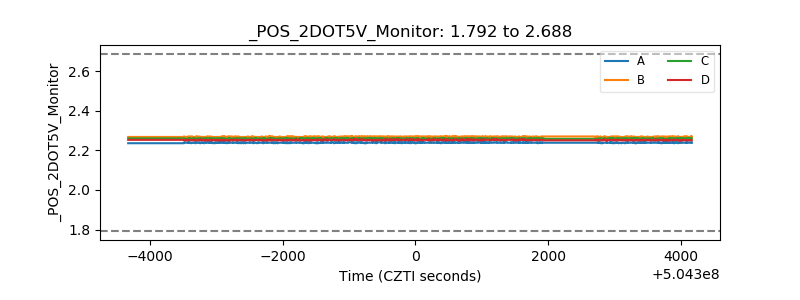 |
| +5 Volts monitor | 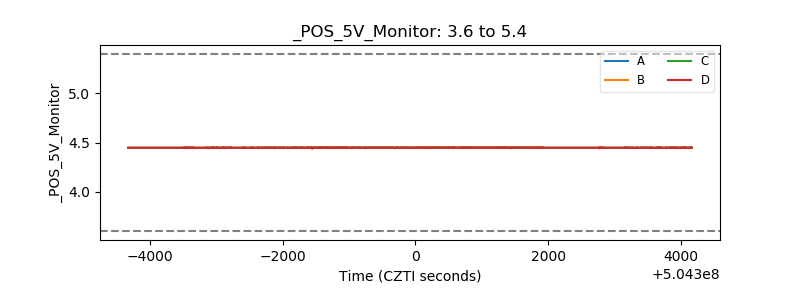 |
| _ROLL_ROT | 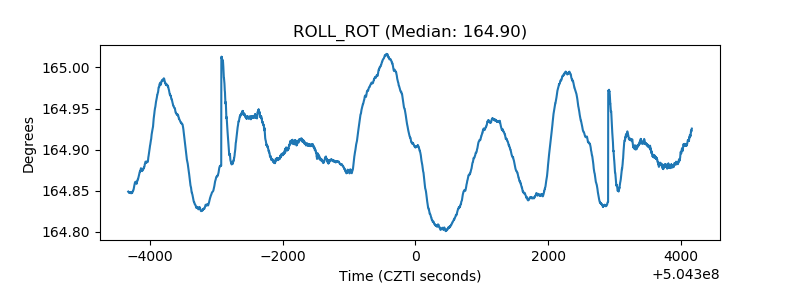 |
| _Roll_DEC | 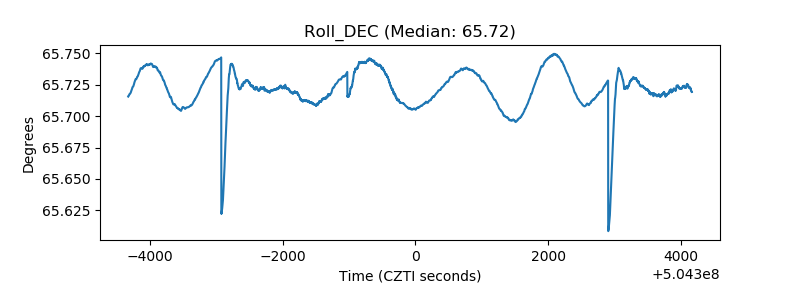 |
| _Roll_RA | 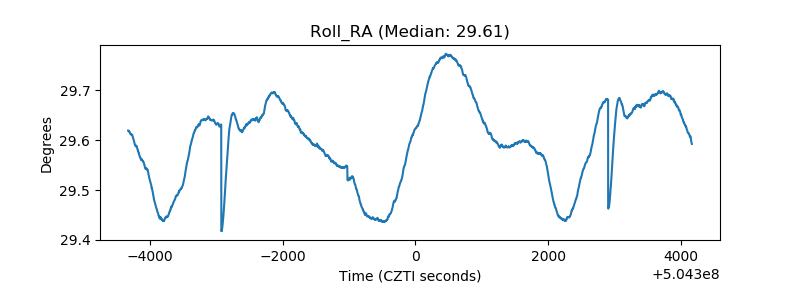 |
| Veto Counter | 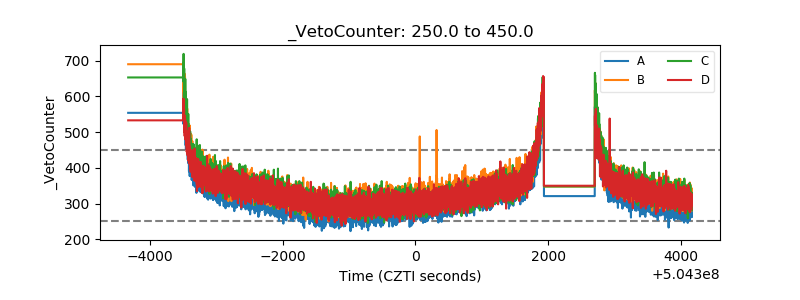 |