| Param | Original file | Final file |
|---|---|---|
| Filename | modeM0/AS1A14_099T01_9000006536_55406cztM0_level2.fits | modeM0/AS1A14_099T01_9000006536_55406cztM0_level2_quad_clean.evt |
| Size (bytes) | 723,761,280 | 95,397,120 |
| Size | 690.2 MB | 91.0 MB |
| Events in quadrant A | 3,318,897 | 722,637 |
| Events in quadrant B | 3,931,199 | 751,531 |
| Events in quadrant C | 3,599,572 | 679,762 |
| Events in quadrant D | 15,354,519 | 209,296 |
| Mode M9 | |||
|---|---|---|---|
| Quadrant | BADHDUFLAG | Total packets | Discarded packets |
| A | 0 | 8 | 0 |
| B | 0 | 9 | 0 |
| C | 0 | 9 | 0 |
| D | 0 | 9 | 0 |
| Mode SS | |||
|---|---|---|---|
| Quadrant | BADHDUFLAG | Total packets | Discarded packets |
| A | 0 | 154 | 0 |
| B | 0 | 154 | 0 |
| C | 0 | 154 | 0 |
| D | 0 | 154 | 0 |
| Mode M0 | |||
|---|---|---|---|
| Quadrant | BADHDUFLAG | Total packets | Discarded packets |
| A | 0 | 15739 | 3 |
| B | 0 | 17445 | 8 |
| C | 0 | 16639 | 2 |
| D | 0 | 50810 | 32 |
| Quadrant | Total seconds | Saturated seconds | Saturation percentage |
|---|---|---|---|
| A | 7553 | 37 | 0.489872% |
| B | 7550 | 231 | 3.059603% |
| C | 7554 | 70 | 0.926661% |
| D | 7548 | 5172 | 68.521463% |
Noise dominated data is calculated using 1-second bins in cleaned event files. If a bin has >2000 counts, and if more than 50% of those come from <1% of pixels, then it is considered to be noise-dominated and hence unusable.
| Quadrant | # 1 sec bins | Bins with >0 counts | Bins with >2000 counts | High rate bins dominated by noise | Noise dominated (total time) | Noise dominated (detector-on time) | Marked lightcurve |
|---|---|---|---|---|---|---|---|
| A | 7699 | 7556 | 3 | 3 | 0.04% | 0.04% | 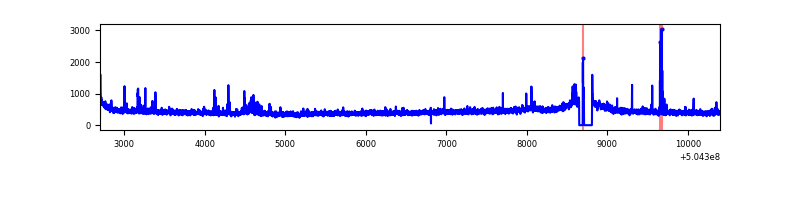 |
| B | 7699 | 7554 | 104 | 104 | 1.35% | 1.38% | 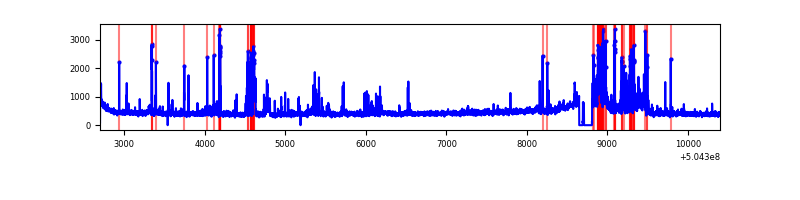 |
| C | 7699 | 7556 | 23 | 23 | 0.30% | 0.30% | 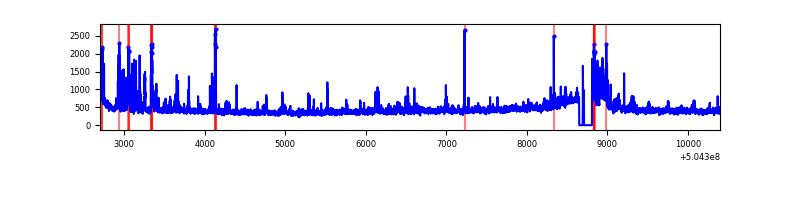 |
| D | 7698 | 7554 | 4780 | 4780 | 62.09% | 63.28% | 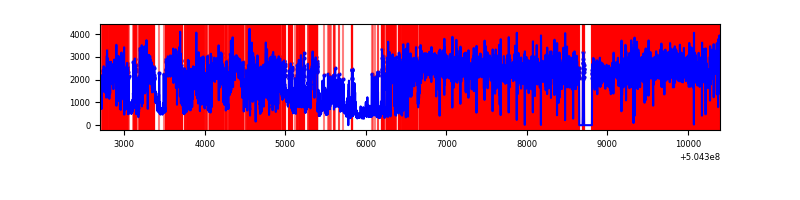 |
Top three noisy pixels from each quadrant. If the there are fewer than three noisy pixels in the level2.evt file, extra rows are filled as -1
| Pixel properties | Quadrant properties | ||||||
|---|---|---|---|---|---|---|---|
| Quadrant | DetID | PixID | Counts | Sigma | Mean | Median | Sigma |
| A | 4 | 3 | 56081 | 278.97 | 799 | 779 | 198.2 |
| A | 4 | 159 | 51623 | 256.48 | 799 | 779 | 198.2 |
| A | 0 | 8 | 22304 | 108.58 | 799 | 779 | 198.2 |
| B | 5 | 172 | 568830 | 3427.4 | 781 | 752 | 165.7 |
| B | 10 | 247 | 115779 | 693.99 | 781 | 752 | 165.7 |
| B | 5 | 185 | 49515 | 294.2 | 781 | 752 | 165.7 |
| C | 1 | 241 | 408864 | 1909.69 | 783 | 774 | 213.7 |
| C | 13 | 3 | 51339 | 236.62 | 783 | 774 | 213.7 |
| C | 12 | 252 | 51301 | 236.44 | 783 | 774 | 213.7 |
| D | 11 | 129 | 13250596 | 122173.56 | 376 | 359 | 108.5 |
| D | 2 | 249 | 225045 | 2071.71 | 376 | 359 | 108.5 |
| D | 8 | 160 | 110151 | 1012.34 | 376 | 359 | 108.5 |
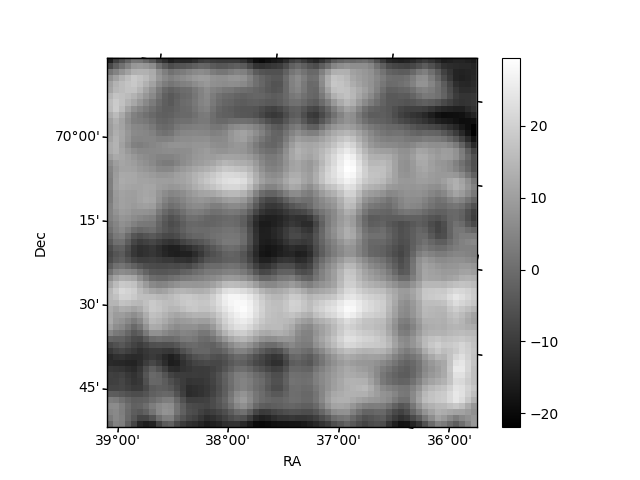
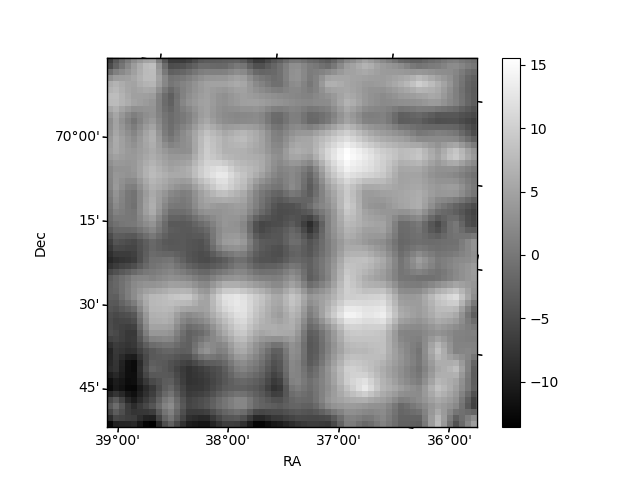
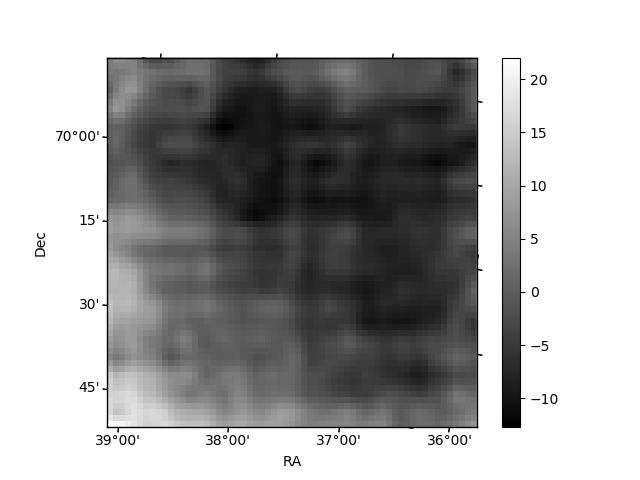
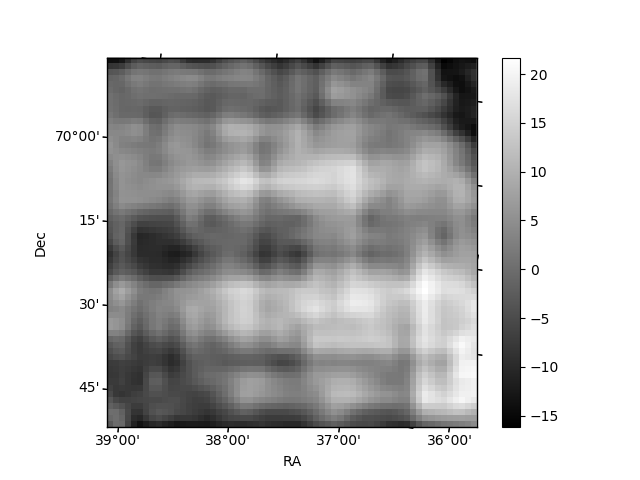
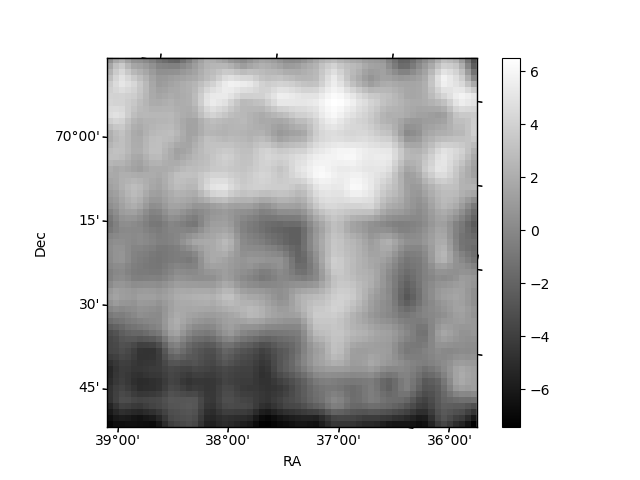
Histogram calculated using DETX and DETY for each event in the final _common_clean file
| Quadrant A | 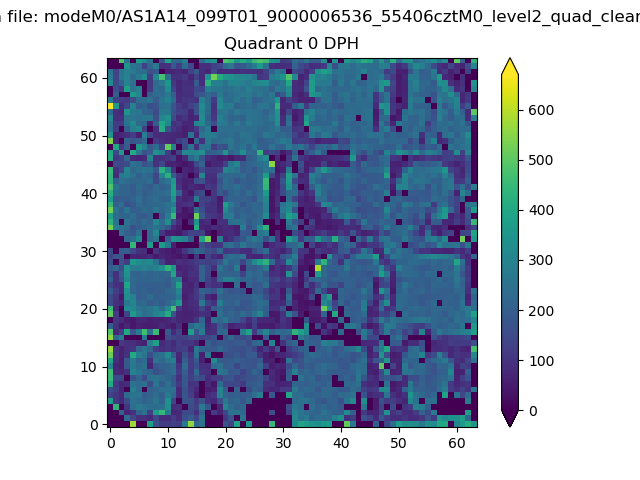 |
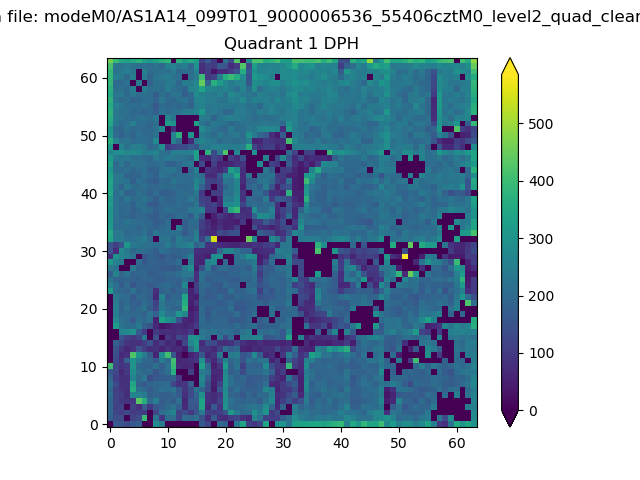 |
Quadrant B |
|---|---|---|---|
| Quadrant D | 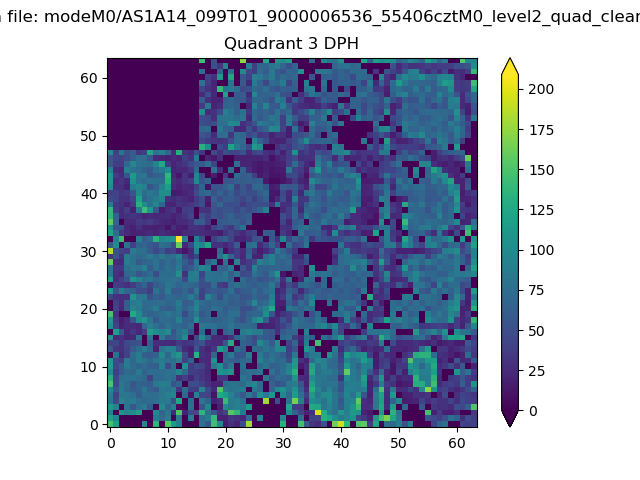 |
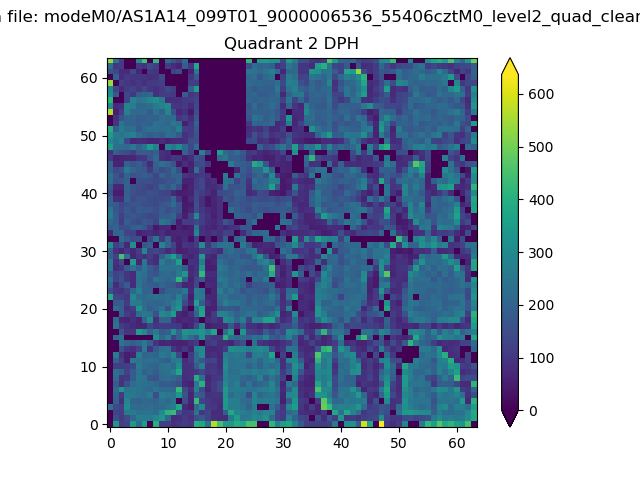 |
Quadrant C |
| Plot type | Count rate plots | Images |
|---|---|---|
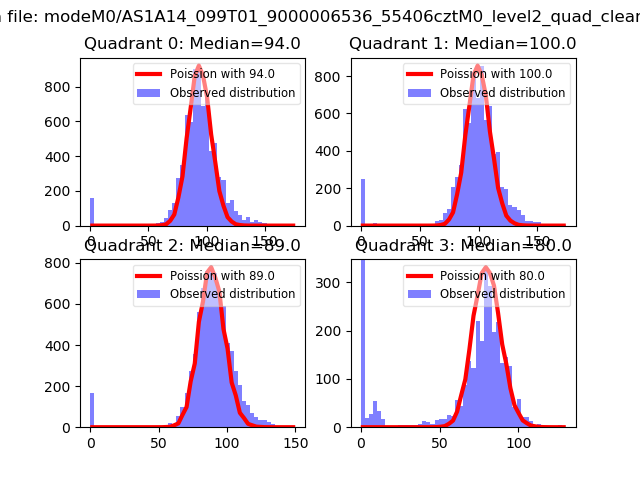
| Comparison with Poisson distribution Blue bars denote a histogram of data divided into 1 sec bins. Red curve is a Poisson curve with rate = median count rate of data. |
 |
 |
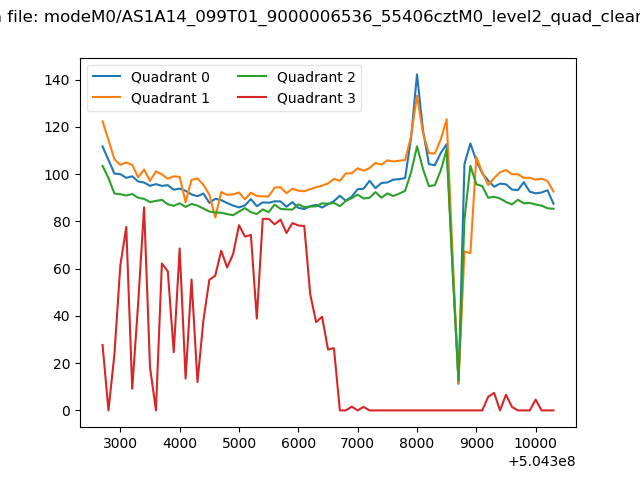
| Quadrant-wise count rates Data is divided into 100 sec bins |
 |
|
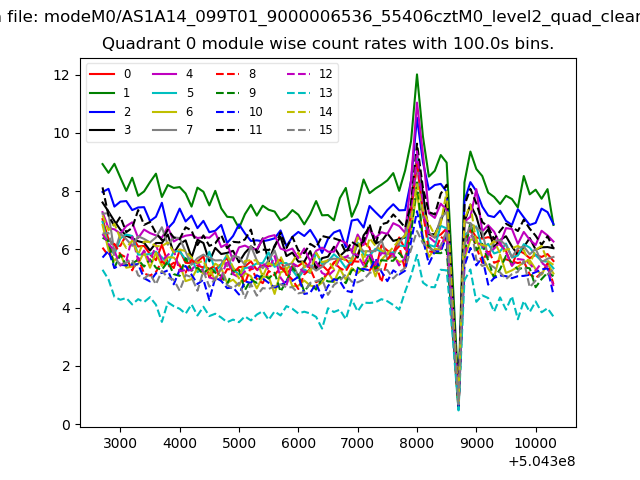
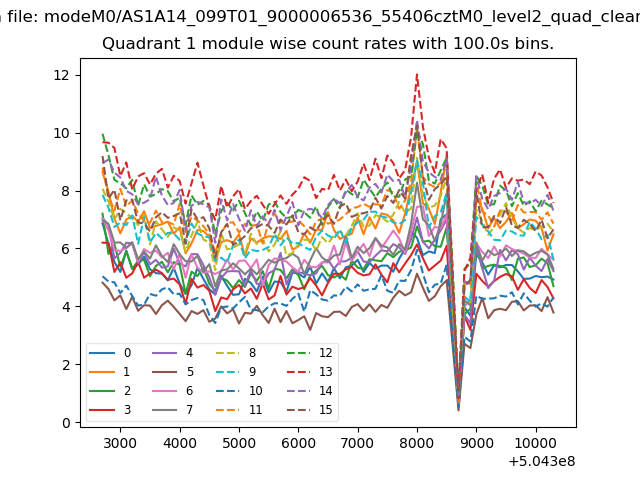
| Module-wise count rates for Quadrant A Data is divided into 100 sec bins |
 |
 |
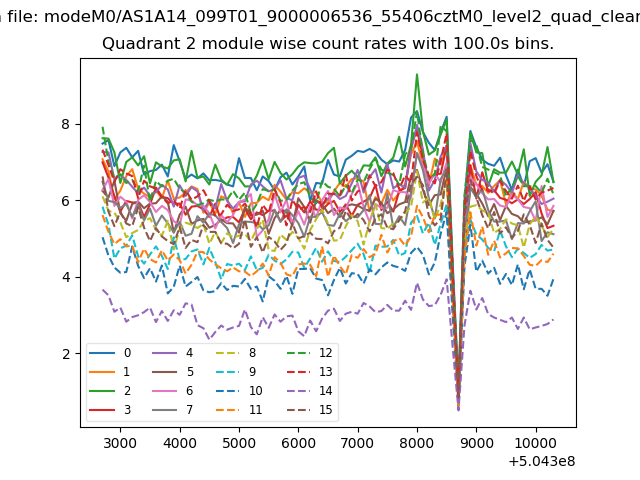
| Module-wise count rates for Quadrant B Data is divided into 100 sec bins |
 |
 |
| Module-wise count rates for Quadrant C Data is divided into 100 sec bins |
 |
 |
| Module-wise count rates for Quadrant D Data is divided into 100 sec bins |
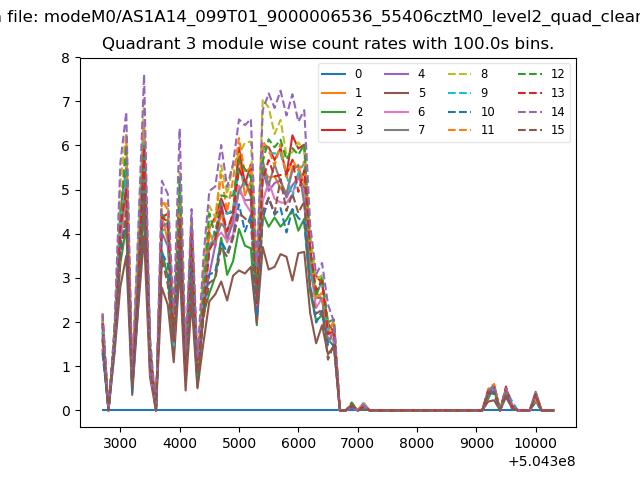 |
 |
| Parameter | Plot |
|---|---|
| CZT HV Monitor | 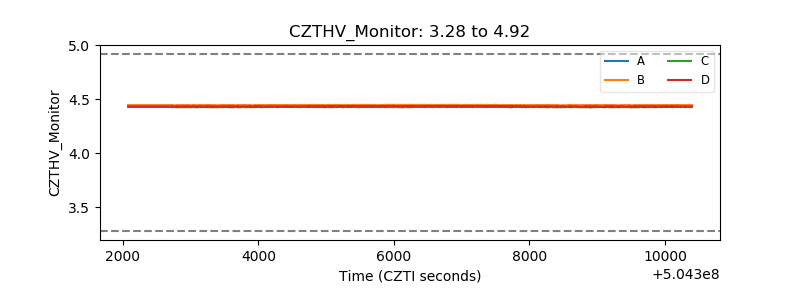 |
| D_VDD | 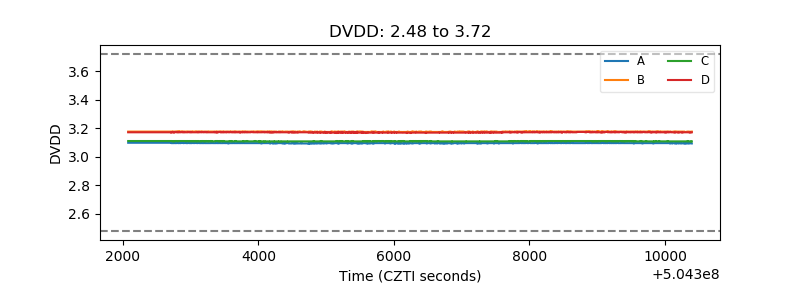 |
| Temperature 1 | 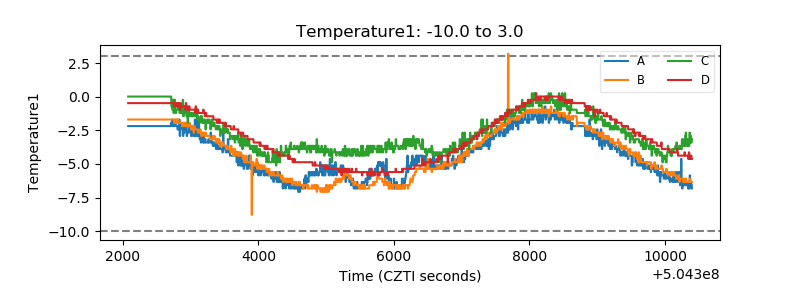 |
| Veto HV Monitor | 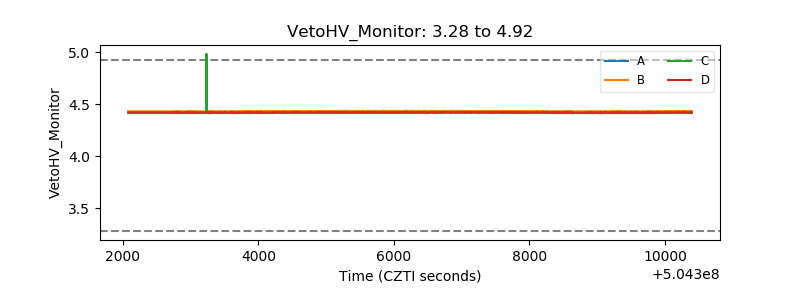 |
| Veto LLD | 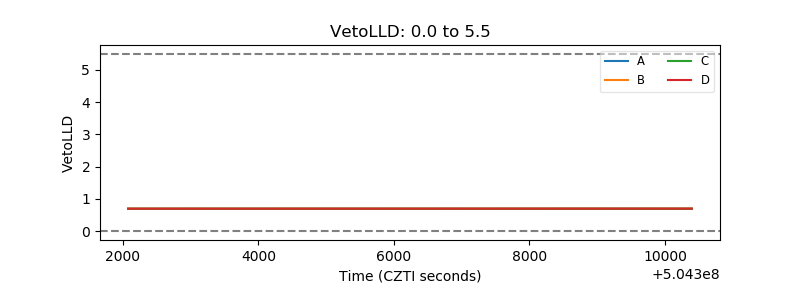 |
| Alpha Counter | 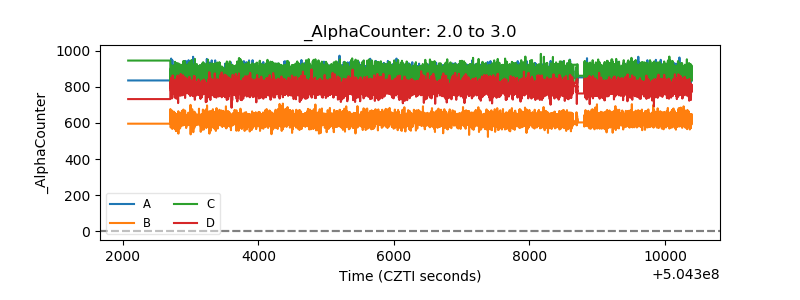 |
| _CPM_Rate | 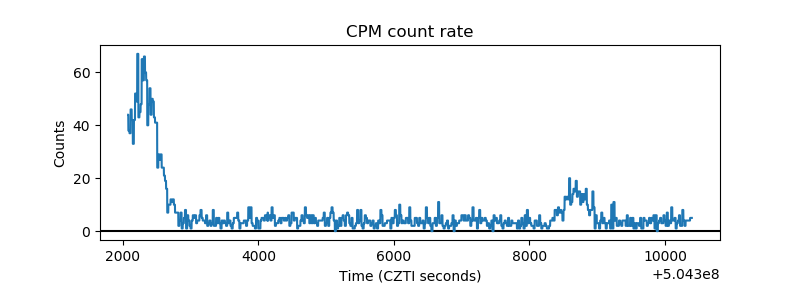 |
| CZT Counter | 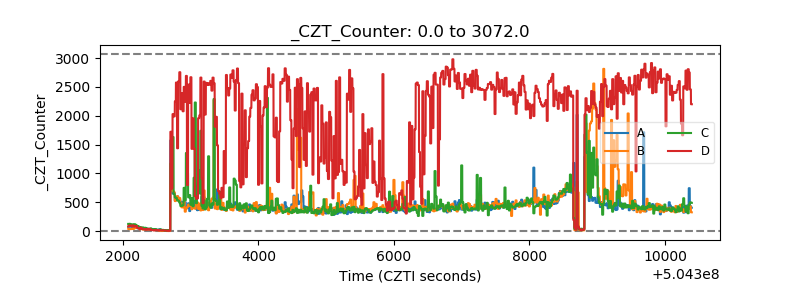 |
| +2.5 Volts monitor |  |
| +5 Volts monitor | 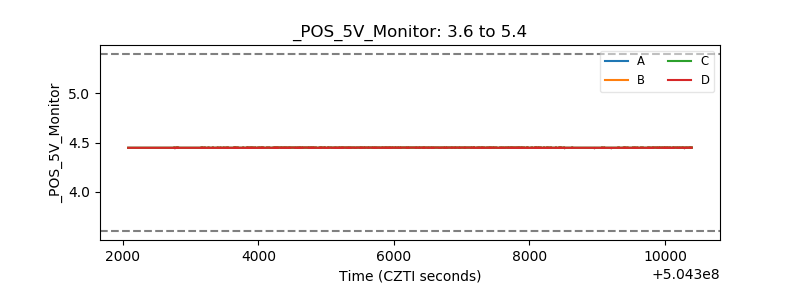 |
| _ROLL_ROT | 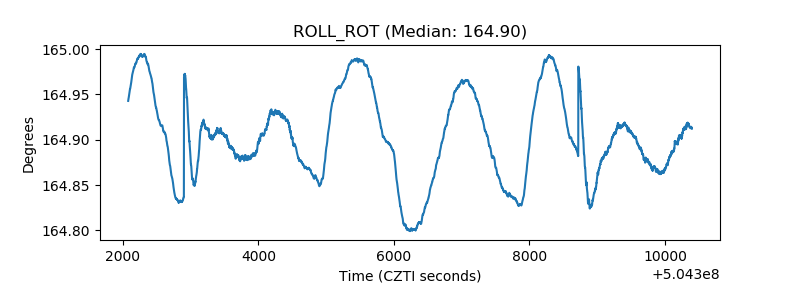 |
| _Roll_DEC | 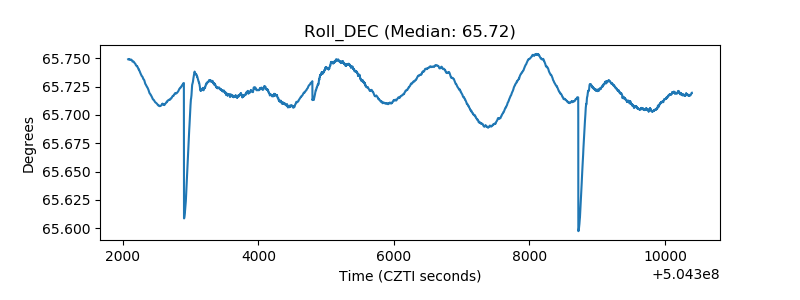 |
| _Roll_RA | 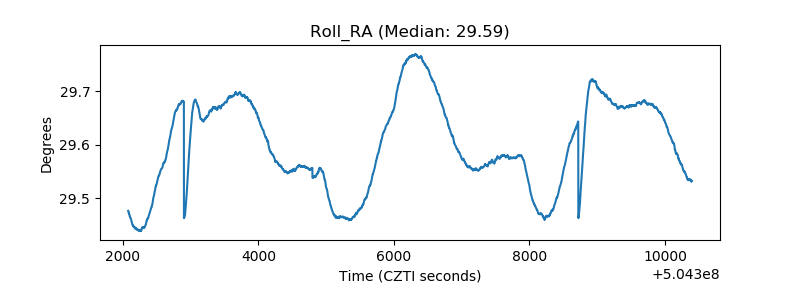 |
| Veto Counter |  |