| Param | Original file | Final file |
|---|---|---|
| Filename | modeM0/AS1A14_099T01_9000006536_55411cztM0_level2.fits | modeM0/AS1A14_099T01_9000006536_55411cztM0_level2_quad_clean.evt |
| Size (bytes) | 1,973,756,160 | 224,758,080 |
| Size | 1.8 GB | 214.3 MB |
| Events in quadrant A | 11,574,028 | 1,639,524 |
| Events in quadrant B | 8,598,030 | 1,817,771 |
| Events in quadrant C | 9,835,898 | 1,603,990 |
| Events in quadrant D | 41,593,699 | 442,164 |
| Mode M9 | |||
|---|---|---|---|
| Quadrant | BADHDUFLAG | Total packets | Discarded packets |
| A | 0 | 10 | 0 |
| B | 0 | 10 | 0 |
| C | 0 | 10 | 0 |
| D | 0 | 10 | 0 |
| Mode SS | |||
|---|---|---|---|
| Quadrant | BADHDUFLAG | Total packets | Discarded packets |
| A | 0 | 384 | 0 |
| B | 0 | 384 | 0 |
| C | 0 | 384 | 0 |
| D | 0 | 384 | 0 |
| Mode M0 | |||
|---|---|---|---|
| Quadrant | BADHDUFLAG | Total packets | Discarded packets |
| A | 0 | 48251 | 3 |
| B | 0 | 39803 | 3 |
| C | 0 | 43808 | 3 |
| D | 0 | 136589 | 31 |
| Quadrant | Total seconds | Saturated seconds | Saturation percentage |
|---|---|---|---|
| A | 18869 | 979 | 5.188404% |
| B | 18869 | 355 | 1.881393% |
| C | 18870 | 561 | 2.972973% |
| D | 18866 | 13732 | 72.787024% |
Noise dominated data is calculated using 1-second bins in cleaned event files. If a bin has >2000 counts, and if more than 50% of those come from <1% of pixels, then it is considered to be noise-dominated and hence unusable.
| Quadrant | # 1 sec bins | Bins with >0 counts | Bins with >2000 counts | High rate bins dominated by noise | Noise dominated (total time) | Noise dominated (detector-on time) | Marked lightcurve |
|---|---|---|---|---|---|---|---|
| A | 19920 | 18872 | 627 | 627 | 3.15% | 3.32% | 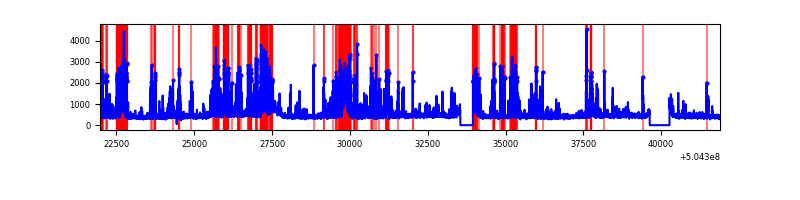 |
| B | 19920 | 18872 | 34 | 34 | 0.17% | 0.18% | 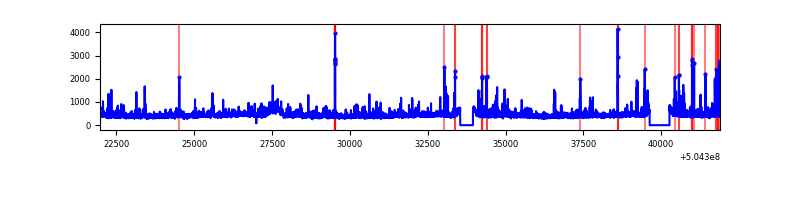 |
| C | 19920 | 18872 | 362 | 362 | 1.82% | 1.92% | 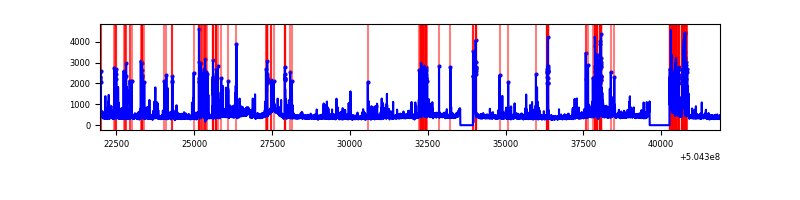 |
| D | 19920 | 18869 | 13430 | 13430 | 67.42% | 71.17% | 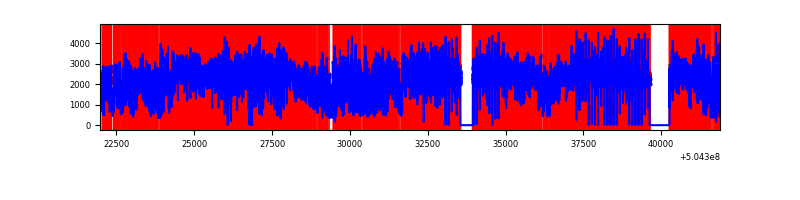 |
Top three noisy pixels from each quadrant. If the there are fewer than three noisy pixels in the level2.evt file, extra rows are filled as -1
| Pixel properties | Quadrant properties | ||||||
|---|---|---|---|---|---|---|---|
| Quadrant | DetID | PixID | Counts | Sigma | Mean | Median | Sigma |
| A | 4 | 159 | 2565434 | 5379.51 | 1941 | 1891 | 476.5 |
| A | 0 | 8 | 897632 | 1879.68 | 1941 | 1891 | 476.5 |
| A | 12 | 3 | 198580 | 412.75 | 1941 | 1891 | 476.5 |
| B | 5 | 185 | 199499 | 477.85 | 1950 | 1876 | 413.6 |
| B | 5 | 236 | 183528 | 439.23 | 1950 | 1876 | 413.6 |
| B | 0 | 183 | 125665 | 299.32 | 1950 | 1876 | 413.6 |
| C | 13 | 3 | 925332 | 1779.09 | 1903 | 1880 | 519.1 |
| C | 9 | 38 | 611342 | 1174.17 | 1903 | 1880 | 519.1 |
| C | 10 | 64 | 173073 | 329.81 | 1903 | 1880 | 519.1 |
| D | 11 | 129 | 36159115 | 129224.44 | 989 | 946 | 279.8 |
| D | 11 | 176 | 597245 | 2131.09 | 989 | 946 | 279.8 |
| D | 2 | 249 | 244904 | 871.87 | 989 | 946 | 279.8 |
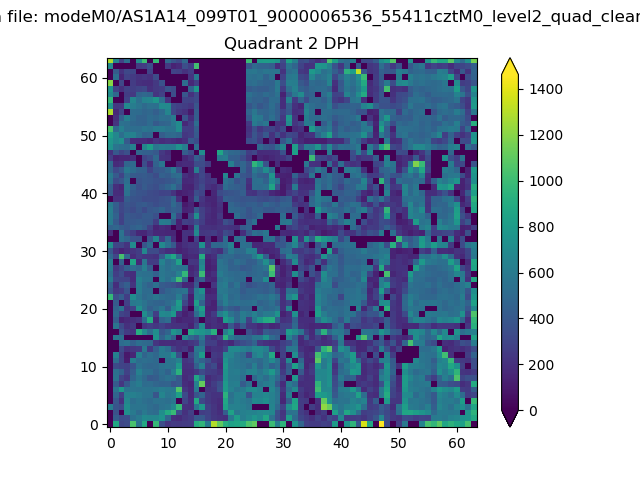
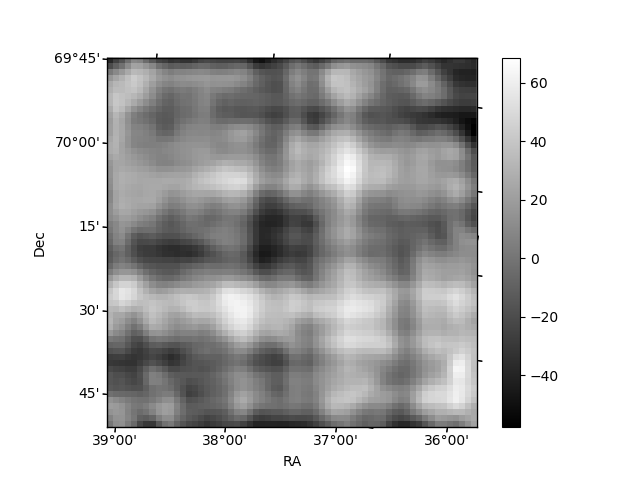
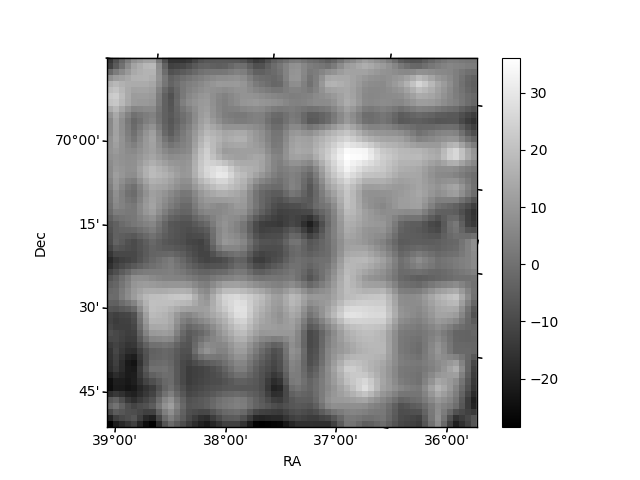
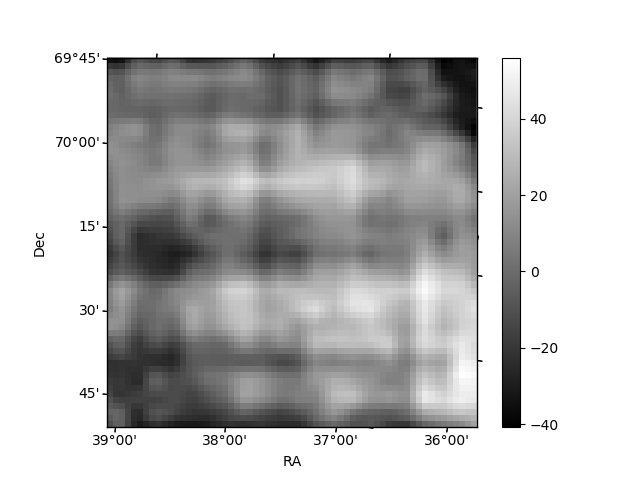
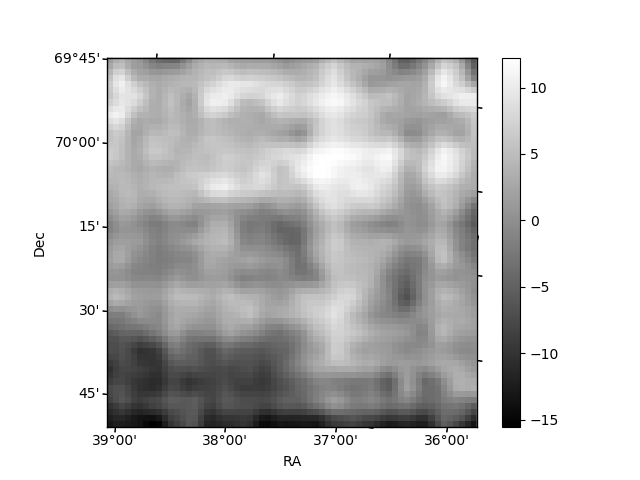
Histogram calculated using DETX and DETY for each event in the final _common_clean file
| Quadrant A | 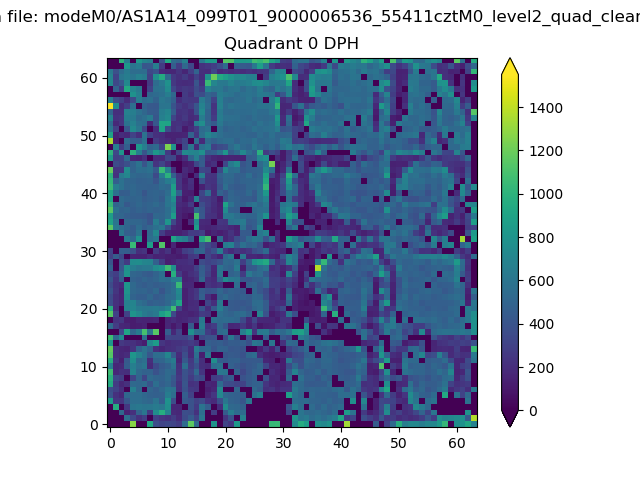 |
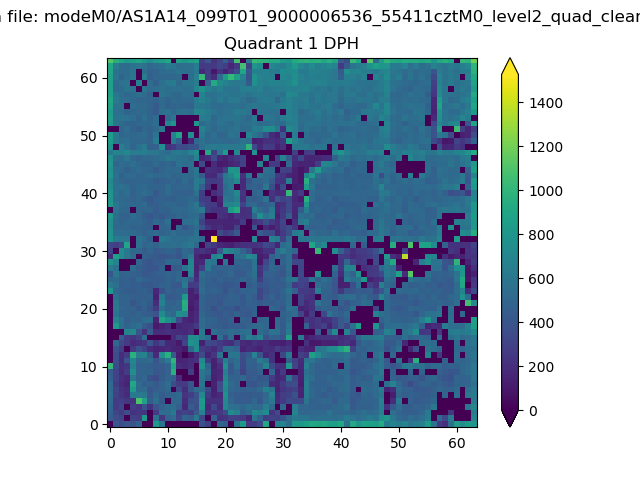 |
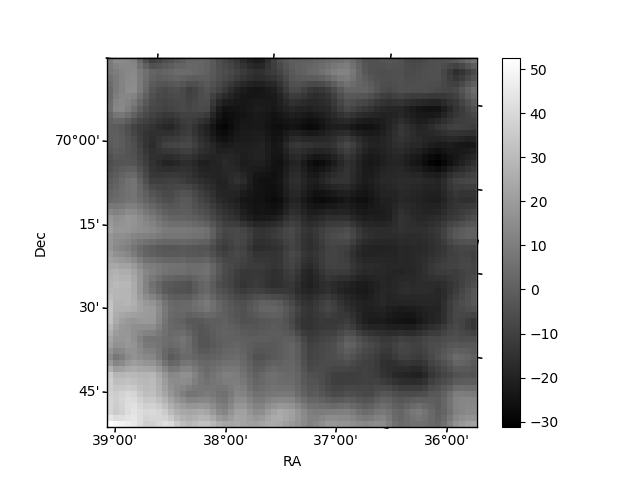
Quadrant B |
|---|---|---|---|
| Quadrant D | 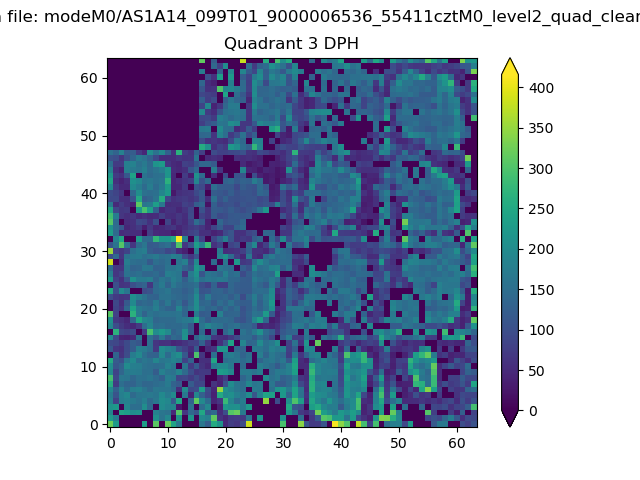 |
 |
Quadrant C |
| Plot type | Count rate plots | Images |
|---|---|---|
| Comparison with Poisson distribution Blue bars denote a histogram of data divided into 1 sec bins. Red curve is a Poisson curve with rate = median count rate of data. |
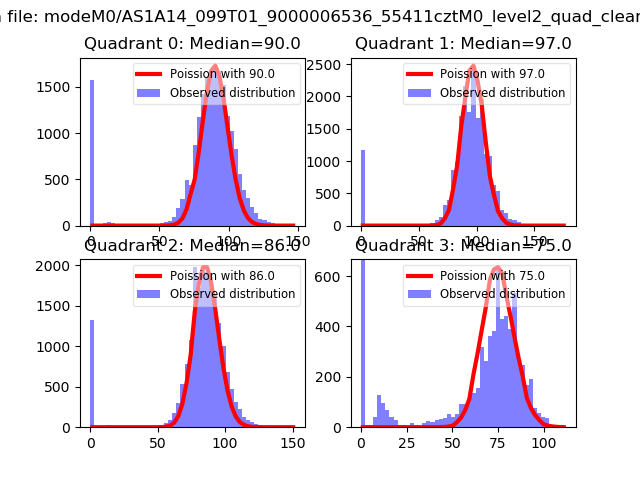 |
 |
| Quadrant-wise count rates Data is divided into 100 sec bins |
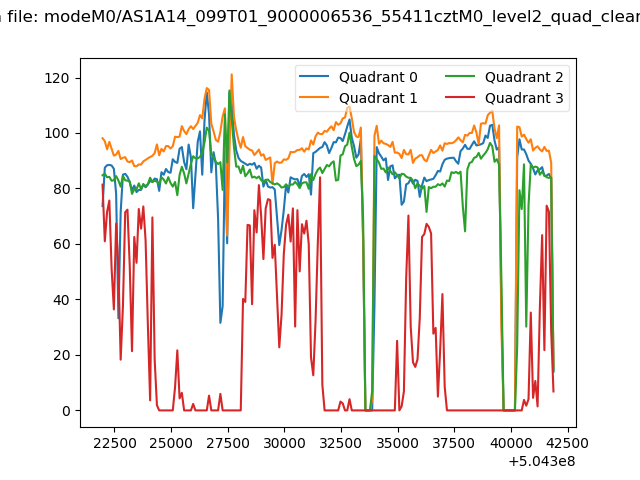 |
|
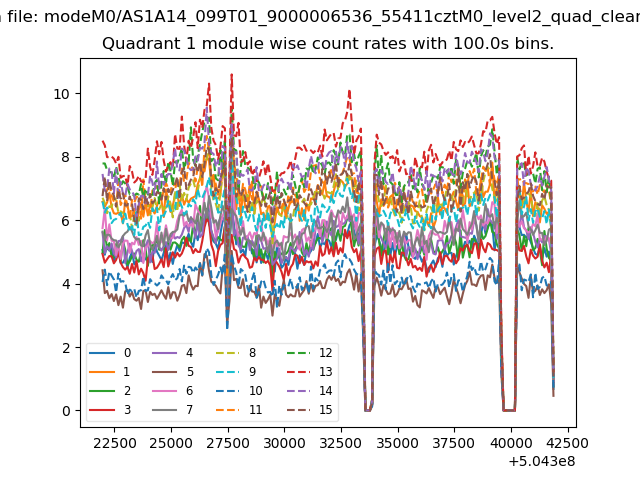
| Module-wise count rates for Quadrant A Data is divided into 100 sec bins |
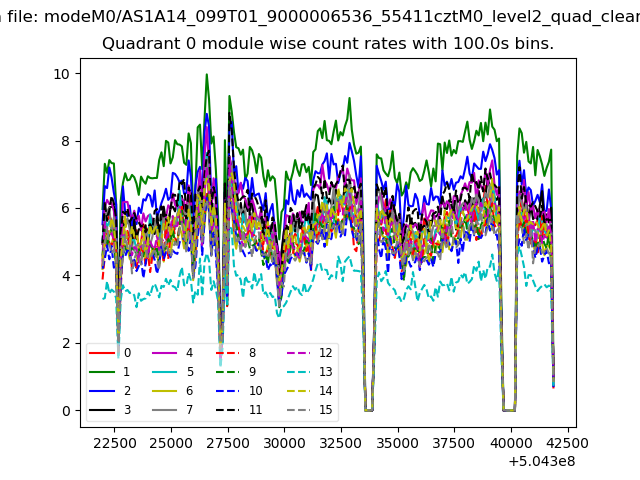 |
 |
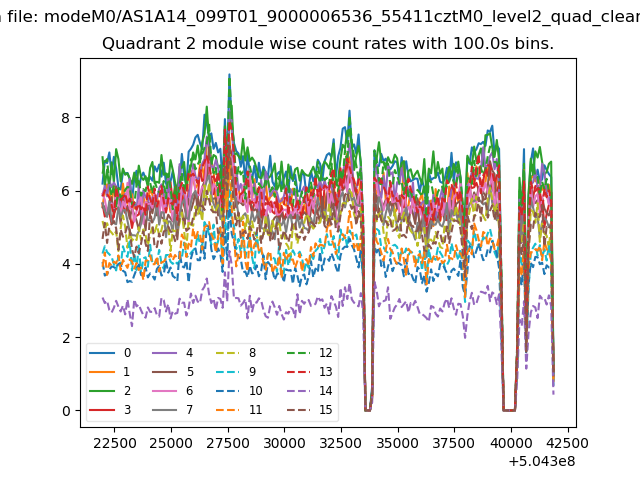
| Module-wise count rates for Quadrant B Data is divided into 100 sec bins |
 |
 |
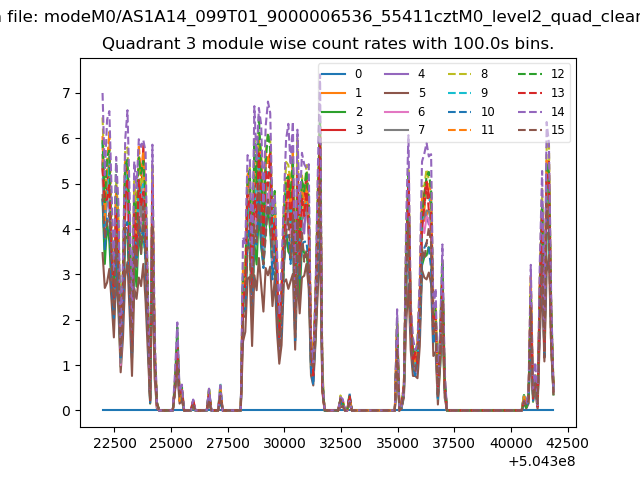
| Module-wise count rates for Quadrant C Data is divided into 100 sec bins |
 |
 |
| Module-wise count rates for Quadrant D Data is divided into 100 sec bins |
 |
 |
| Parameter | Plot |
|---|---|
| CZT HV Monitor | 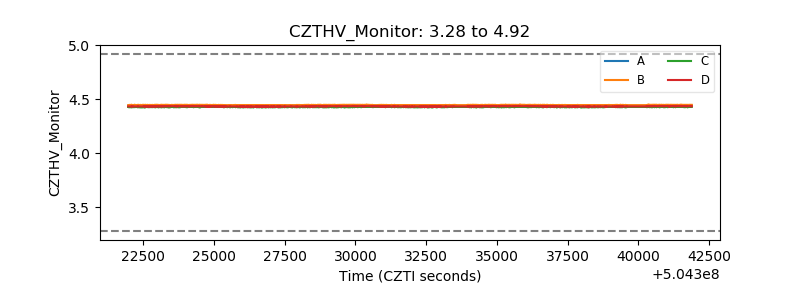 |
| D_VDD | 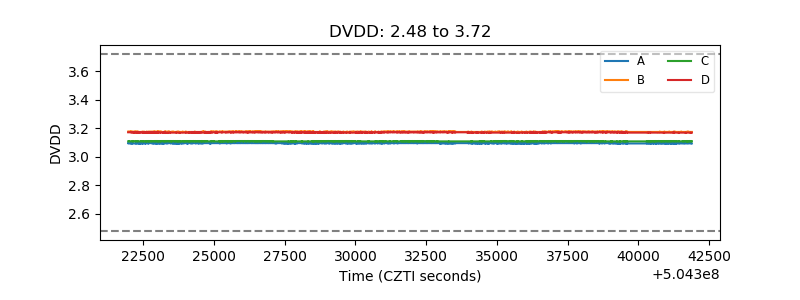 |
| Temperature 1 | 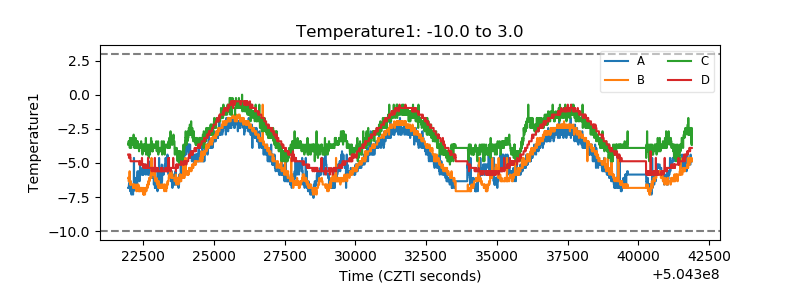 |
| Veto HV Monitor | 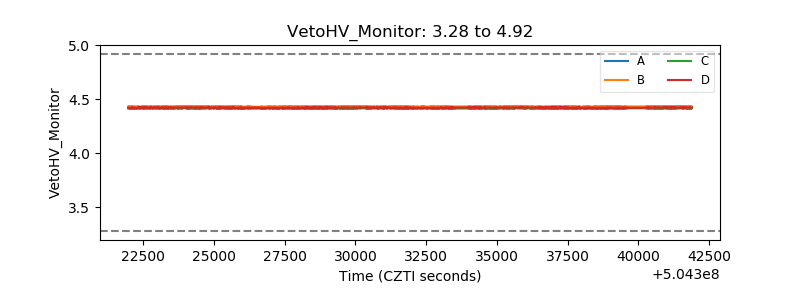 |
| Veto LLD | 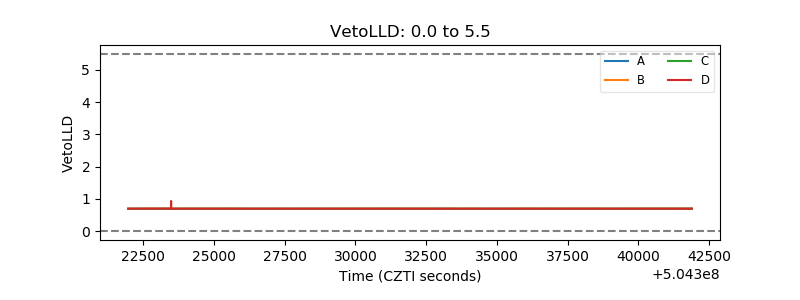 |
| Alpha Counter | 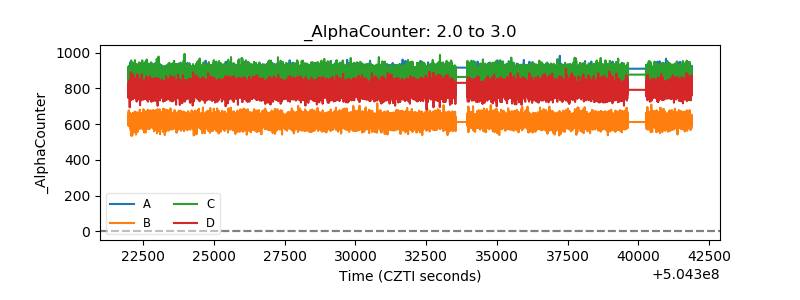 |
| _CPM_Rate | 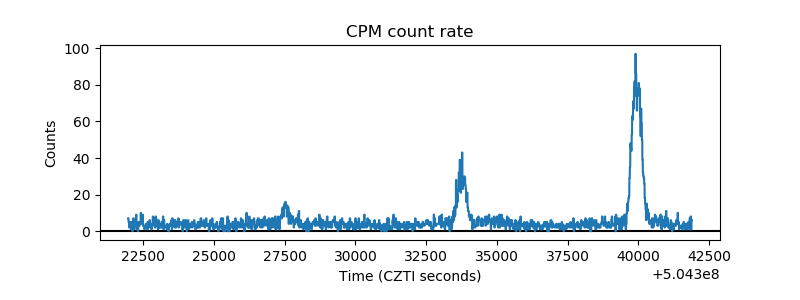 |
| CZT Counter | 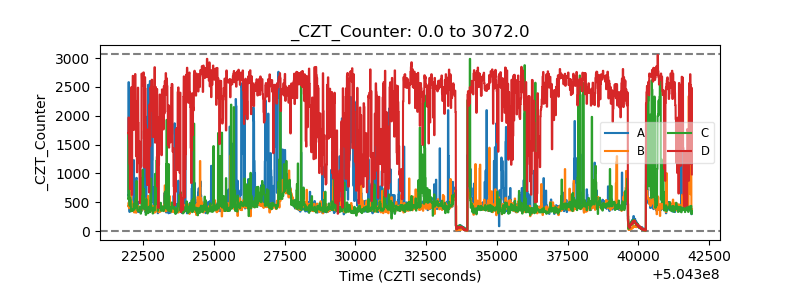 |
| +2.5 Volts monitor | 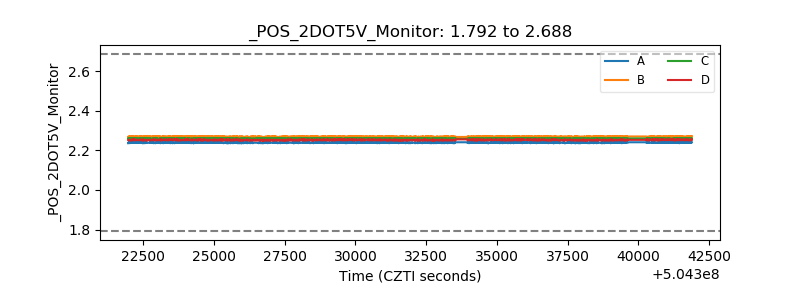 |
| +5 Volts monitor | 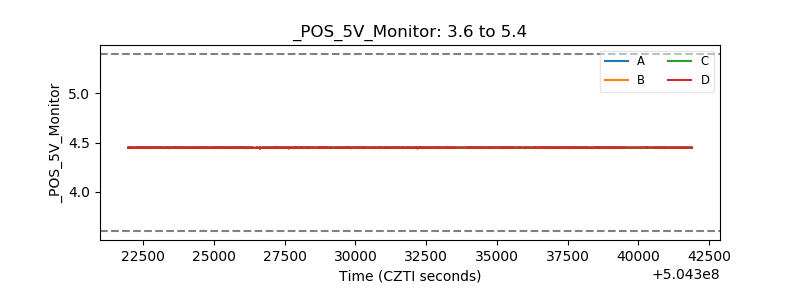 |
| _ROLL_ROT | 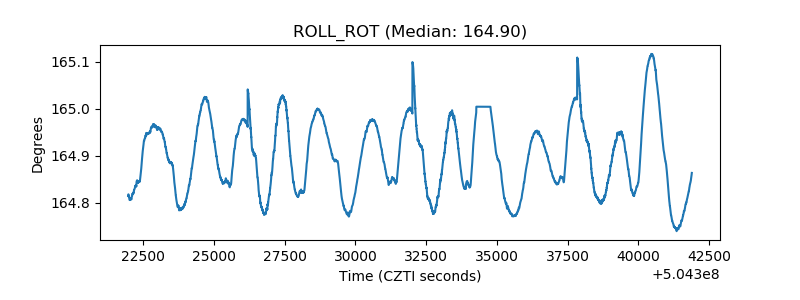 |
| _Roll_DEC | 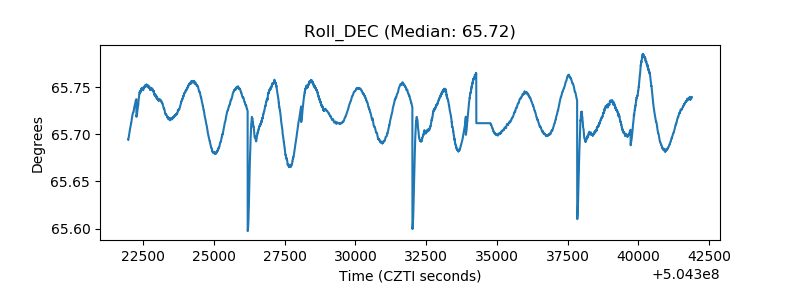 |
| _Roll_RA | 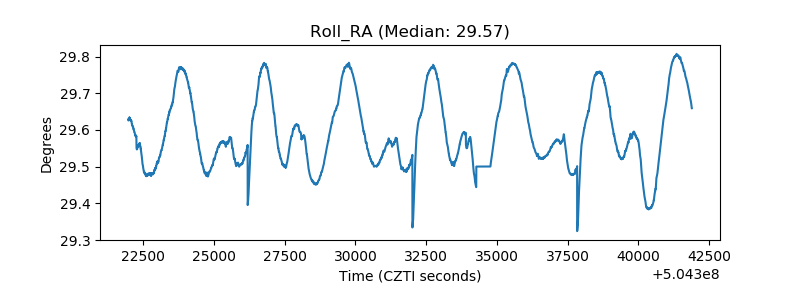 |
| Veto Counter | 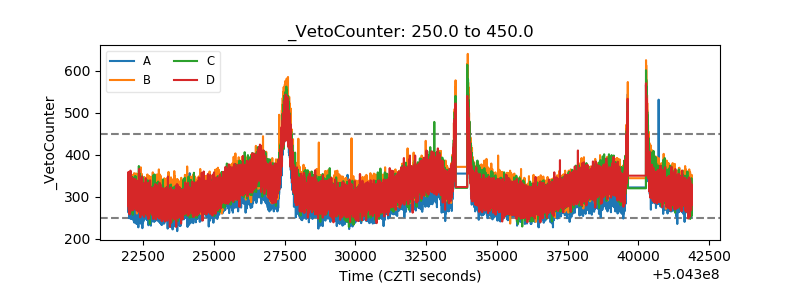 |