| Param | Original file | Final file |
|---|---|---|
| Filename | modeM0/AS1A14_099T01_9000006536_55412cztM0_level2.fits | modeM0/AS1A14_099T01_9000006536_55412cztM0_level2_quad_clean.evt |
| Size (bytes) | 608,267,520 | 86,313,600 |
| Size | 580.1 MB | 82.3 MB |
| Events in quadrant A | 3,291,042 | 621,520 |
| Events in quadrant B | 3,210,896 | 673,326 |
| Events in quadrant C | 3,376,943 | 589,002 |
| Events in quadrant D | 12,103,014 | 251,861 |
| Mode M9 | |||
|---|---|---|---|
| Quadrant | BADHDUFLAG | Total packets | Discarded packets |
| A | 0 | 9 | 0 |
| B | 0 | 9 | 0 |
| C | 0 | 9 | 0 |
| D | 0 | 9 | 0 |
| Mode SS | |||
|---|---|---|---|
| Quadrant | BADHDUFLAG | Total packets | Discarded packets |
| A | 0 | 138 | 0 |
| B | 0 | 138 | 0 |
| C | 0 | 138 | 0 |
| D | 0 | 138 | 0 |
| Mode M0 | |||
|---|---|---|---|
| Quadrant | BADHDUFLAG | Total packets | Discarded packets |
| A | 0 | 15016 | 1 |
| B | 0 | 14621 | 1 |
| C | 0 | 15505 | 1 |
| D | 0 | 40685 | 3 |
| Quadrant | Total seconds | Saturated seconds | Saturation percentage |
|---|---|---|---|
| A | 6859 | 158 | 2.303543% |
| B | 6860 | 112 | 1.632653% |
| C | 6860 | 215 | 3.134111% |
| D | 6859 | 4016 | 58.550809% |
Noise dominated data is calculated using 1-second bins in cleaned event files. If a bin has >2000 counts, and if more than 50% of those come from <1% of pixels, then it is considered to be noise-dominated and hence unusable.
| Quadrant | # 1 sec bins | Bins with >0 counts | Bins with >2000 counts | High rate bins dominated by noise | Noise dominated (total time) | Noise dominated (detector-on time) | Marked lightcurve |
|---|---|---|---|---|---|---|---|
| A | 7694 | 6860 | 75 | 75 | 0.97% | 1.09% | 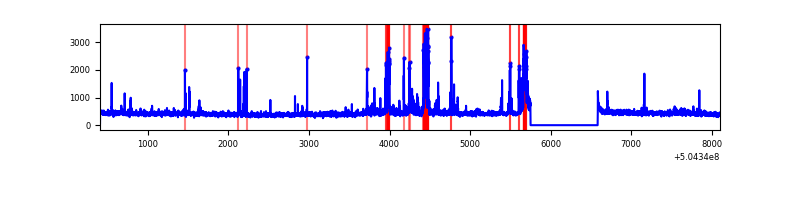 |
| B | 7695 | 6861 | 27 | 27 | 0.35% | 0.39% | 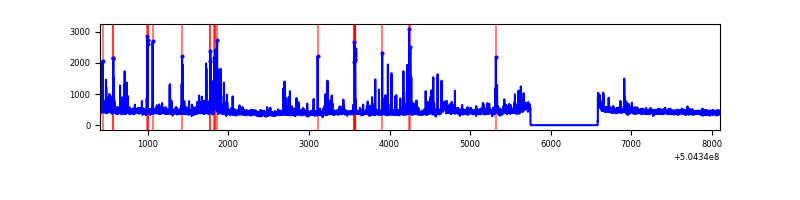 |
| C | 7695 | 6861 | 139 | 139 | 1.81% | 2.03% | 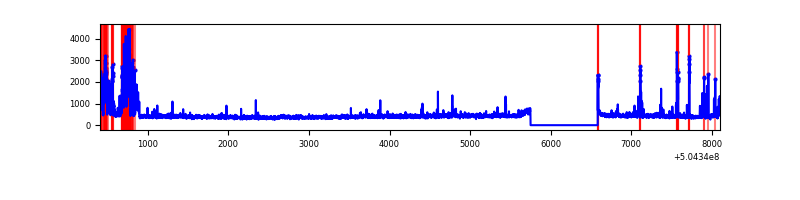 |
| D | 7694 | 6859 | 3551 | 3551 | 46.15% | 51.77% | 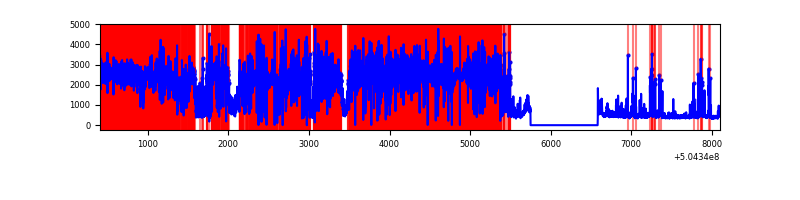 |
Top three noisy pixels from each quadrant. If the there are fewer than three noisy pixels in the level2.evt file, extra rows are filled as -1
| Pixel properties | Quadrant properties | ||||||
|---|---|---|---|---|---|---|---|
| Quadrant | DetID | PixID | Counts | Sigma | Mean | Median | Sigma |
| A | 0 | 8 | 357035 | 2019.41 | 712 | 694 | 176.5 |
| A | 4 | 159 | 68765 | 385.76 | 712 | 694 | 176.5 |
| A | 12 | 3 | 41599 | 231.81 | 712 | 694 | 176.5 |
| B | 5 | 185 | 181852 | 1192.15 | 706 | 680 | 152.0 |
| B | 5 | 236 | 100012 | 653.63 | 706 | 680 | 152.0 |
| B | 2 | 30 | 25717 | 164.75 | 706 | 680 | 152.0 |
| C | 9 | 38 | 473014 | 2535.0 | 684 | 677 | 186.3 |
| C | 13 | 3 | 67578 | 359.05 | 684 | 677 | 186.3 |
| C | 12 | 252 | 46475 | 245.8 | 684 | 677 | 186.3 |
| D | 11 | 129 | 9839530 | 79367.98 | 437 | 417 | 124.0 |
| D | 11 | 176 | 200224 | 1611.76 | 437 | 417 | 124.0 |
| D | 2 | 249 | 148634 | 1195.6 | 437 | 417 | 124.0 |
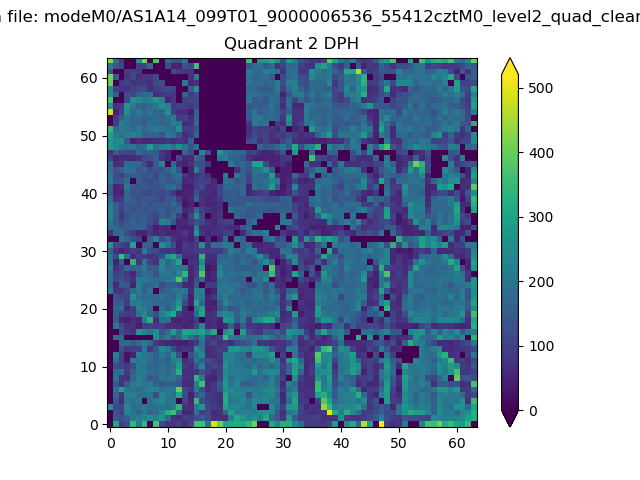
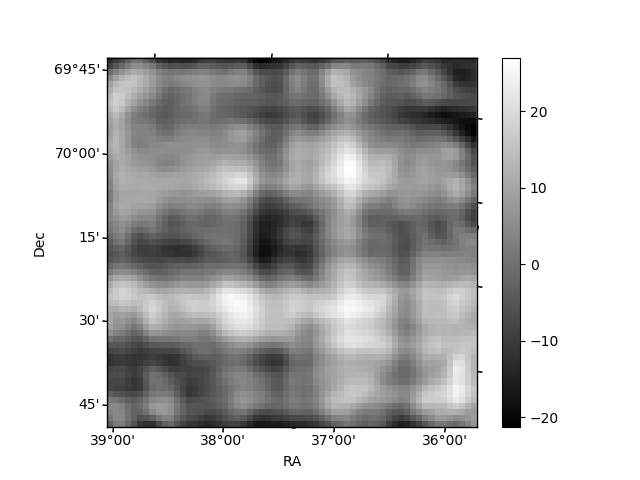
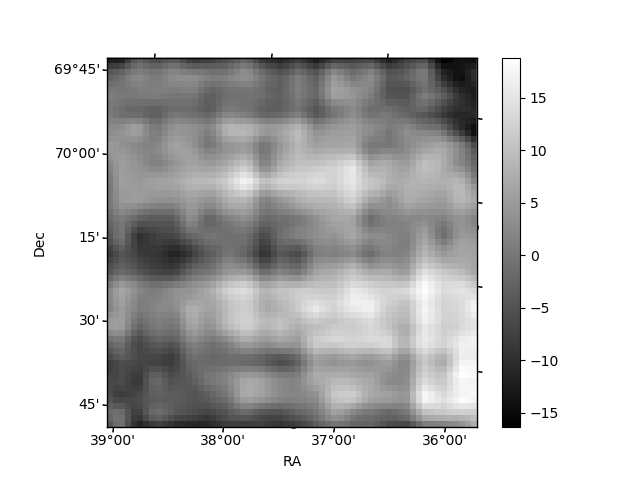
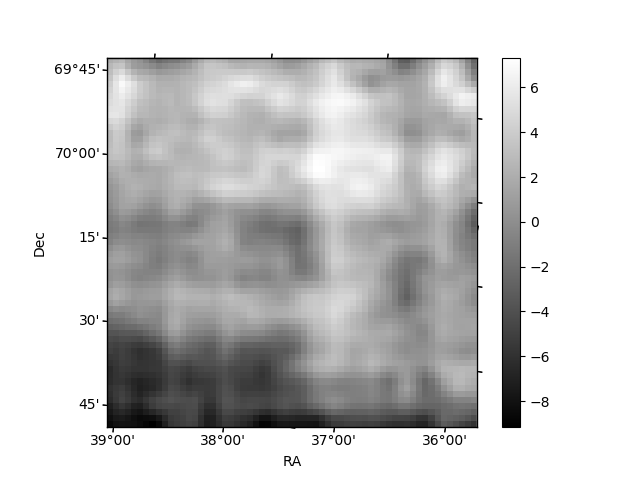
Histogram calculated using DETX and DETY for each event in the final _common_clean file
| Quadrant A | 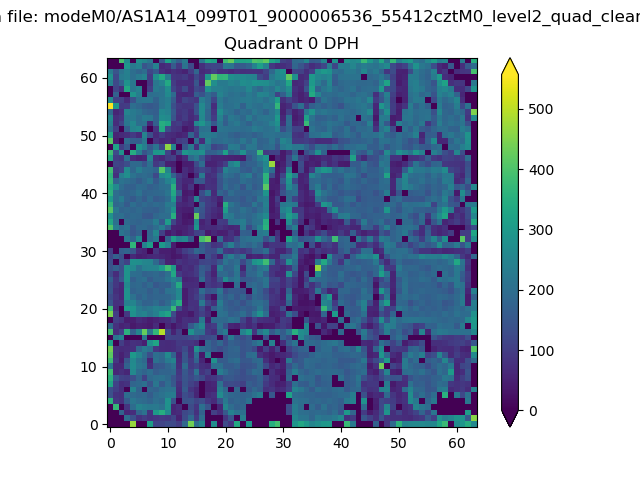 |
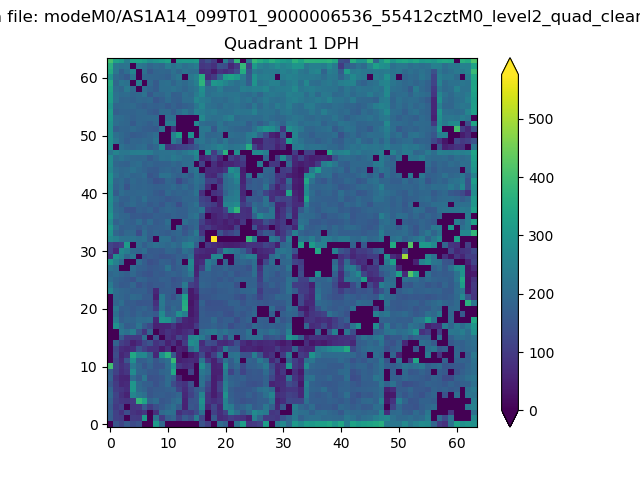 |
Quadrant B |
|---|---|---|---|
| Quadrant D | 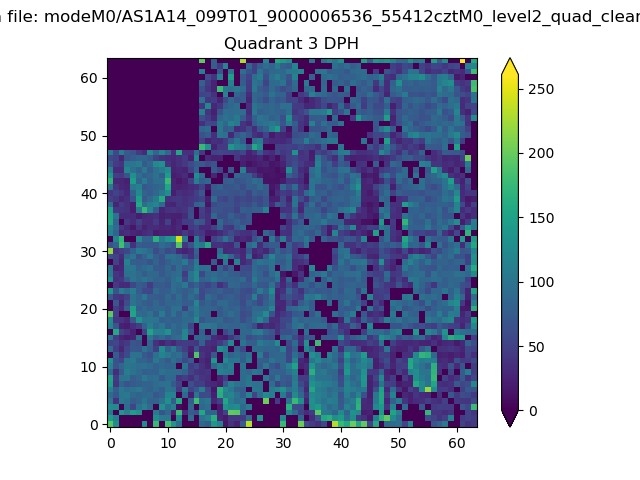 |
 |
Quadrant C |
| Plot type | Count rate plots | Images |
|---|---|---|
| Comparison with Poisson distribution Blue bars denote a histogram of data divided into 1 sec bins. Red curve is a Poisson curve with rate = median count rate of data. |
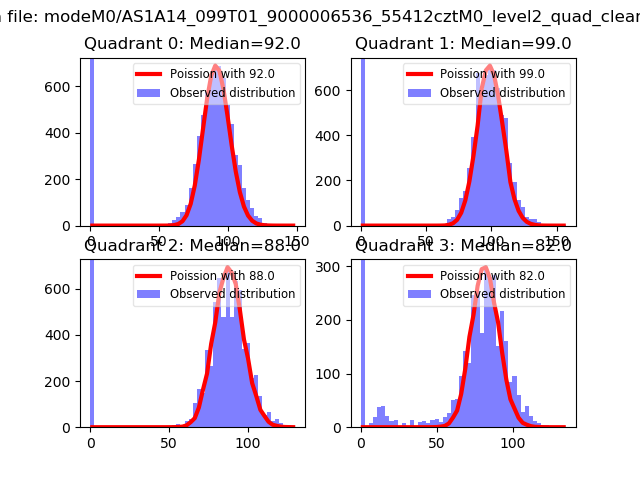 |
 |
| Quadrant-wise count rates Data is divided into 100 sec bins |
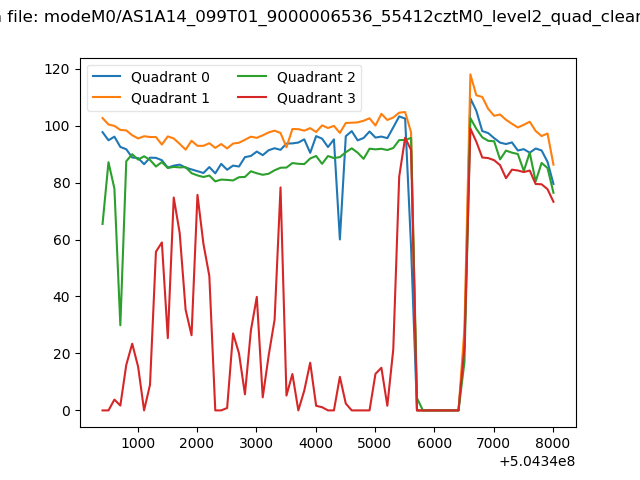 |
|
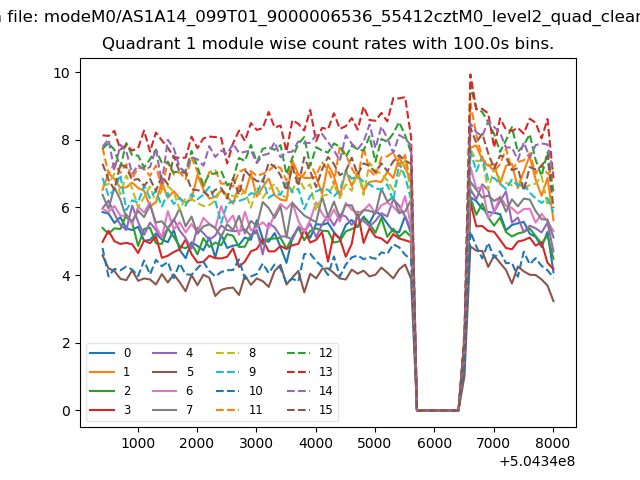
| Module-wise count rates for Quadrant A Data is divided into 100 sec bins |
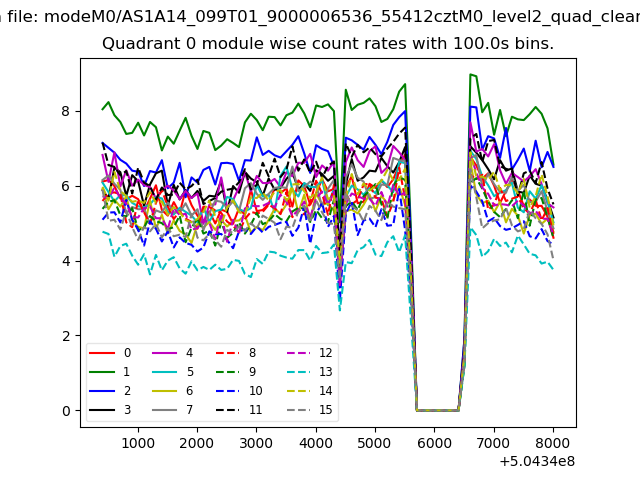 |
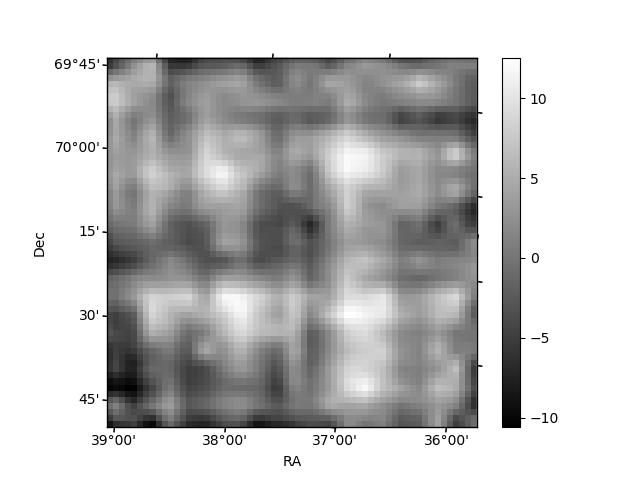 |
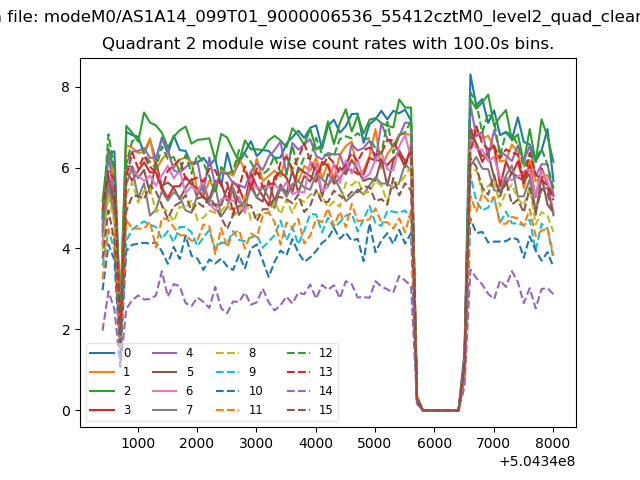
| Module-wise count rates for Quadrant B Data is divided into 100 sec bins |
 |
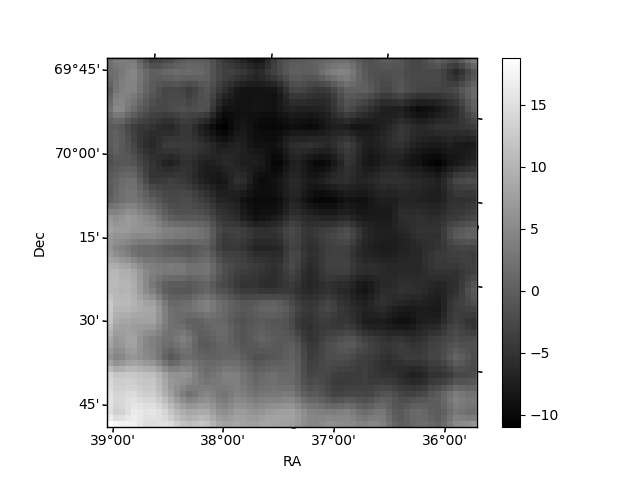 |
| Module-wise count rates for Quadrant C Data is divided into 100 sec bins |
 |
 |
| Module-wise count rates for Quadrant D Data is divided into 100 sec bins |
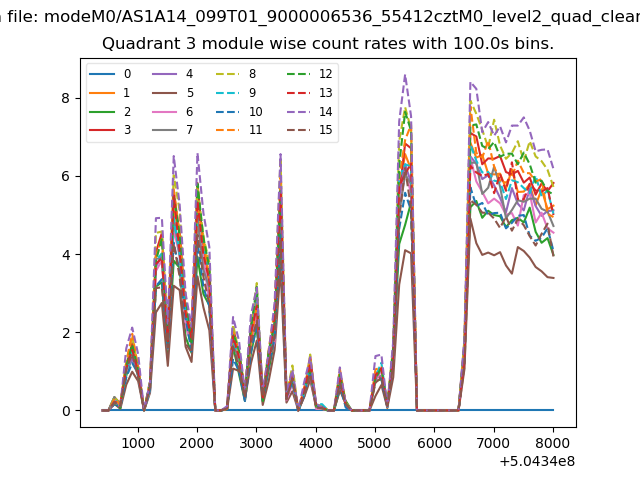 |
 |
| Parameter | Plot |
|---|---|
| CZT HV Monitor | 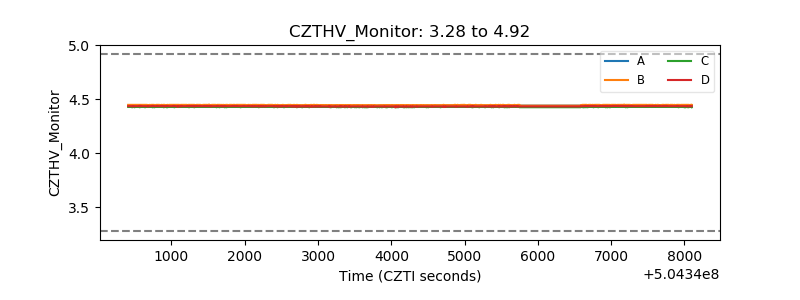 |
| D_VDD | 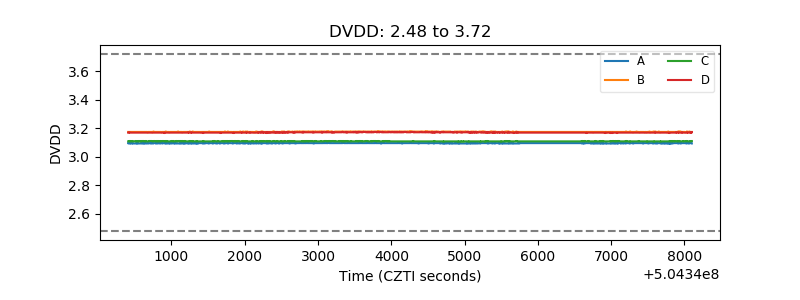 |
| Temperature 1 | 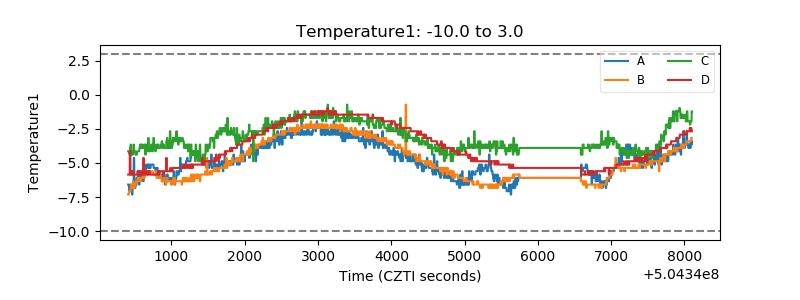 |
| Veto HV Monitor | 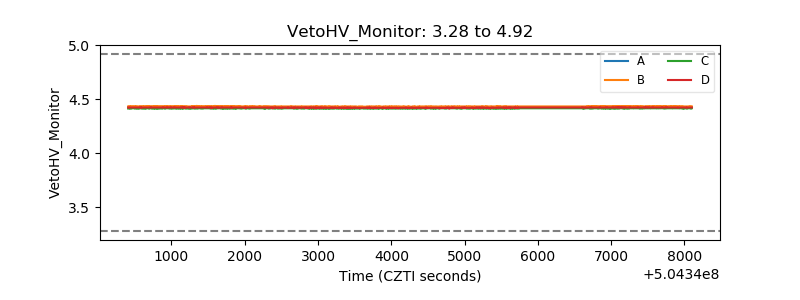 |
| Veto LLD | 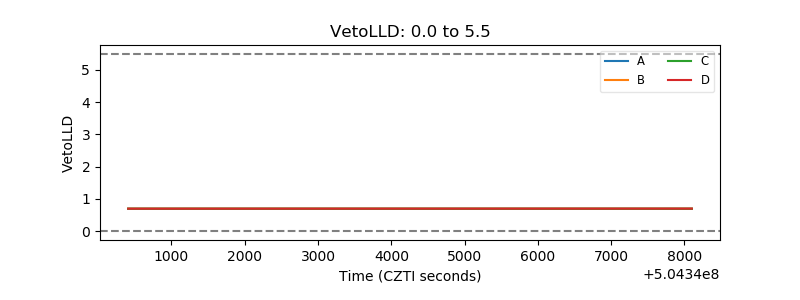 |
| Alpha Counter | 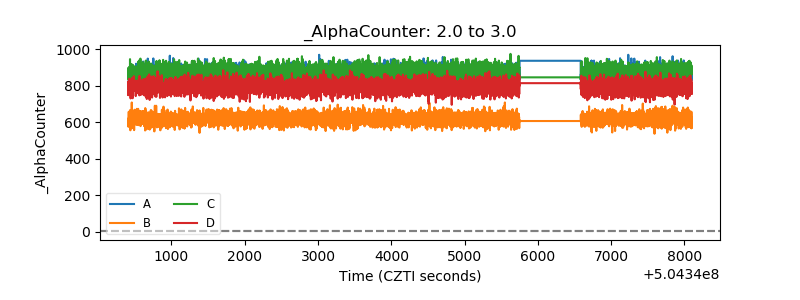 |
| _CPM_Rate | 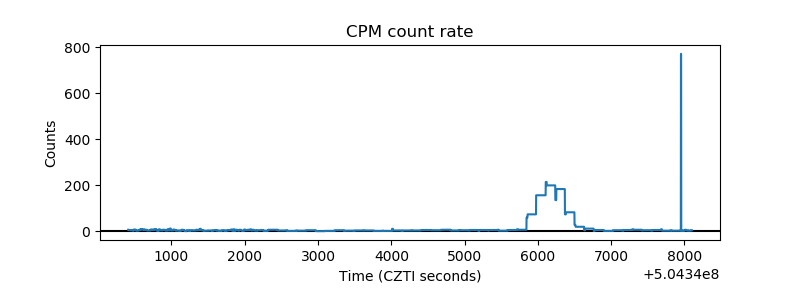 |
| CZT Counter | 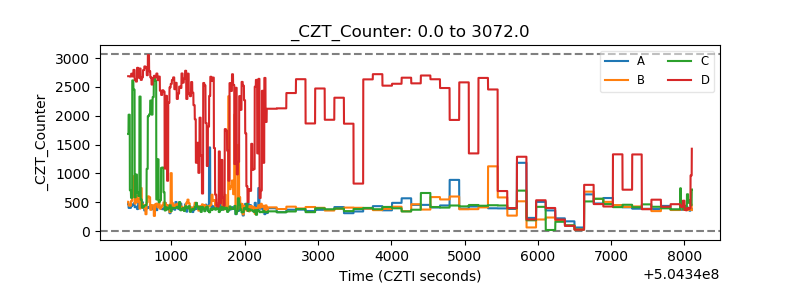 |
| +2.5 Volts monitor | 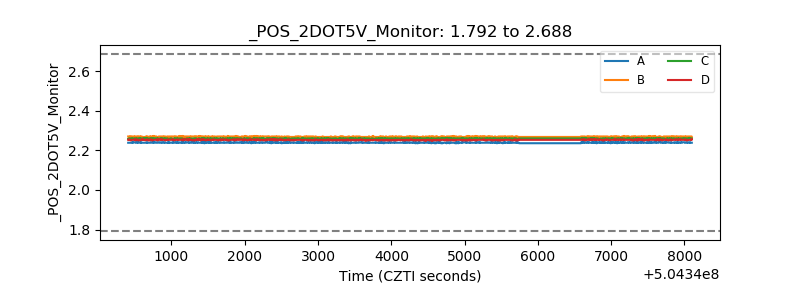 |
| +5 Volts monitor |  |
| _ROLL_ROT | 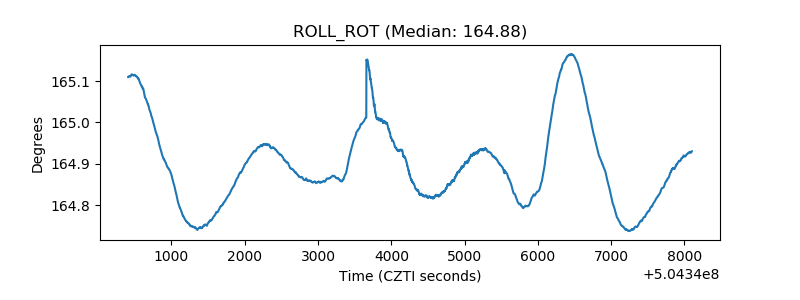 |
| _Roll_DEC | 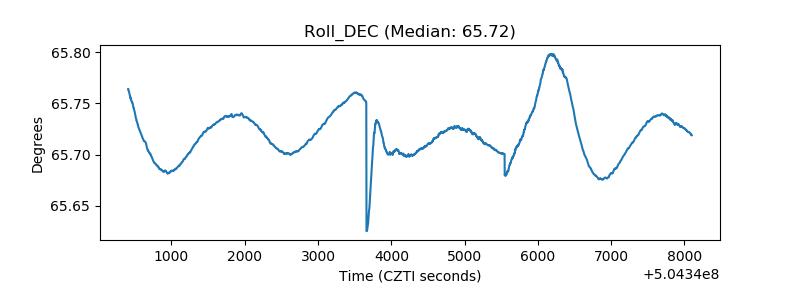 |
| _Roll_RA | 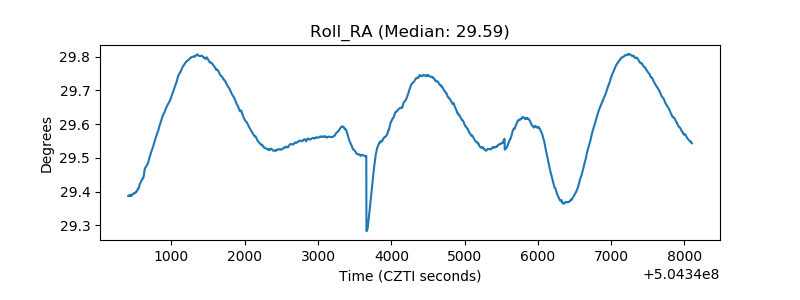 |
| Veto Counter | 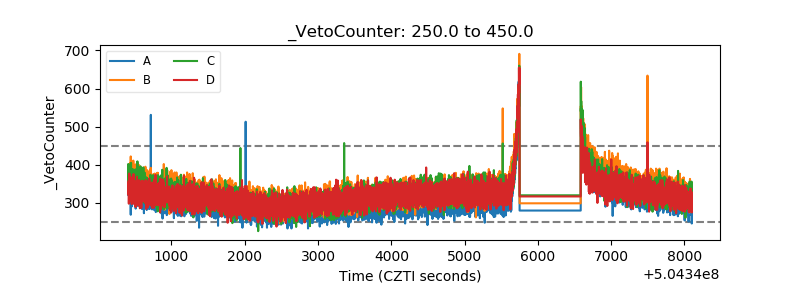 |