| Param | Original file | Final file |
|---|---|---|
| Filename | modeM0/AS1A14_099T01_9000006536_55414cztM0_level2.fits | modeM0/AS1A14_099T01_9000006536_55414cztM0_level2_quad_clean.evt |
| Size (bytes) | 398,707,200 | 85,273,920 |
| Size | 380.2 MB | 81.3 MB |
| Events in quadrant A | 2,692,419 | 569,889 |
| Events in quadrant B | 3,141,413 | 600,663 |
| Events in quadrant C | 2,825,477 | 534,176 |
| Events in quadrant D | 5,635,175 | 460,404 |
| Mode M9 | |||
|---|---|---|---|
| Quadrant | BADHDUFLAG | Total packets | Discarded packets |
| A | 0 | 10 | 0 |
| B | 0 | 10 | 0 |
| C | 0 | 10 | 0 |
| D | 0 | 10 | 0 |
| Mode SS | |||
|---|---|---|---|
| Quadrant | BADHDUFLAG | Total packets | Discarded packets |
| A | 0 | 122 | 0 |
| B | 0 | 122 | 0 |
| C | 0 | 122 | 0 |
| D | 0 | 122 | 0 |
| Mode M0 | |||
|---|---|---|---|
| Quadrant | BADHDUFLAG | Total packets | Discarded packets |
| A | 0 | 12603 | 1 |
| B | 0 | 13834 | 1 |
| C | 0 | 13123 | 1 |
| D | 0 | 20939 | 1 |
| Quadrant | Total seconds | Saturated seconds | Saturation percentage |
|---|---|---|---|
| A | 5965 | 94 | 1.575859% |
| B | 5965 | 182 | 3.051132% |
| C | 5966 | 112 | 1.877305% |
| D | 5966 | 794 | 13.308750% |
Noise dominated data is calculated using 1-second bins in cleaned event files. If a bin has >2000 counts, and if more than 50% of those come from <1% of pixels, then it is considered to be noise-dominated and hence unusable.
| Quadrant | # 1 sec bins | Bins with >0 counts | Bins with >2000 counts | High rate bins dominated by noise | Noise dominated (total time) | Noise dominated (detector-on time) | Marked lightcurve |
|---|---|---|---|---|---|---|---|
| A | 6945 | 5966 | 25 | 25 | 0.36% | 0.42% | 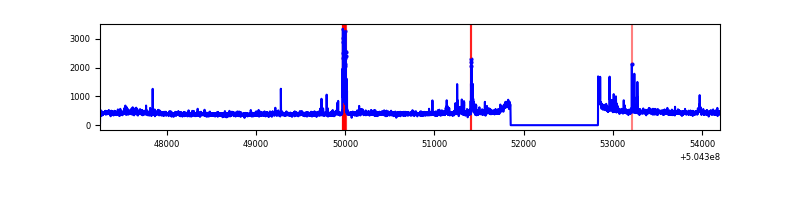 |
| B | 6945 | 5966 | 82 | 82 | 1.18% | 1.37% | 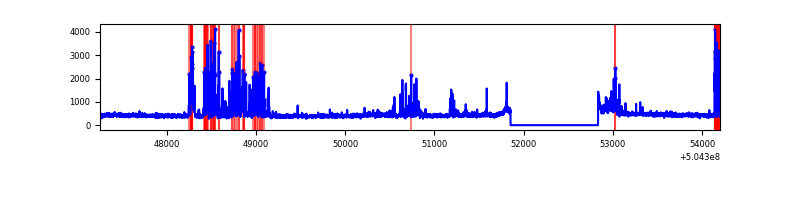 |
| C | 6946 | 5967 | 64 | 64 | 0.92% | 1.07% | 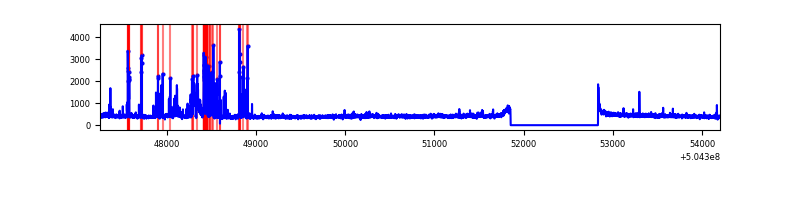 |
| D | 6946 | 5967 | 656 | 656 | 9.44% | 10.99% | 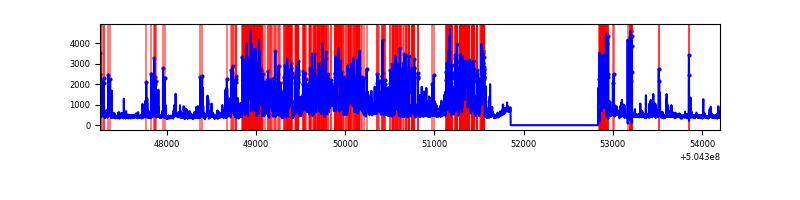 |
Top three noisy pixels from each quadrant. If the there are fewer than three noisy pixels in the level2.evt file, extra rows are filled as -1
| Pixel properties | Quadrant properties | ||||||
|---|---|---|---|---|---|---|---|
| Quadrant | DetID | PixID | Counts | Sigma | Mean | Median | Sigma |
| A | 0 | 8 | 99118 | 620.67 | 632 | 615 | 158.7 |
| A | 4 | 159 | 53610 | 333.92 | 632 | 615 | 158.7 |
| A | 15 | 32 | 39028 | 242.04 | 632 | 615 | 158.7 |
| B | 5 | 185 | 558219 | 4245.56 | 616 | 595 | 131.3 |
| B | 5 | 172 | 106458 | 806.0 | 616 | 595 | 131.3 |
| B | 12 | 111 | 16068 | 117.81 | 616 | 595 | 131.3 |
| C | 13 | 3 | 348985 | 2077.17 | 606 | 598 | 167.7 |
| C | 10 | 19 | 37762 | 221.58 | 606 | 598 | 167.7 |
| C | 15 | 157 | 36303 | 212.88 | 606 | 598 | 167.7 |
| D | 11 | 129 | 2501435 | 15211.95 | 579 | 552 | 164.4 |
| D | 2 | 249 | 333100 | 2022.76 | 579 | 552 | 164.4 |
| D | 10 | 181 | 112577 | 681.4 | 579 | 552 | 164.4 |
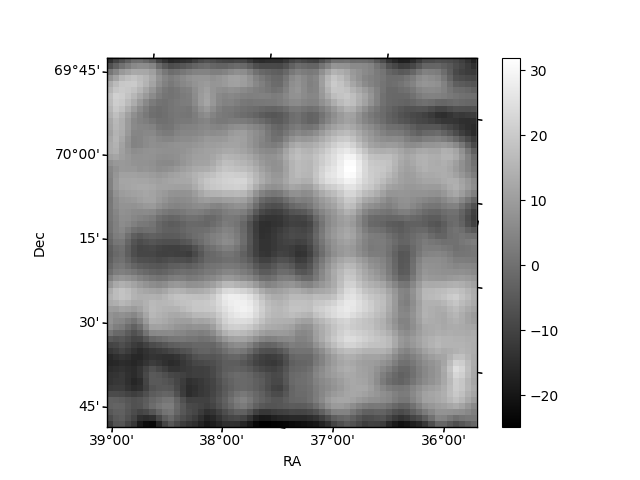
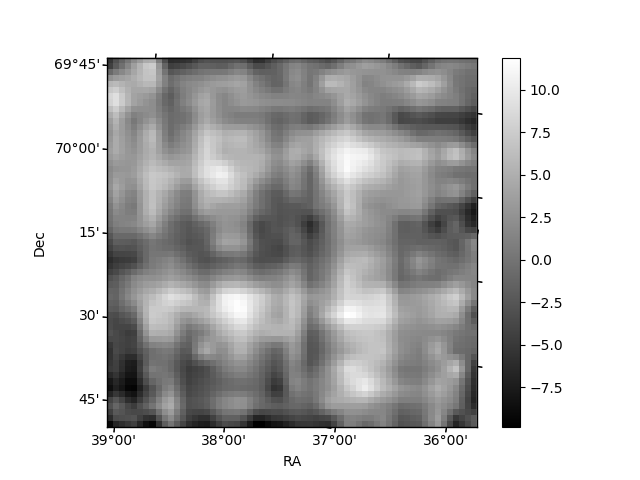
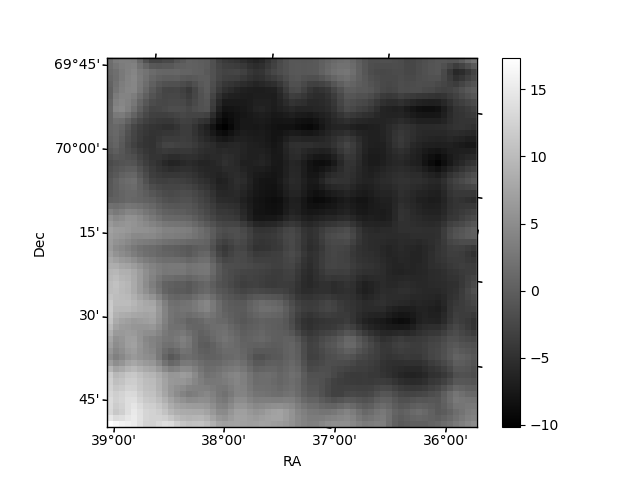
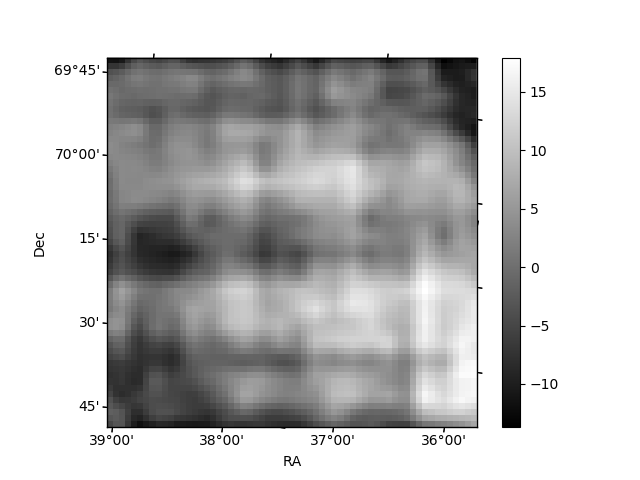
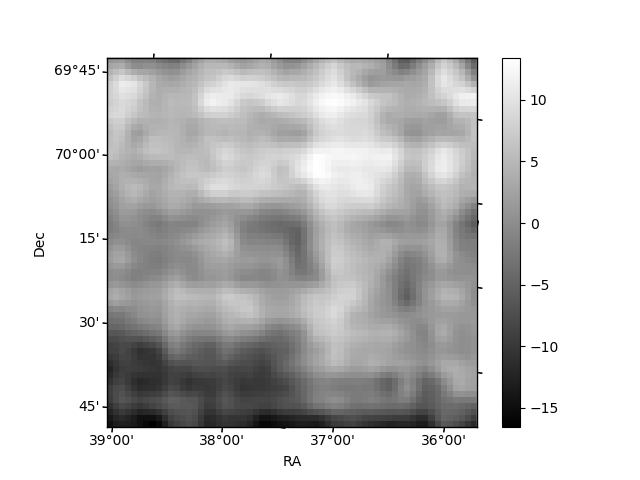
Histogram calculated using DETX and DETY for each event in the final _common_clean file
| Quadrant A | 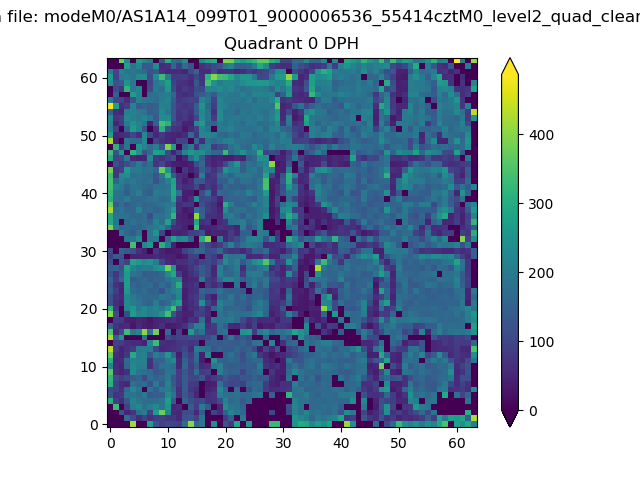 |
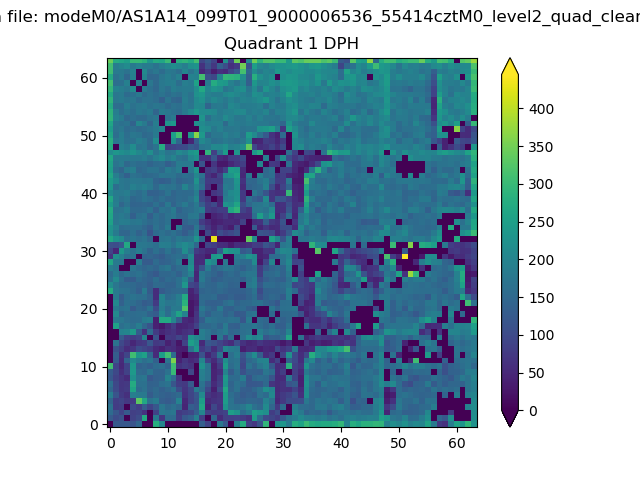 |
Quadrant B |
|---|---|---|---|
| Quadrant D | 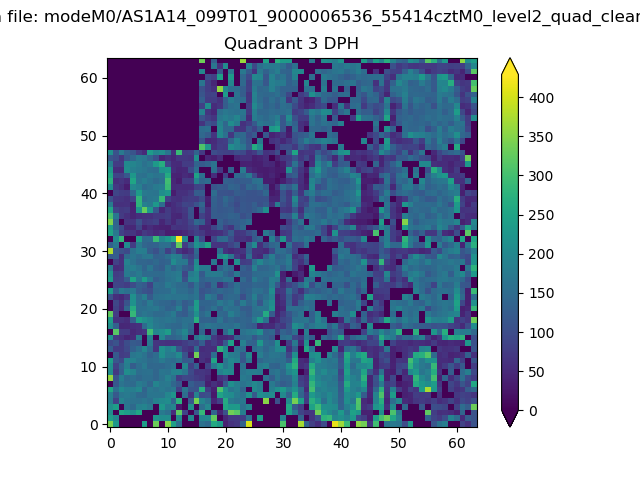 |
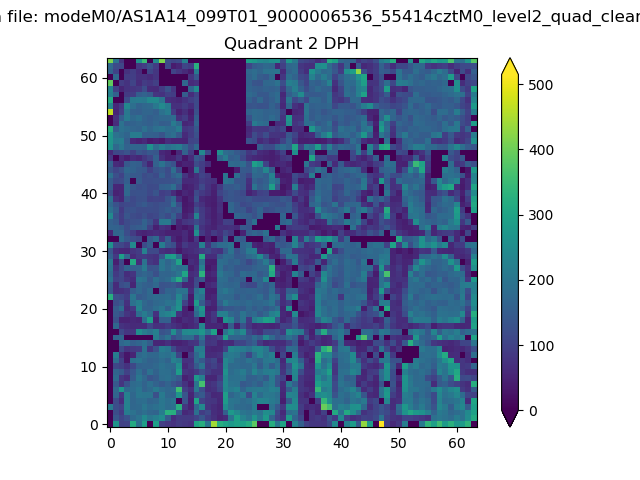 |
Quadrant C |
| Plot type | Count rate plots | Images |
|---|---|---|
| Comparison with Poisson distribution Blue bars denote a histogram of data divided into 1 sec bins. Red curve is a Poisson curve with rate = median count rate of data. |
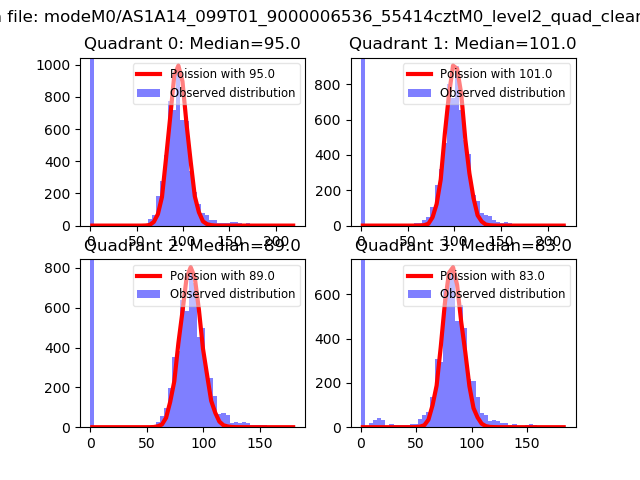 |
 |
| Quadrant-wise count rates Data is divided into 100 sec bins |
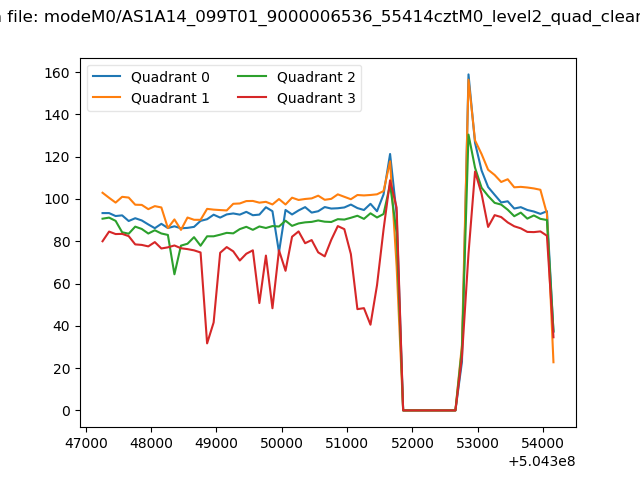 |
|
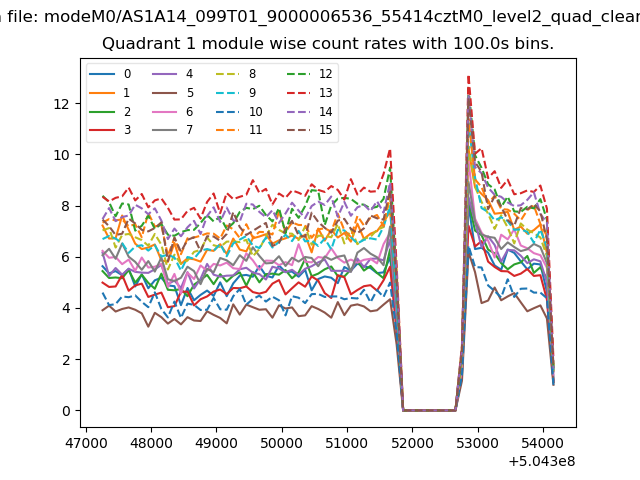
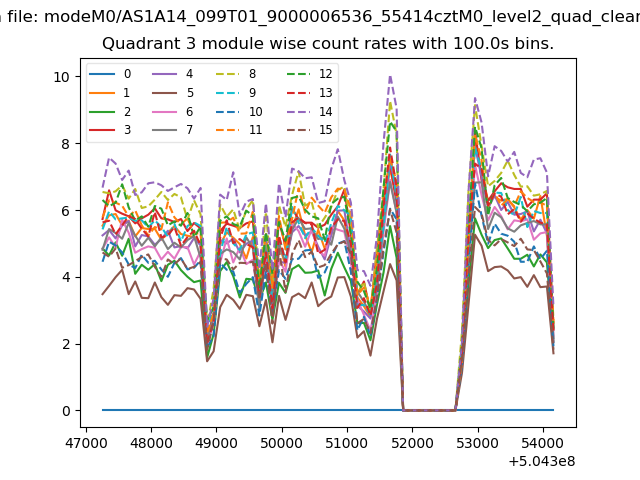
| Module-wise count rates for Quadrant A Data is divided into 100 sec bins |
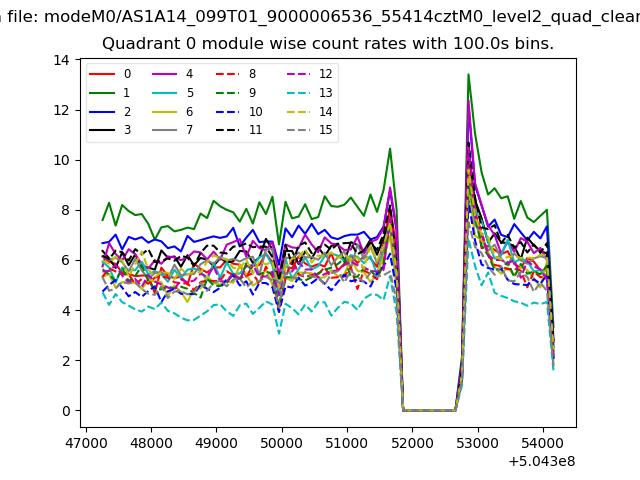 |
 |
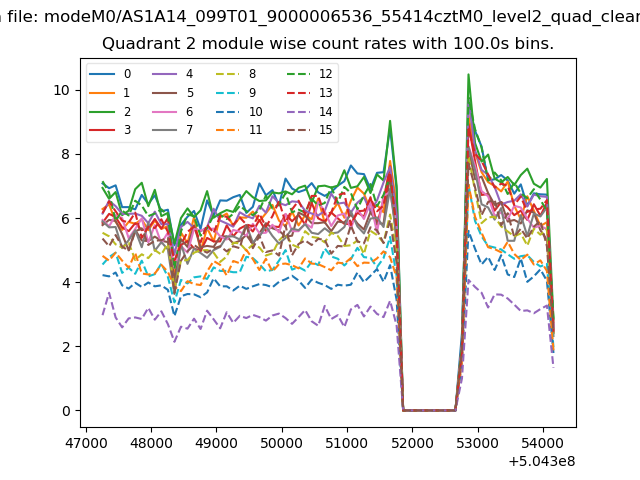
| Module-wise count rates for Quadrant B Data is divided into 100 sec bins |
 |
 |
| Module-wise count rates for Quadrant C Data is divided into 100 sec bins |
 |
 |
| Module-wise count rates for Quadrant D Data is divided into 100 sec bins |
 |
 |
| Parameter | Plot |
|---|---|
| CZT HV Monitor | 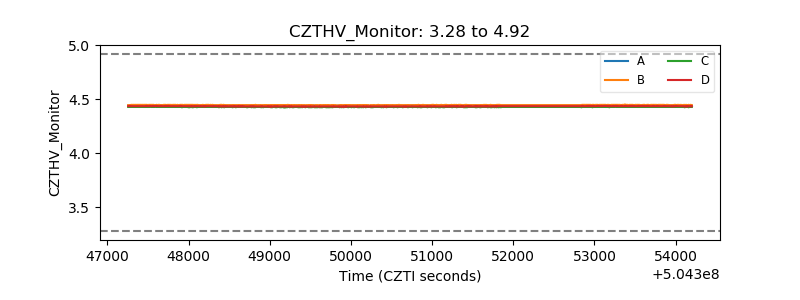 |
| D_VDD | 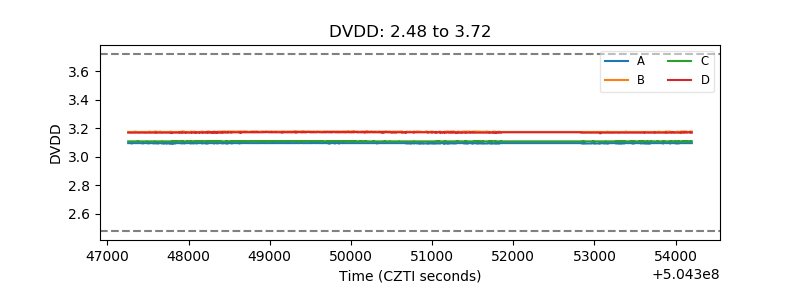 |
| Temperature 1 | 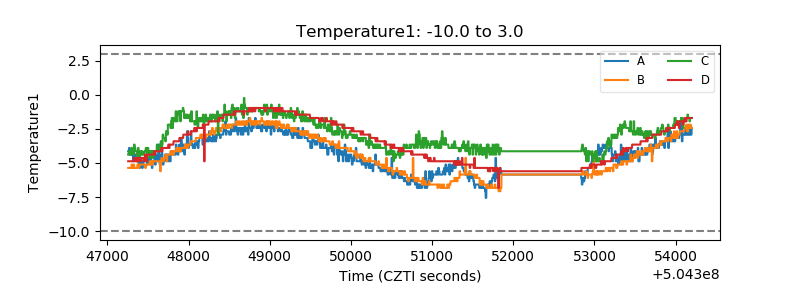 |
| Veto HV Monitor | 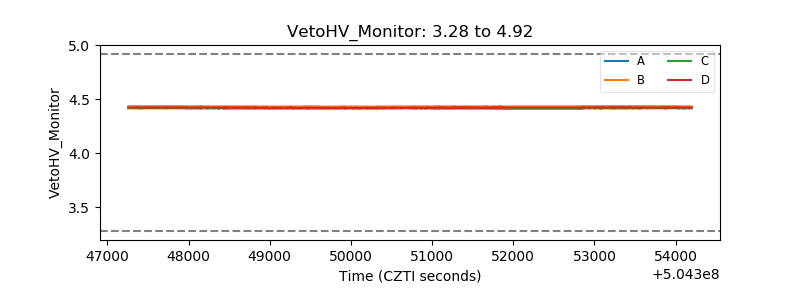 |
| Veto LLD | 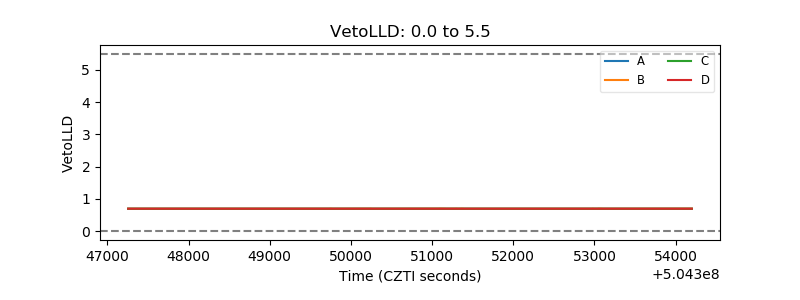 |
| Alpha Counter | 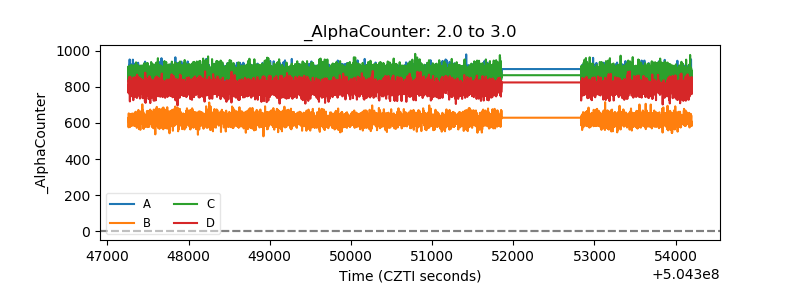 |
| _CPM_Rate | 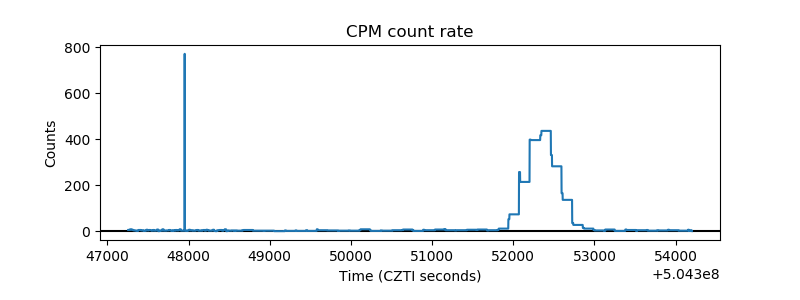 |
| CZT Counter | 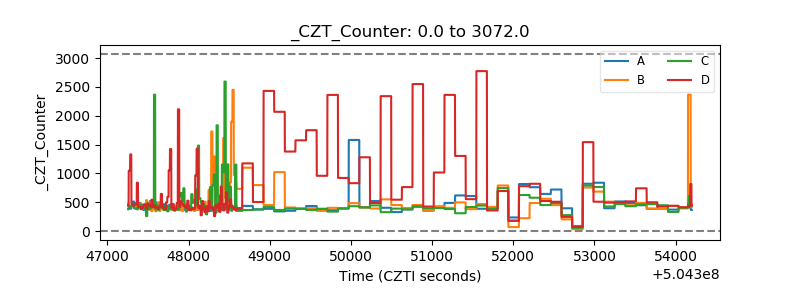 |
| +2.5 Volts monitor | 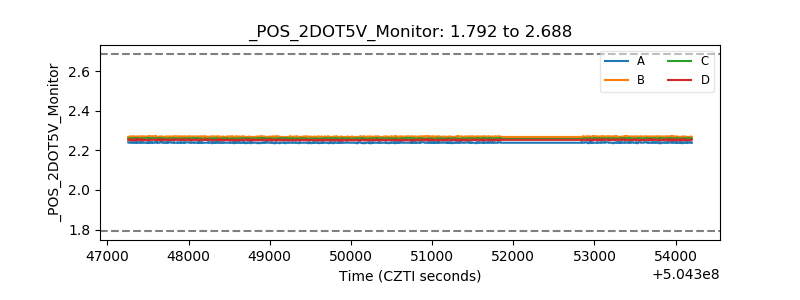 |
| +5 Volts monitor | 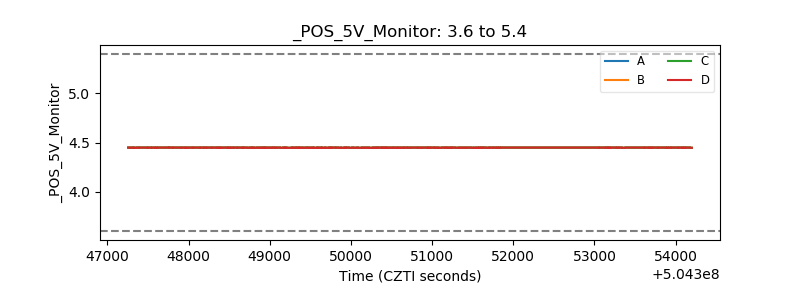 |
| _ROLL_ROT | 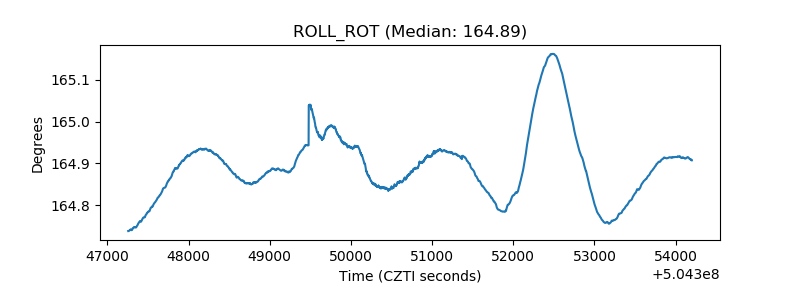 |
| _Roll_DEC | 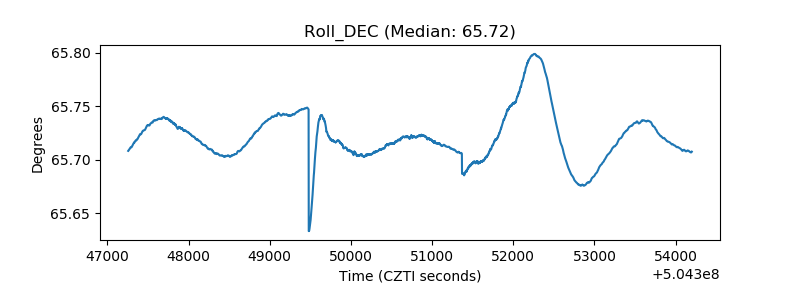 |
| _Roll_RA | 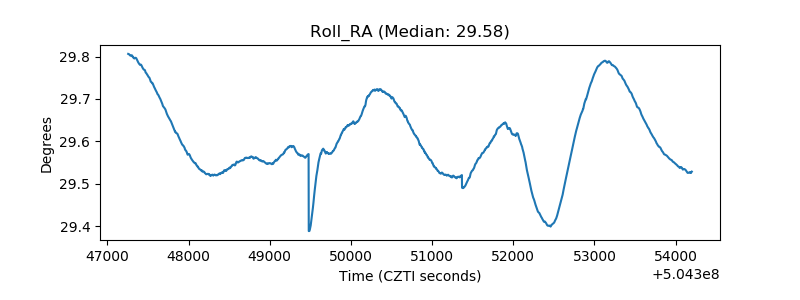 |
| Veto Counter | 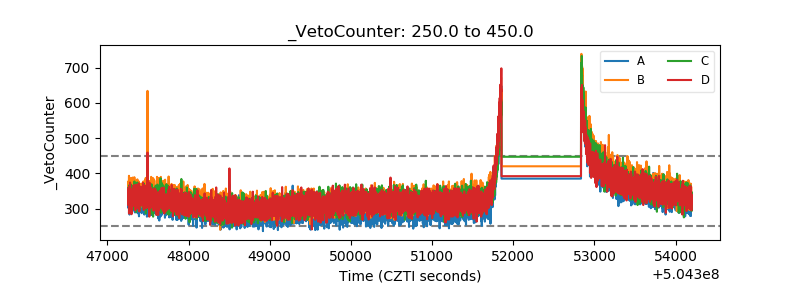 |