| Param | Original file | Final file |
|---|---|---|
| Filename | modeM0/AS1A14_099T01_9000006536_55416cztM0_level2.fits | modeM0/AS1A14_099T01_9000006536_55416cztM0_level2_quad_clean.evt |
| Size (bytes) | 549,204,480 | 93,502,080 |
| Size | 523.8 MB | 89.2 MB |
| Events in quadrant A | 2,952,407 | 672,213 |
| Events in quadrant B | 3,056,454 | 714,949 |
| Events in quadrant C | 3,088,083 | 629,916 |
| Events in quadrant D | 10,719,492 | 354,408 |
| Mode M9 | |||
|---|---|---|---|
| Quadrant | BADHDUFLAG | Total packets | Discarded packets |
| A | 0 | 12 | 0 |
| B | 0 | 12 | 0 |
| C | 0 | 12 | 0 |
| D | 0 | 12 | 0 |
| Mode SS | |||
|---|---|---|---|
| Quadrant | BADHDUFLAG | Total packets | Discarded packets |
| A | 0 | 132 | 0 |
| B | 0 | 132 | 0 |
| C | 0 | 132 | 0 |
| D | 0 | 132 | 0 |
| Mode M0 | |||
|---|---|---|---|
| Quadrant | BADHDUFLAG | Total packets | Discarded packets |
| A | 0 | 13610 | 1 |
| B | 0 | 13891 | 1 |
| C | 0 | 14196 | 1 |
| D | 0 | 36390 | 2 |
| Quadrant | Total seconds | Saturated seconds | Saturation percentage |
|---|---|---|---|
| A | 6597 | 66 | 1.000455% |
| B | 6597 | 83 | 1.258148% |
| C | 6598 | 61 | 0.924523% |
| D | 6597 | 2970 | 45.020464% |
Noise dominated data is calculated using 1-second bins in cleaned event files. If a bin has >2000 counts, and if more than 50% of those come from <1% of pixels, then it is considered to be noise-dominated and hence unusable.
| Quadrant | # 1 sec bins | Bins with >0 counts | Bins with >2000 counts | High rate bins dominated by noise | Noise dominated (total time) | Noise dominated (detector-on time) | Marked lightcurve |
|---|---|---|---|---|---|---|---|
| A | 7742 | 6598 | 5 | 5 | 0.06% | 0.08% | 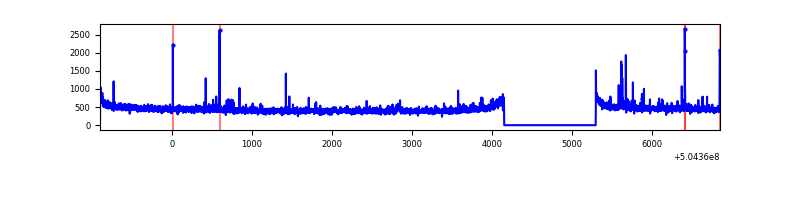 |
| B | 7742 | 6598 | 8 | 8 | 0.10% | 0.12% | 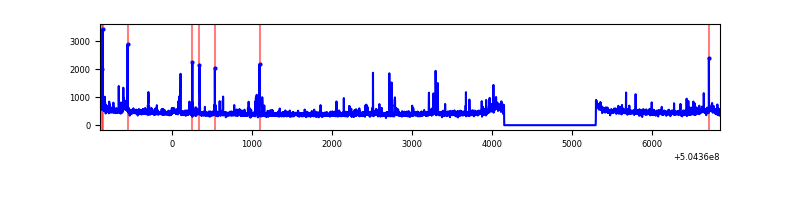 |
| C | 7743 | 6599 | 18 | 18 | 0.23% | 0.27% | 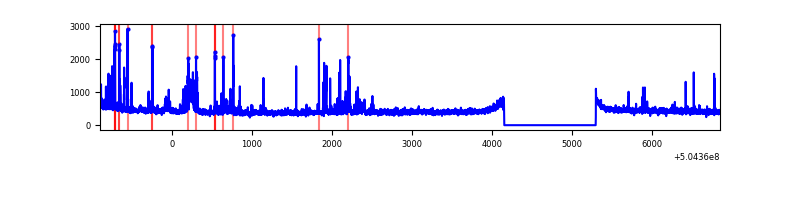 |
| D | 7742 | 6597 | 2413 | 2413 | 31.17% | 36.58% | 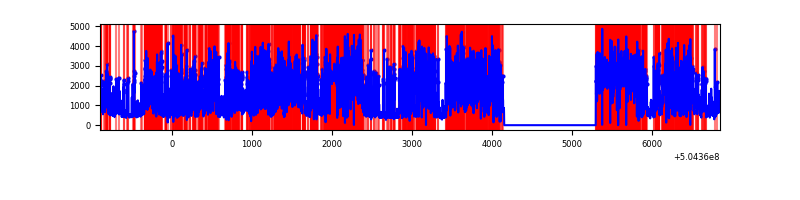 |
Top three noisy pixels from each quadrant. If the there are fewer than three noisy pixels in the level2.evt file, extra rows are filled as -1
| Pixel properties | Quadrant properties | ||||||
|---|---|---|---|---|---|---|---|
| Quadrant | DetID | PixID | Counts | Sigma | Mean | Median | Sigma |
| A | 15 | 32 | 29180 | 158.59 | 727 | 708 | 179.5 |
| A | 4 | 3 | 21772 | 117.33 | 727 | 708 | 179.5 |
| A | 12 | 3 | 21376 | 115.12 | 727 | 708 | 179.5 |
| B | 5 | 236 | 45148 | 293.64 | 711 | 686 | 151.4 |
| B | 10 | 247 | 36508 | 236.58 | 711 | 686 | 151.4 |
| B | 0 | 183 | 34193 | 221.29 | 711 | 686 | 151.4 |
| C | 12 | 252 | 167560 | 871.62 | 699 | 692 | 191.4 |
| C | 13 | 3 | 137999 | 717.21 | 699 | 692 | 191.4 |
| C | 1 | 241 | 14080 | 69.93 | 699 | 692 | 191.4 |
| D | 11 | 129 | 7930843 | 53430.32 | 522 | 499 | 148.4 |
| D | 2 | 249 | 148946 | 1000.15 | 522 | 499 | 148.4 |
| D | 2 | 31 | 126069 | 846.02 | 522 | 499 | 148.4 |
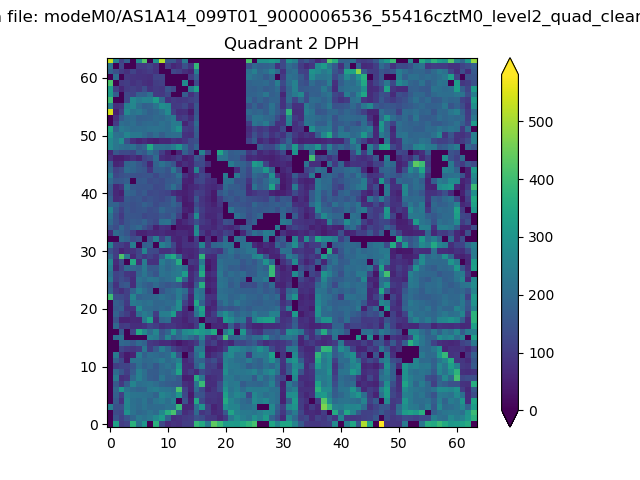
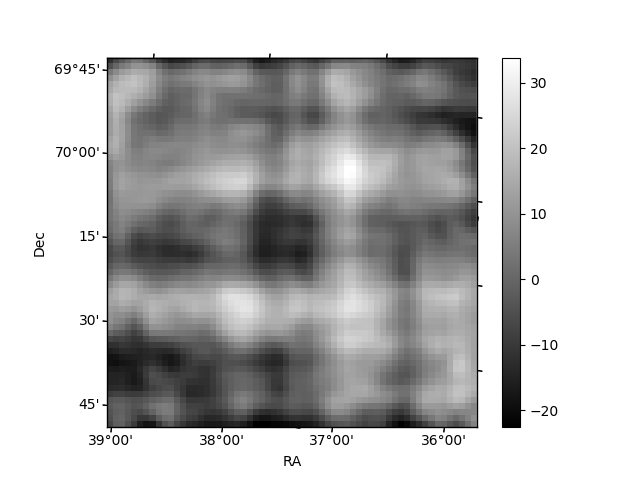
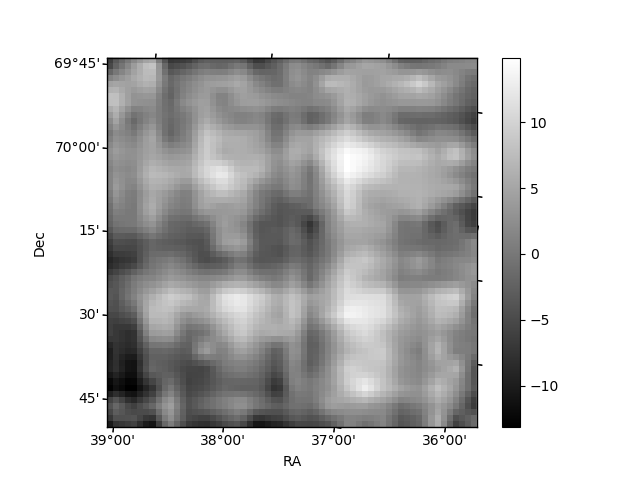
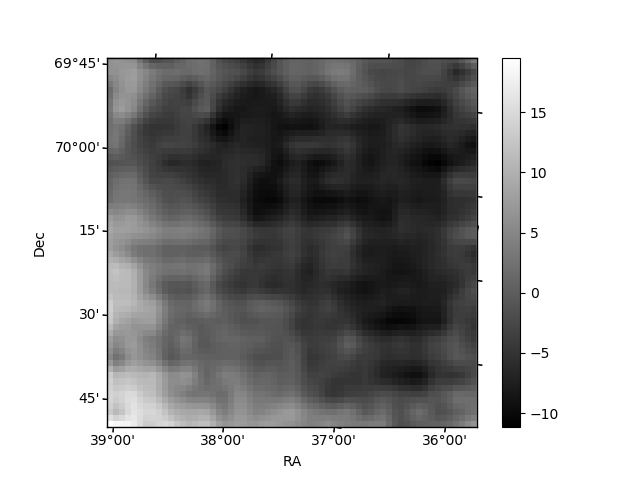
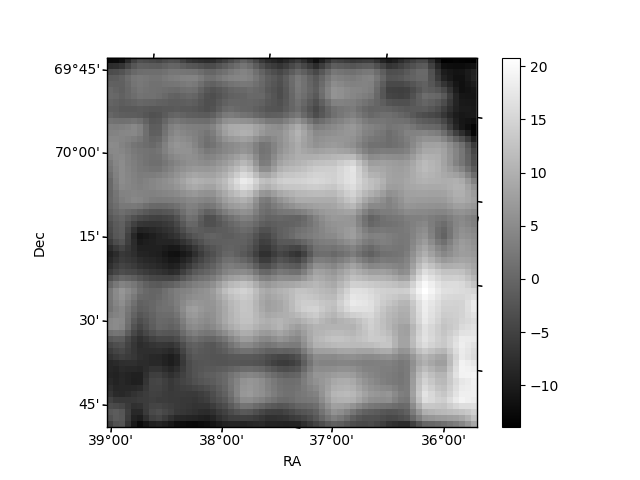
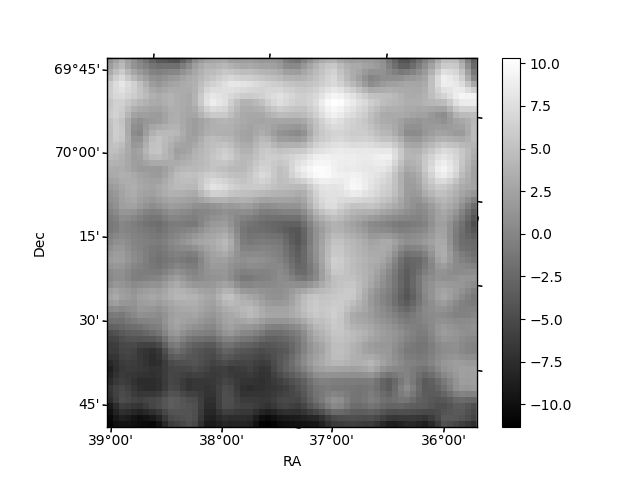
Histogram calculated using DETX and DETY for each event in the final _common_clean file
| Quadrant A | 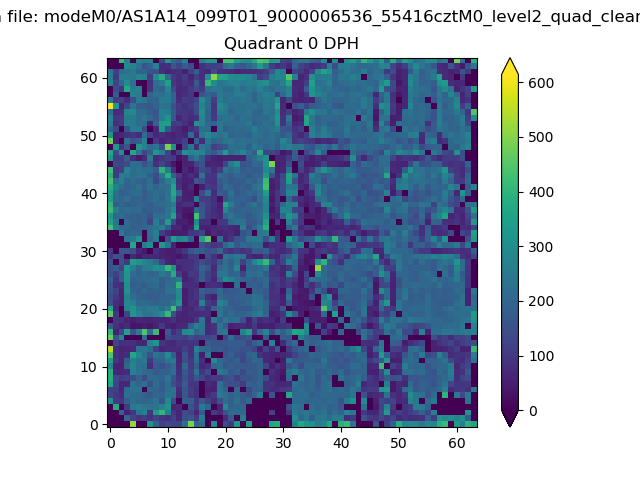 |
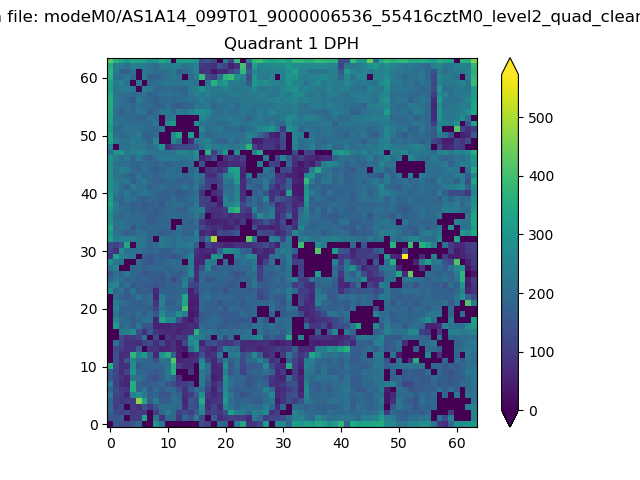 |
Quadrant B |
|---|---|---|---|
| Quadrant D | 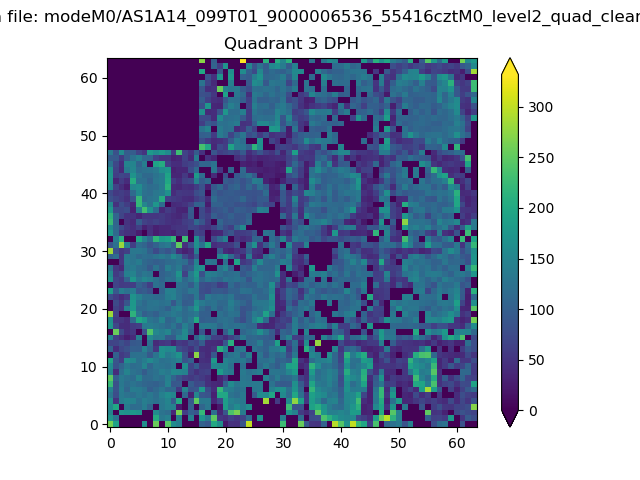 |
 |
Quadrant C |
| Plot type | Count rate plots | Images |
|---|---|---|
| Comparison with Poisson distribution Blue bars denote a histogram of data divided into 1 sec bins. Red curve is a Poisson curve with rate = median count rate of data. |
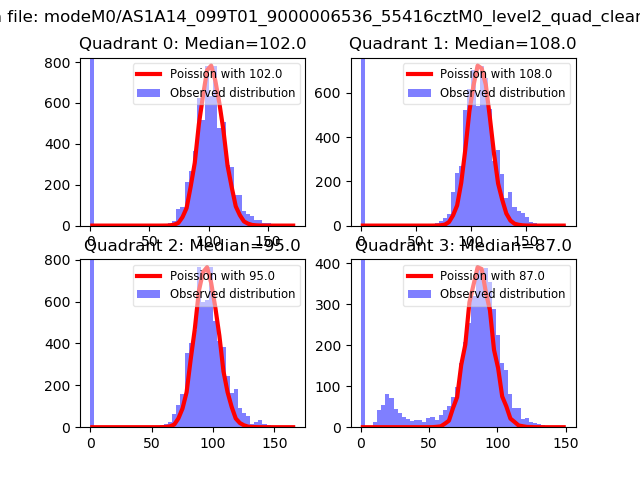 |
 |
| Quadrant-wise count rates Data is divided into 100 sec bins |
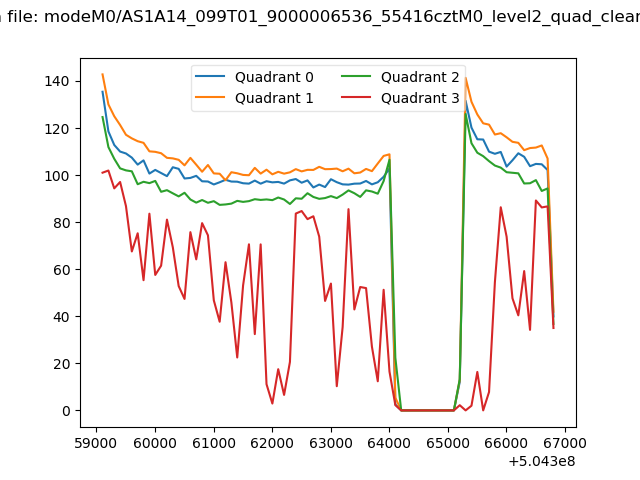 |
|
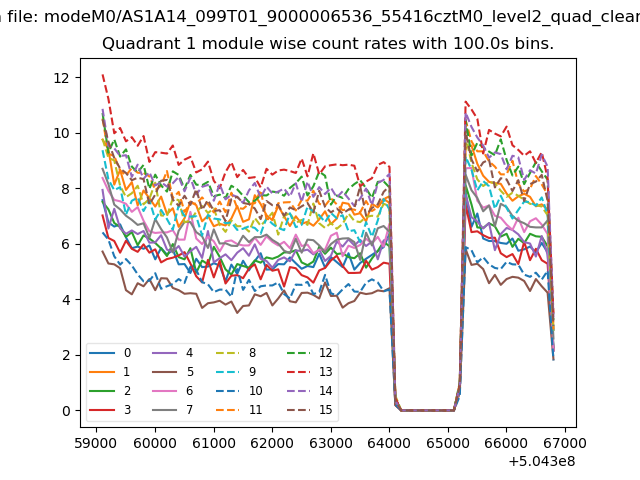
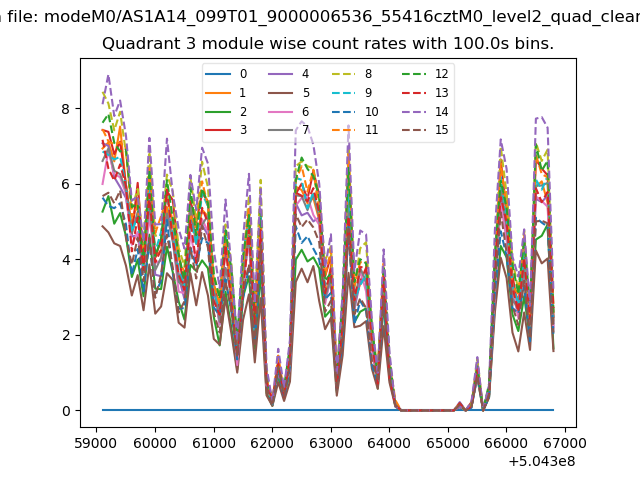
| Module-wise count rates for Quadrant A Data is divided into 100 sec bins |
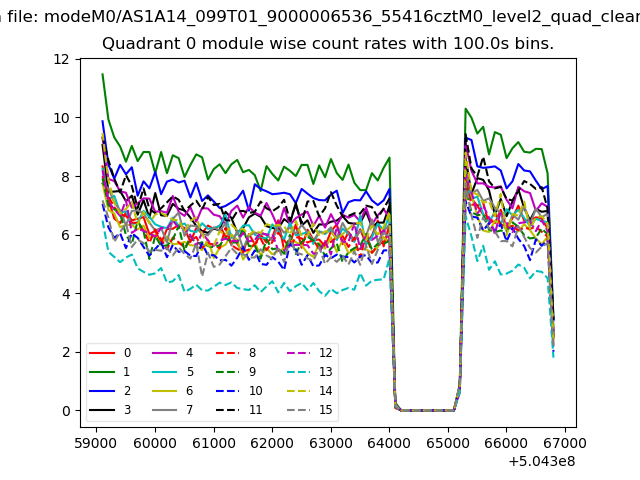 |
 |
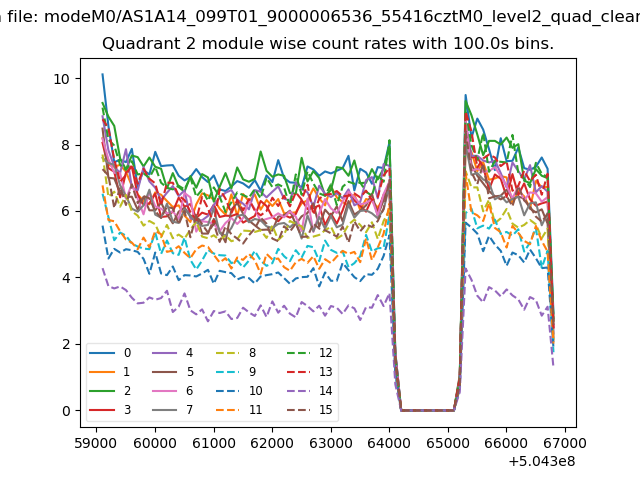
| Module-wise count rates for Quadrant B Data is divided into 100 sec bins |
 |
 |
| Module-wise count rates for Quadrant C Data is divided into 100 sec bins |
 |
 |
| Module-wise count rates for Quadrant D Data is divided into 100 sec bins |
 |
 |
| Parameter | Plot |
|---|---|
| CZT HV Monitor | 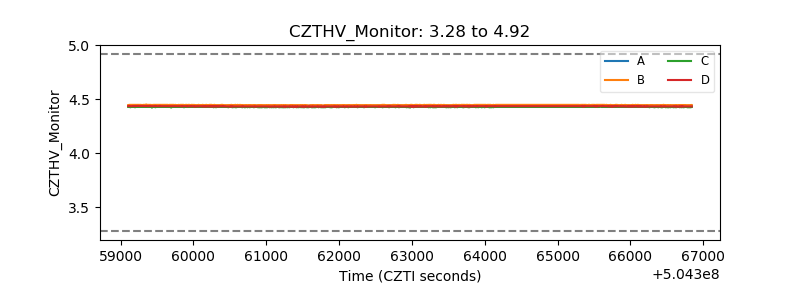 |
| D_VDD | 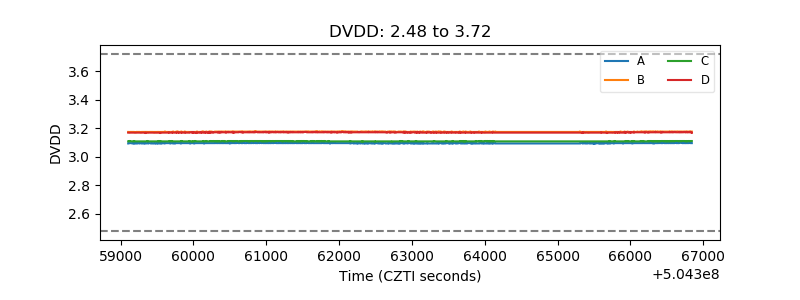 |
| Temperature 1 | 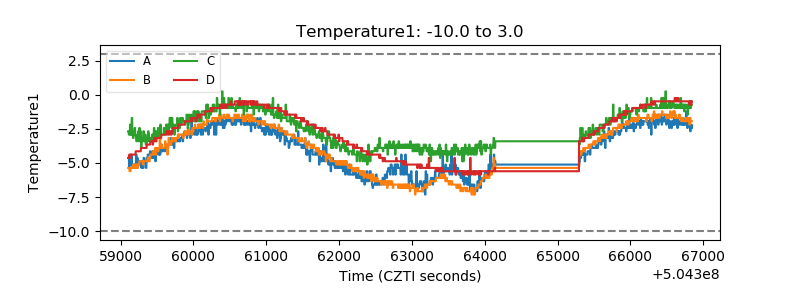 |
| Veto HV Monitor | 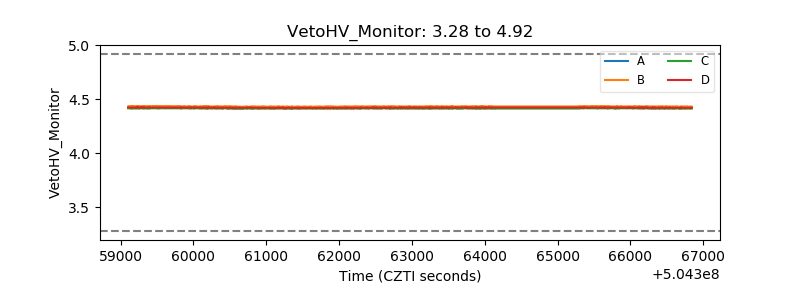 |
| Veto LLD | 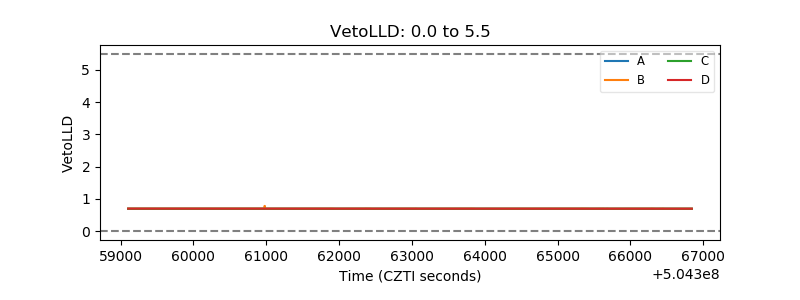 |
| Alpha Counter | 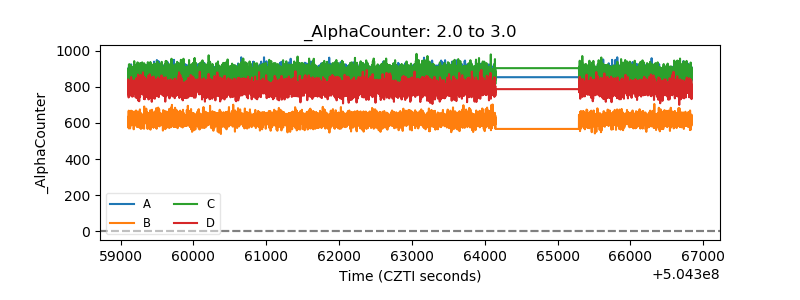 |
| _CPM_Rate | 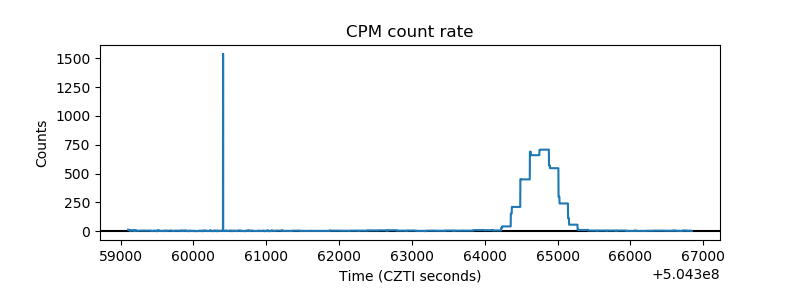 |
| CZT Counter | 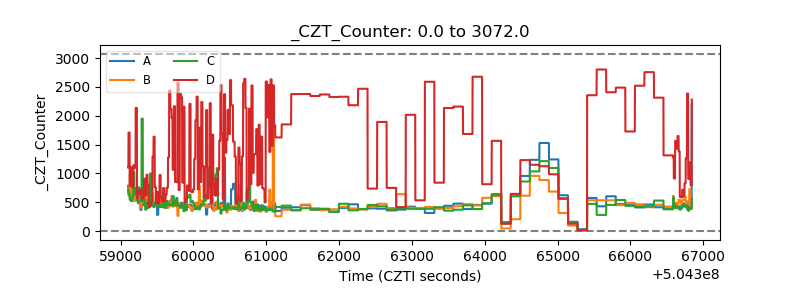 |
| +2.5 Volts monitor | 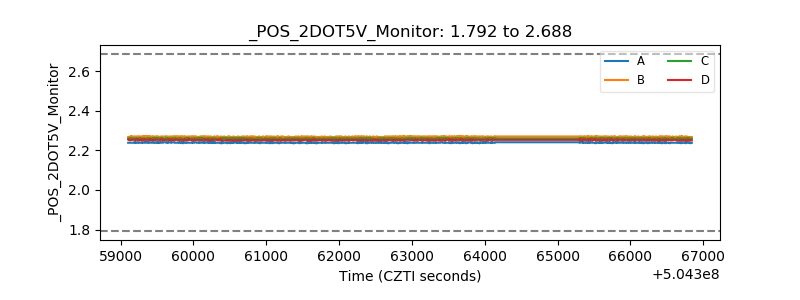 |
| +5 Volts monitor | 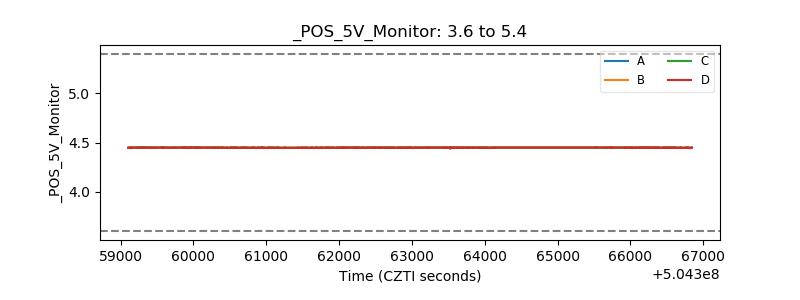 |
| _ROLL_ROT | 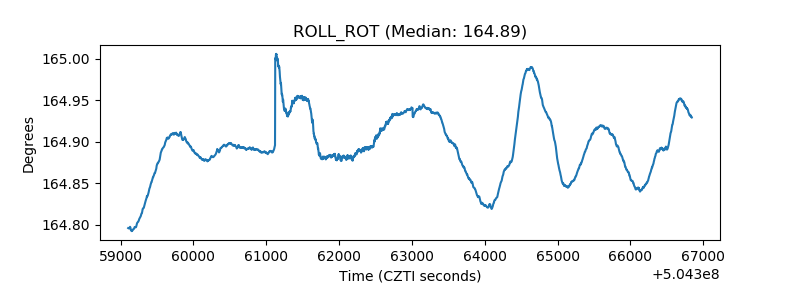 |
| _Roll_DEC | 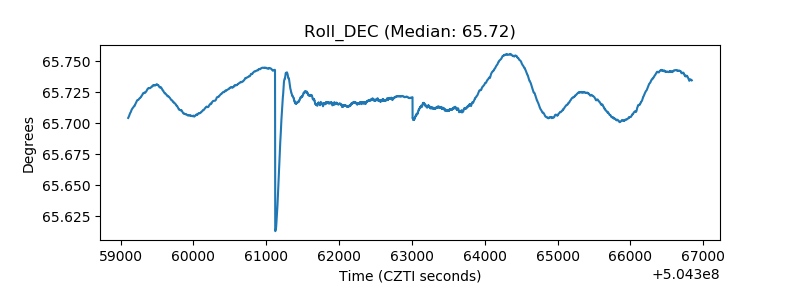 |
| _Roll_RA | 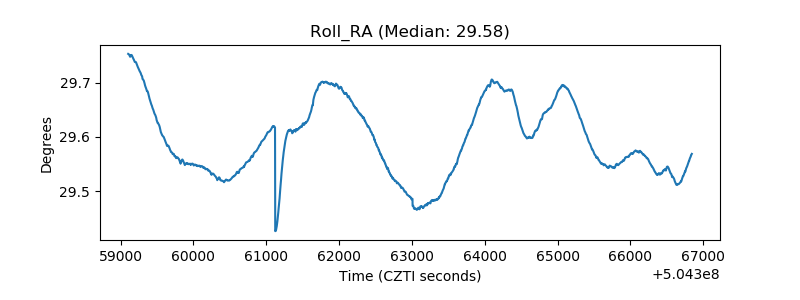 |
| Veto Counter | 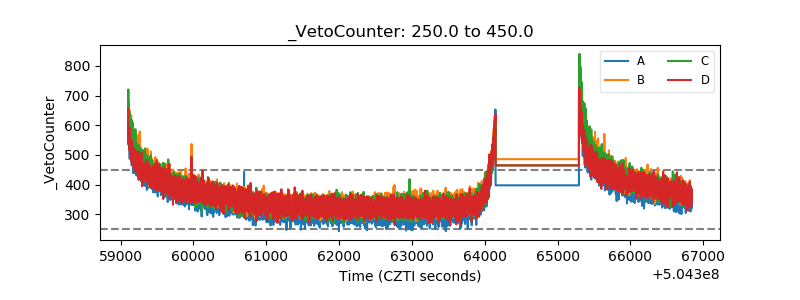 |