| Param | Original file | Final file |
|---|---|---|
| Filename | modeM0/AS1A14_099T01_9000006536_55417cztM0_level2.fits | modeM0/AS1A14_099T01_9000006536_55417cztM0_level2_quad_clean.evt |
| Size (bytes) | 614,859,840 | 76,371,840 |
| Size | 586.4 MB | 72.8 MB |
| Events in quadrant A | 2,676,879 | 605,956 |
| Events in quadrant B | 2,777,785 | 638,138 |
| Events in quadrant C | 3,770,128 | 523,586 |
| Events in quadrant D | 13,068,460 | 126,236 |
| Mode M9 | |||
|---|---|---|---|
| Quadrant | BADHDUFLAG | Total packets | Discarded packets |
| A | 0 | 12 | 0 |
| B | 0 | 12 | 0 |
| C | 0 | 12 | 0 |
| D | 0 | 12 | 0 |
| Mode SS | |||
|---|---|---|---|
| Quadrant | BADHDUFLAG | Total packets | Discarded packets |
| A | 0 | 122 | 0 |
| B | 0 | 122 | 0 |
| C | 0 | 122 | 0 |
| D | 0 | 122 | 0 |
| Mode M0 | |||
|---|---|---|---|
| Quadrant | BADHDUFLAG | Total packets | Discarded packets |
| A | 0 | 12429 | 1 |
| B | 0 | 12675 | 2 |
| C | 0 | 15773 | 1 |
| D | 0 | 42912 | 1 |
| Quadrant | Total seconds | Saturated seconds | Saturation percentage |
|---|---|---|---|
| A | 5992 | 70 | 1.168224% |
| B | 5992 | 101 | 1.685581% |
| C | 5992 | 538 | 8.978638% |
| D | 5992 | 4793 | 79.989987% |
Noise dominated data is calculated using 1-second bins in cleaned event files. If a bin has >2000 counts, and if more than 50% of those come from <1% of pixels, then it is considered to be noise-dominated and hence unusable.
| Quadrant | # 1 sec bins | Bins with >0 counts | Bins with >2000 counts | High rate bins dominated by noise | Noise dominated (total time) | Noise dominated (detector-on time) | Marked lightcurve |
|---|---|---|---|---|---|---|---|
| A | 7162 | 5993 | 7 | 7 | 0.10% | 0.12% | 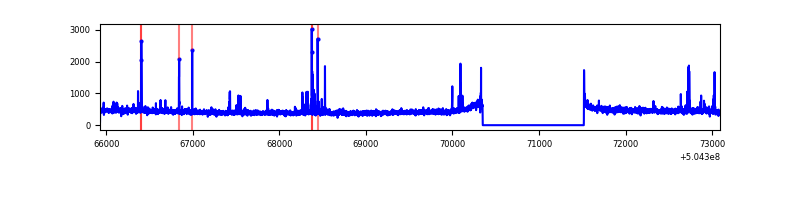 |
| B | 7162 | 5993 | 21 | 21 | 0.29% | 0.35% | 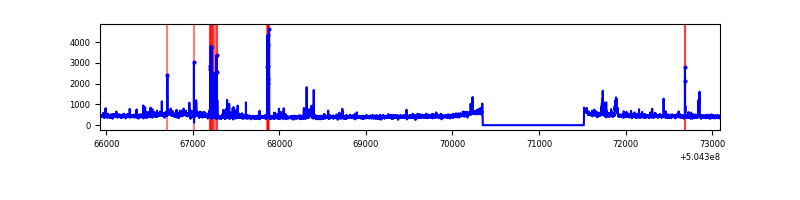 |
| C | 7162 | 5993 | 372 | 372 | 5.19% | 6.21% | 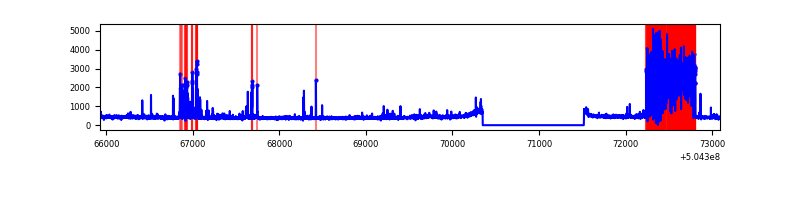 |
| D | 7161 | 5990 | 3967 | 3967 | 55.40% | 66.23% | 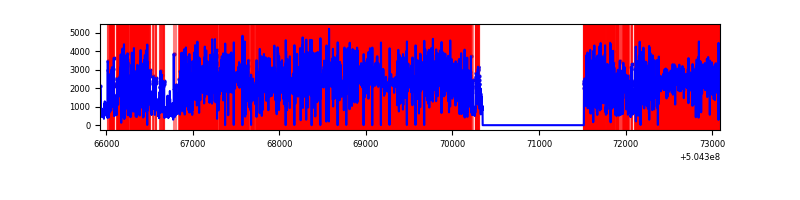 |
Top three noisy pixels from each quadrant. If the there are fewer than three noisy pixels in the level2.evt file, extra rows are filled as -1
| Pixel properties | Quadrant properties | ||||||
|---|---|---|---|---|---|---|---|
| Quadrant | DetID | PixID | Counts | Sigma | Mean | Median | Sigma |
| A | 0 | 8 | 44599 | 271.77 | 648 | 632 | 161.8 |
| A | 12 | 3 | 37217 | 226.14 | 648 | 632 | 161.8 |
| A | 13 | 254 | 18586 | 110.98 | 648 | 632 | 161.8 |
| B | 5 | 236 | 115824 | 869.72 | 633 | 611 | 132.5 |
| B | 5 | 185 | 61512 | 459.73 | 633 | 611 | 132.5 |
| B | 5 | 255 | 34088 | 252.71 | 633 | 611 | 132.5 |
| C | 12 | 252 | 1146107 | 6868.37 | 604 | 596 | 166.8 |
| C | 13 | 3 | 225988 | 1351.43 | 604 | 596 | 166.8 |
| C | 12 | 250 | 17402 | 100.77 | 604 | 596 | 166.8 |
| D | 11 | 129 | 11566694 | 136655.31 | 298 | 284 | 84.6 |
| D | 2 | 249 | 89549 | 1054.65 | 298 | 284 | 84.6 |
| D | 11 | 176 | 61043 | 717.86 | 298 | 284 | 84.6 |
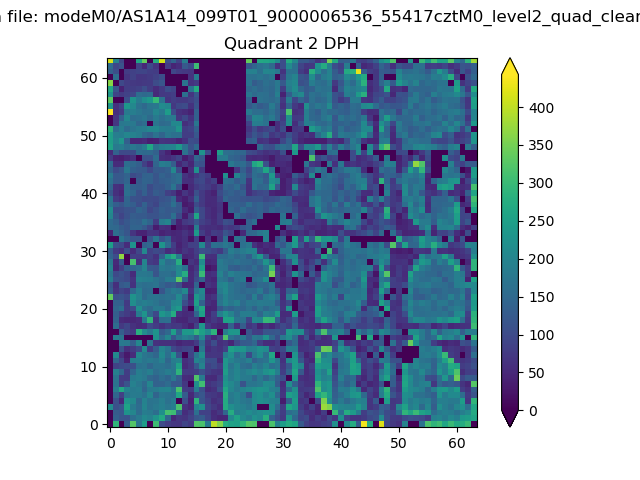
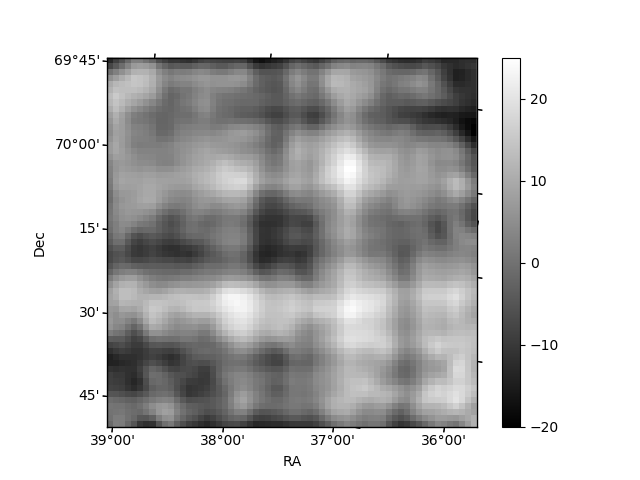
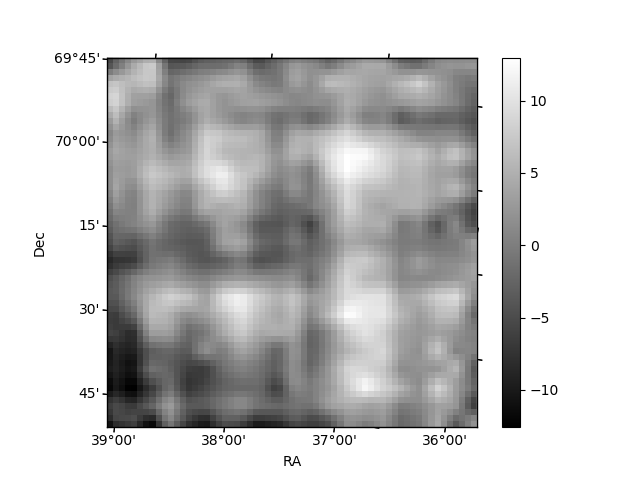
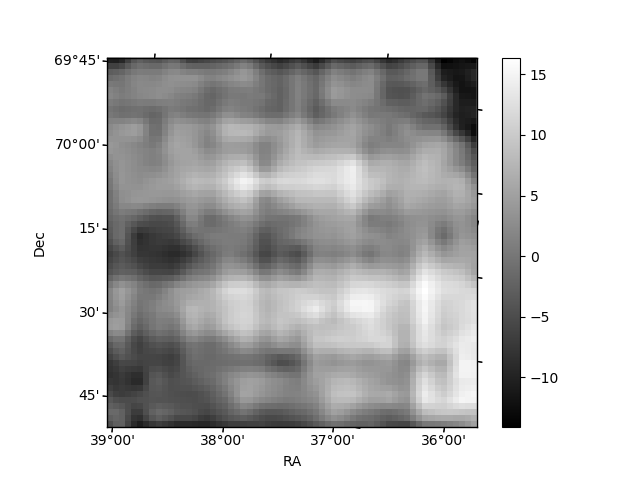
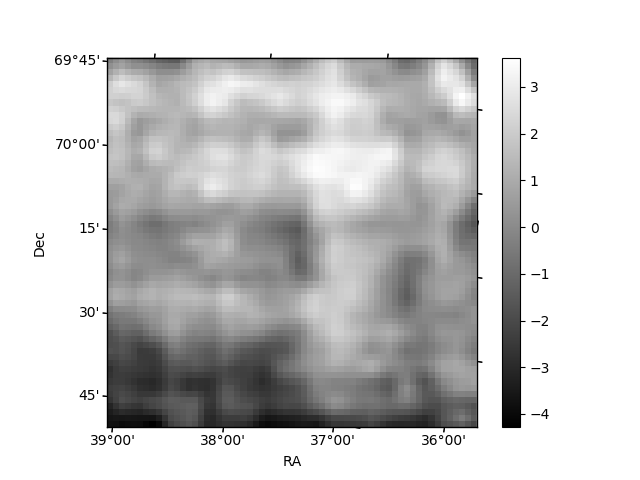
Histogram calculated using DETX and DETY for each event in the final _common_clean file
| Quadrant A | 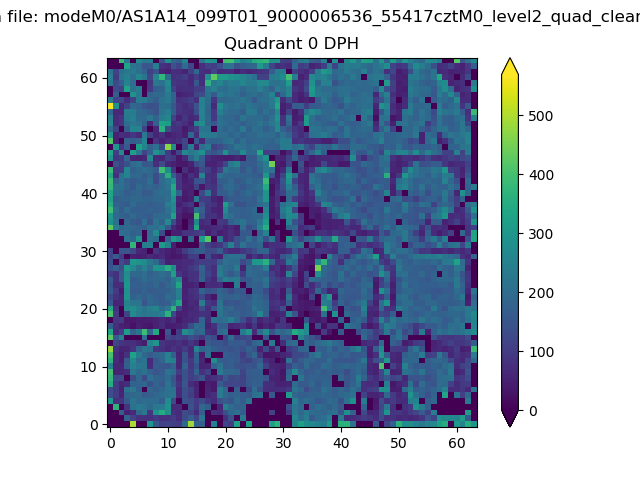 |
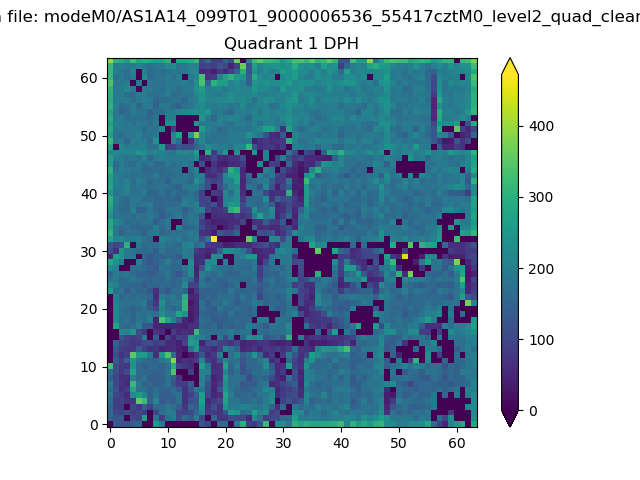 |
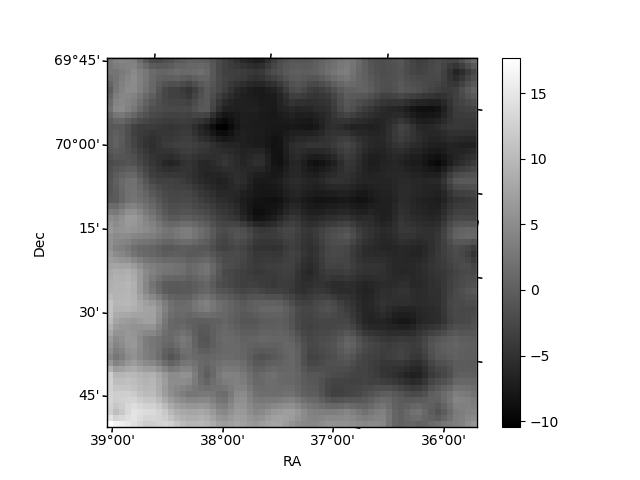
Quadrant B |
|---|---|---|---|
| Quadrant D | 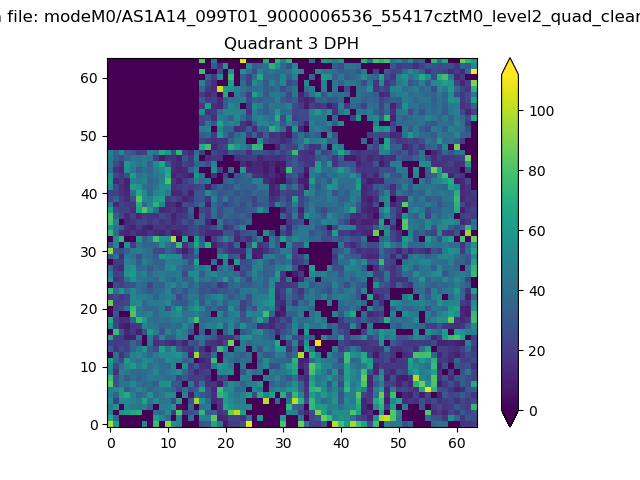 |
 |
Quadrant C |
| Plot type | Count rate plots | Images |
|---|---|---|
| Comparison with Poisson distribution Blue bars denote a histogram of data divided into 1 sec bins. Red curve is a Poisson curve with rate = median count rate of data. |
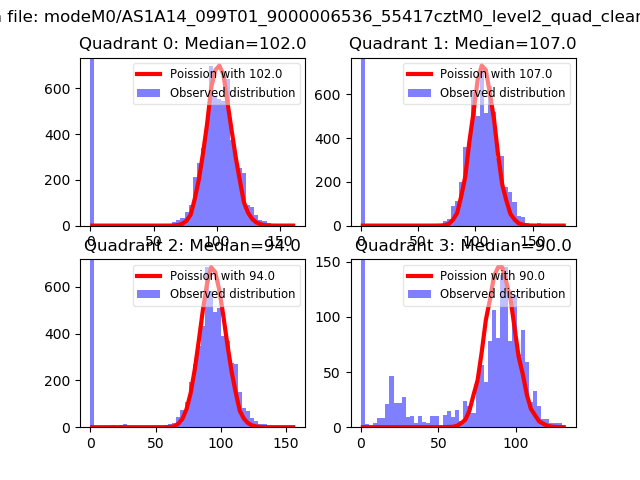 |
 |
| Quadrant-wise count rates Data is divided into 100 sec bins |
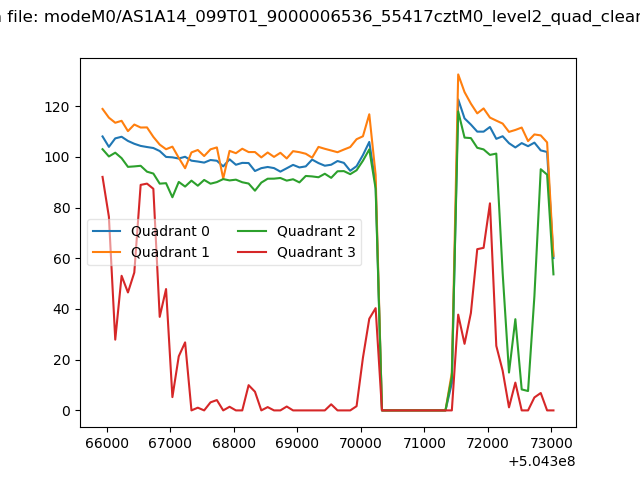 |
|
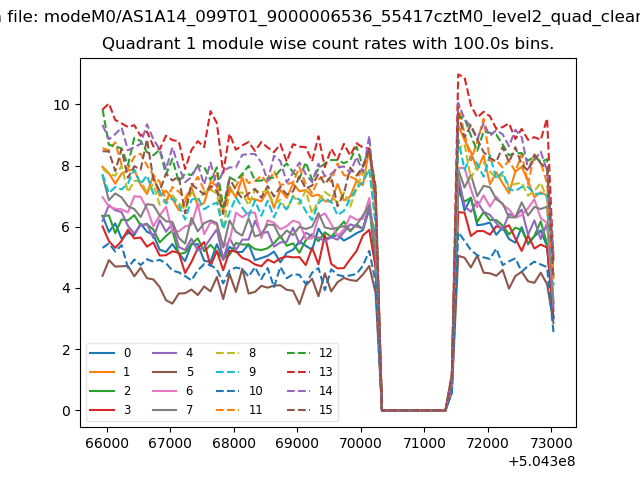
| Module-wise count rates for Quadrant A Data is divided into 100 sec bins |
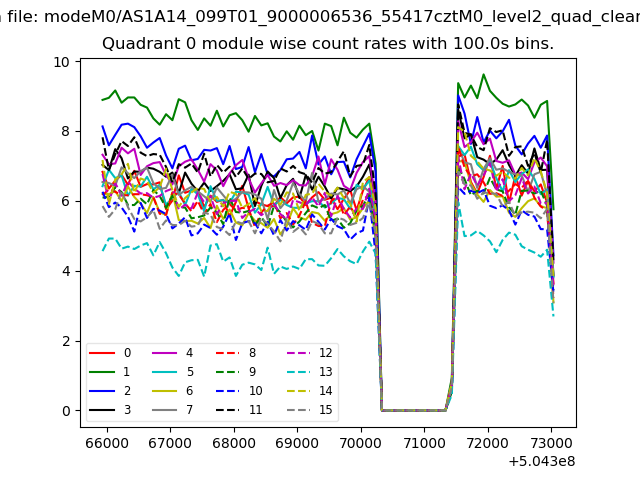 |
 |
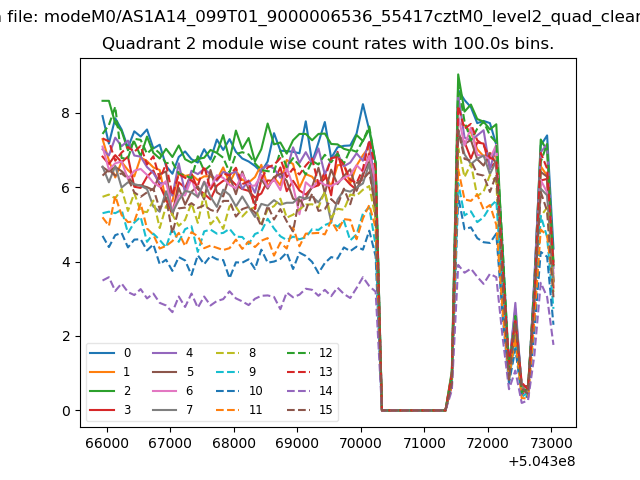
| Module-wise count rates for Quadrant B Data is divided into 100 sec bins |
 |
 |
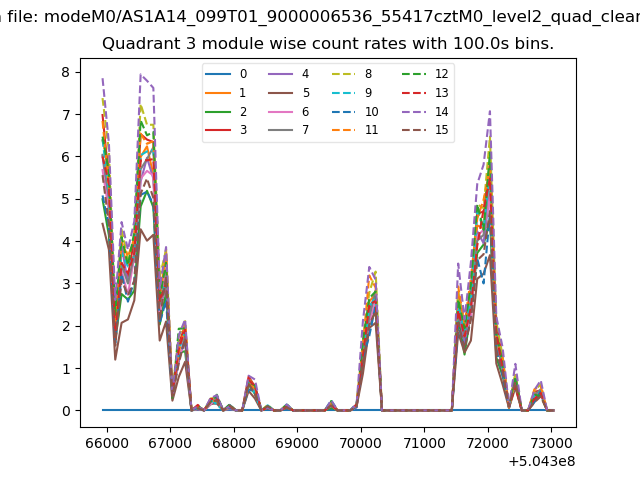
| Module-wise count rates for Quadrant C Data is divided into 100 sec bins |
 |
 |
| Module-wise count rates for Quadrant D Data is divided into 100 sec bins |
 |
 |
| Parameter | Plot |
|---|---|
| CZT HV Monitor | 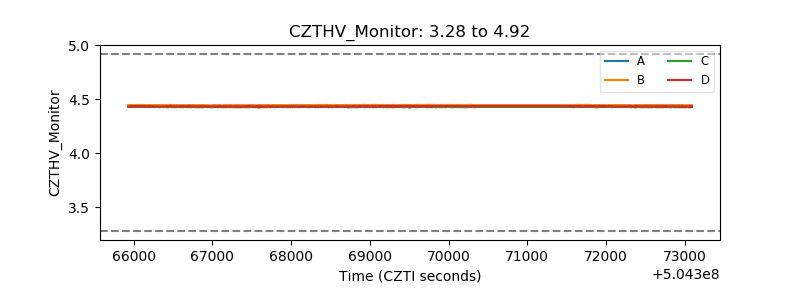 |
| D_VDD | 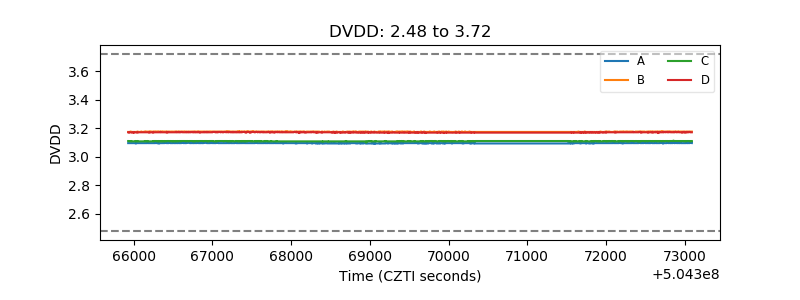 |
| Temperature 1 | 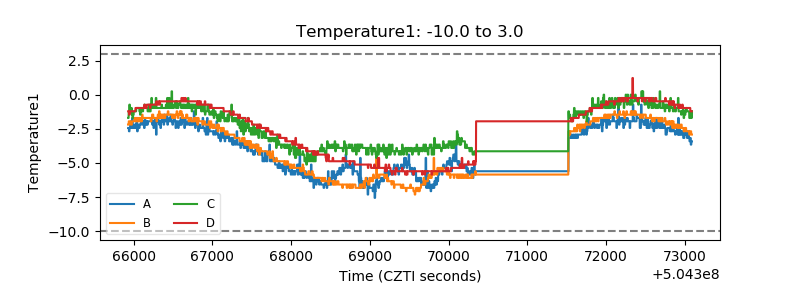 |
| Veto HV Monitor |  |
| Veto LLD | 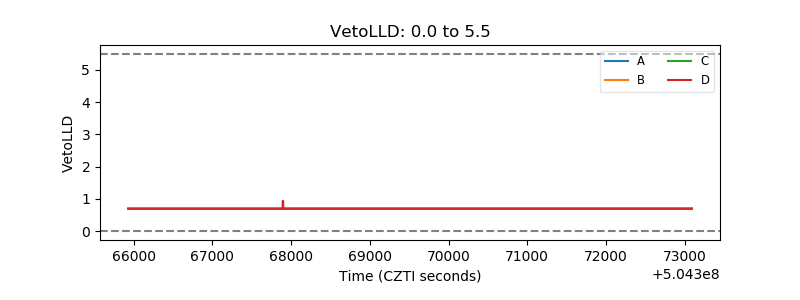 |
| Alpha Counter | 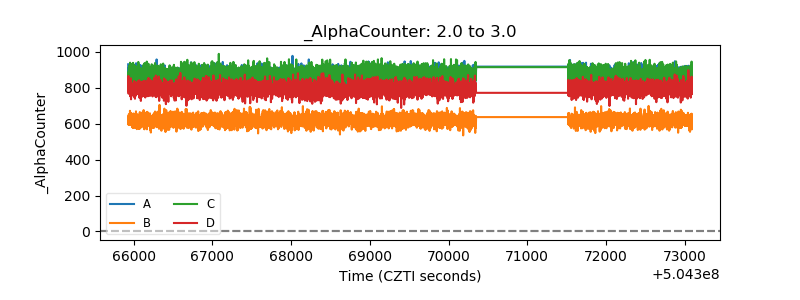 |
| _CPM_Rate | 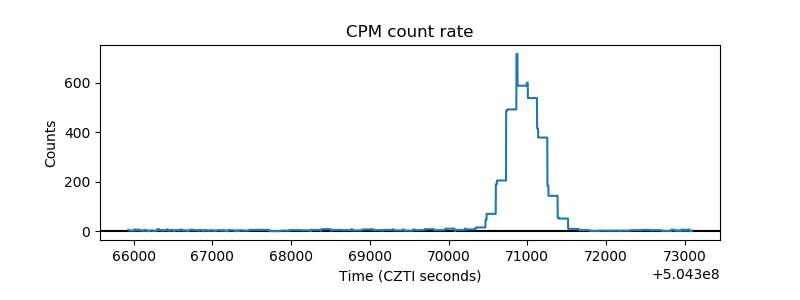 |
| CZT Counter | 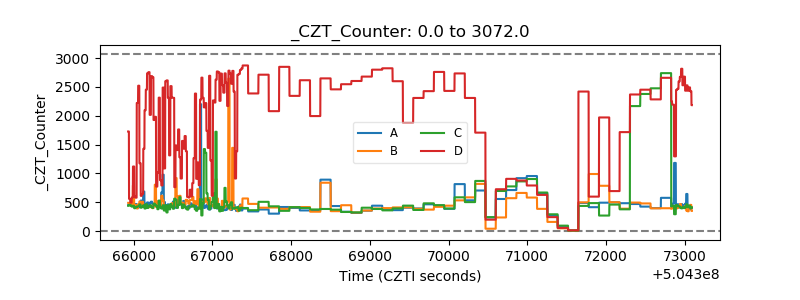 |
| +2.5 Volts monitor | 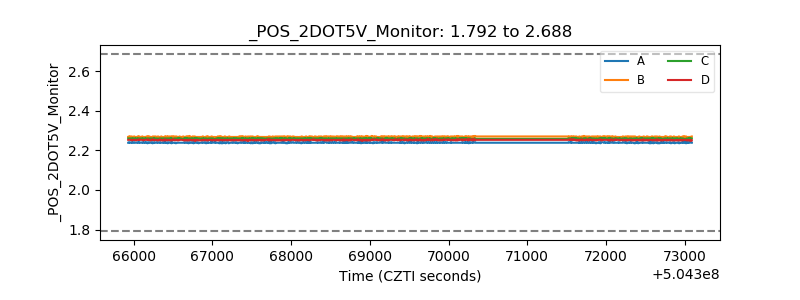 |
| +5 Volts monitor |  |
| _ROLL_ROT | 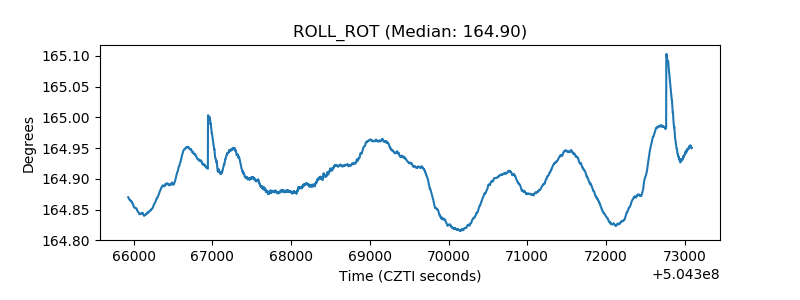 |
| _Roll_DEC | 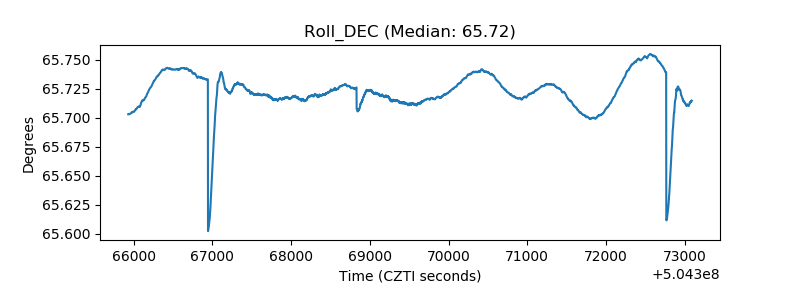 |
| _Roll_RA | 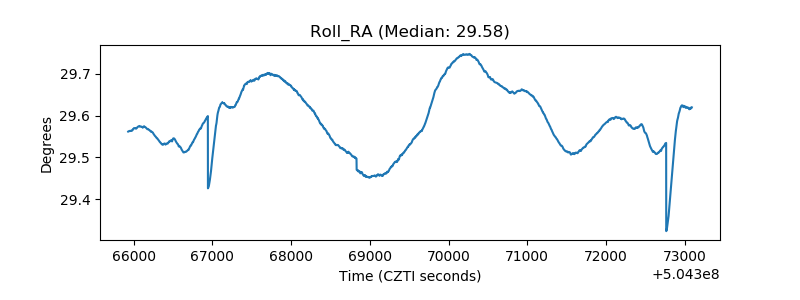 |
| Veto Counter | 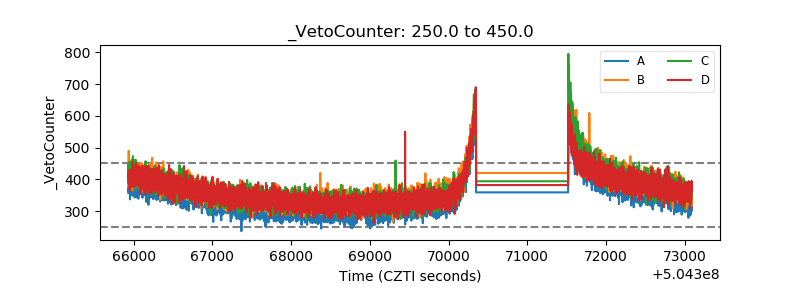 |