| Param | Original file | Final file |
|---|---|---|
| Filename | modeM0/AS1A14_099T01_9000006536_55418cztM0_level2.fits | modeM0/AS1A14_099T01_9000006536_55418cztM0_level2_quad_clean.evt |
| Size (bytes) | 633,971,520 | 82,540,800 |
| Size | 604.6 MB | 78.7 MB |
| Events in quadrant A | 2,764,275 | 631,240 |
| Events in quadrant B | 3,973,538 | 601,654 |
| Events in quadrant C | 4,702,052 | 541,492 |
| Events in quadrant D | 11,537,063 | 284,466 |
| Mode M9 | |||
|---|---|---|---|
| Quadrant | BADHDUFLAG | Total packets | Discarded packets |
| A | 0 | 11 | 0 |
| B | 0 | 11 | 0 |
| C | 0 | 11 | 0 |
| D | 0 | 11 | 0 |
| Mode SS | |||
|---|---|---|---|
| Quadrant | BADHDUFLAG | Total packets | Discarded packets |
| A | 0 | 128 | 0 |
| B | 0 | 128 | 0 |
| C | 0 | 128 | 0 |
| D | 0 | 128 | 0 |
| Mode M0 | |||
|---|---|---|---|
| Quadrant | BADHDUFLAG | Total packets | Discarded packets |
| A | 0 | 13011 | 1 |
| B | 0 | 16660 | 1 |
| C | 0 | 18602 | 1 |
| D | 0 | 38616 | 1 |
| Quadrant | Total seconds | Saturated seconds | Saturation percentage |
|---|---|---|---|
| A | 6310 | 59 | 0.935024% |
| B | 6311 | 635 | 10.061797% |
| C | 6311 | 645 | 10.220250% |
| D | 6311 | 3432 | 54.381239% |
Noise dominated data is calculated using 1-second bins in cleaned event files. If a bin has >2000 counts, and if more than 50% of those come from <1% of pixels, then it is considered to be noise-dominated and hence unusable.
| Quadrant | # 1 sec bins | Bins with >0 counts | Bins with >2000 counts | High rate bins dominated by noise | Noise dominated (total time) | Noise dominated (detector-on time) | Marked lightcurve |
|---|---|---|---|---|---|---|---|
| A | 7430 | 6311 | 13 | 13 | 0.17% | 0.21% | 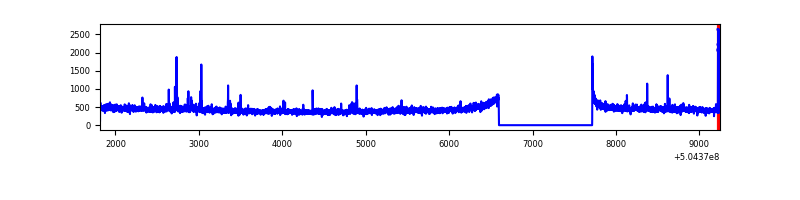 |
| B | 7431 | 6312 | 531 | 531 | 7.15% | 8.41% | 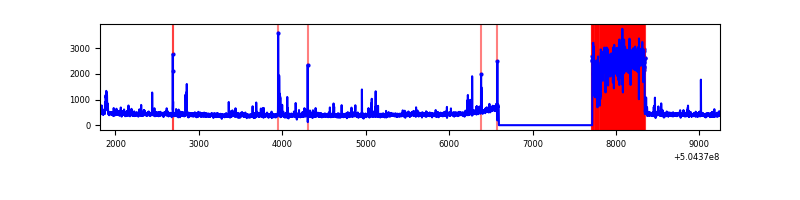 |
| C | 7431 | 6312 | 507 | 507 | 6.82% | 8.03% | 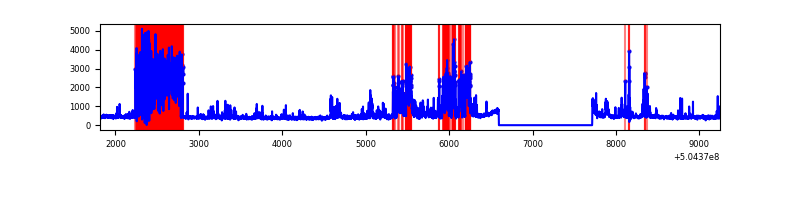 |
| D | 7431 | 6311 | 2927 | 2927 | 39.39% | 46.38% | 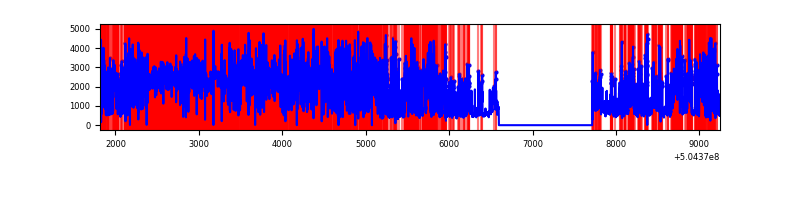 |
Top three noisy pixels from each quadrant. If the there are fewer than three noisy pixels in the level2.evt file, extra rows are filled as -1
| Pixel properties | Quadrant properties | ||||||
|---|---|---|---|---|---|---|---|
| Quadrant | DetID | PixID | Counts | Sigma | Mean | Median | Sigma |
| A | 0 | 8 | 72603 | 426.21 | 675 | 656 | 168.8 |
| A | 13 | 254 | 20267 | 116.17 | 675 | 656 | 168.8 |
| A | 4 | 3 | 15944 | 90.56 | 675 | 656 | 168.8 |
| B | 5 | 172 | 1362245 | 10285.53 | 628 | 606 | 132.4 |
| B | 5 | 185 | 50928 | 380.12 | 628 | 606 | 132.4 |
| B | 10 | 247 | 21564 | 158.31 | 628 | 606 | 132.4 |
| C | 12 | 252 | 2011400 | 11641.72 | 630 | 623 | 172.7 |
| C | 13 | 3 | 124922 | 719.65 | 630 | 623 | 172.7 |
| C | 10 | 64 | 34657 | 197.05 | 630 | 623 | 172.7 |
| D | 11 | 129 | 9205402 | 68461.68 | 476 | 454 | 134.5 |
| D | 2 | 249 | 150207 | 1113.78 | 476 | 454 | 134.5 |
| D | 11 | 176 | 96278 | 712.69 | 476 | 454 | 134.5 |
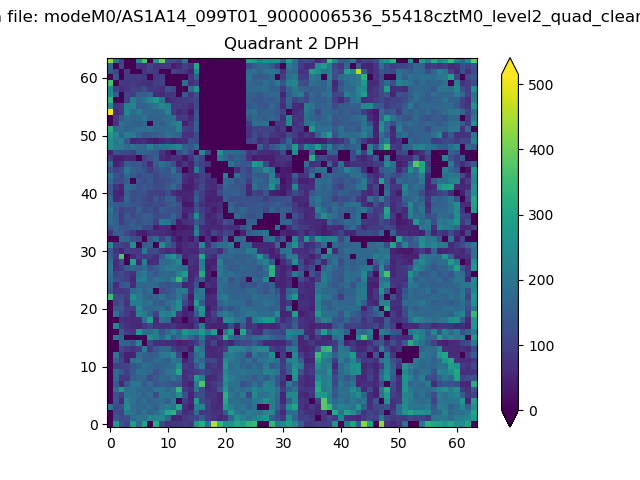
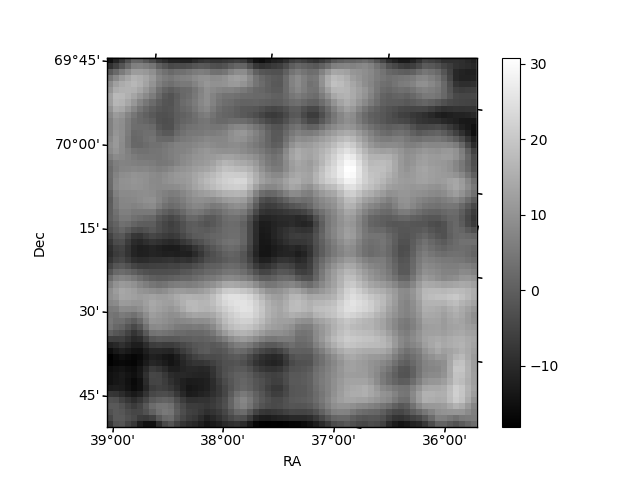
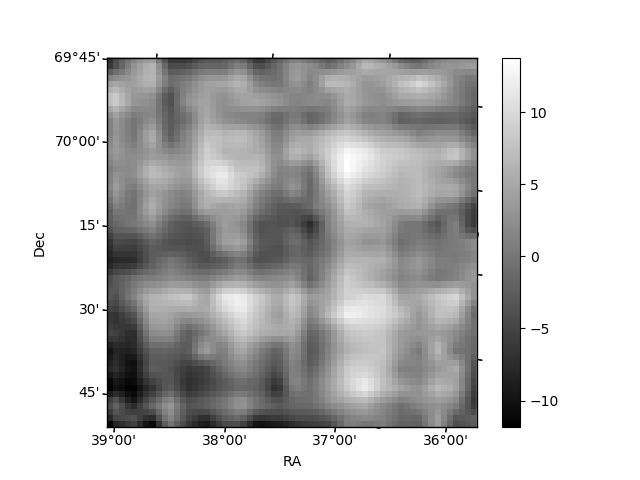
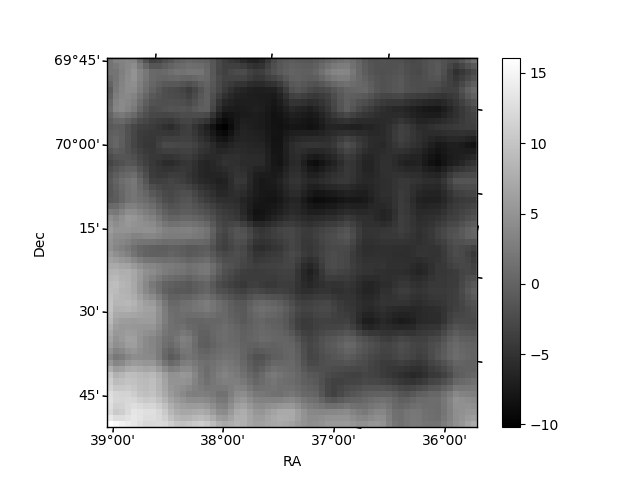
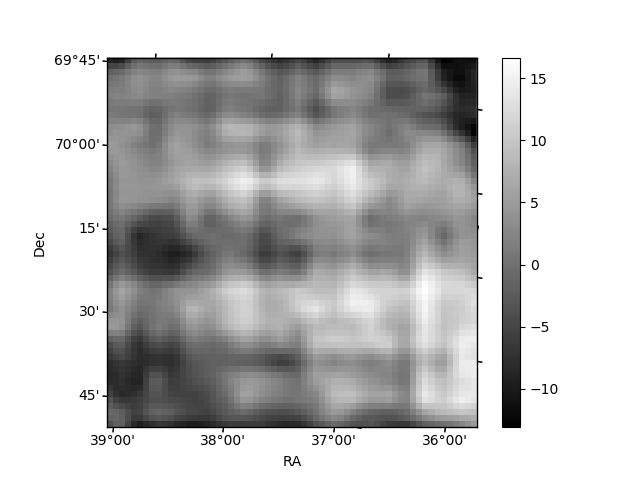
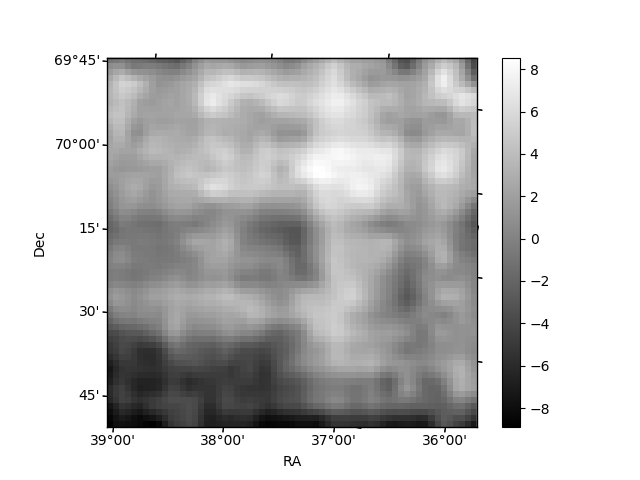
Histogram calculated using DETX and DETY for each event in the final _common_clean file
| Quadrant A | 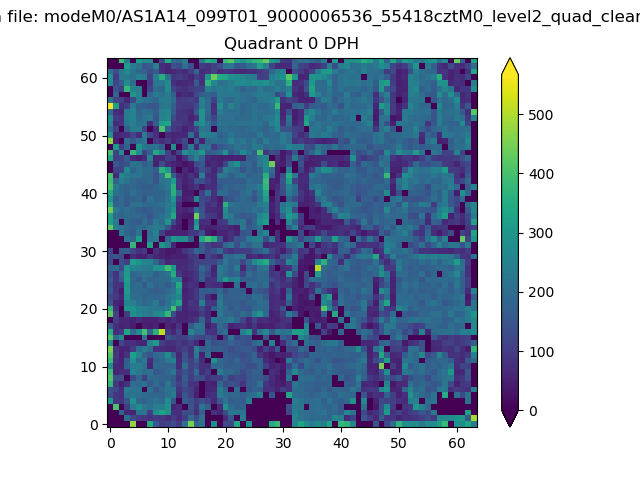 |
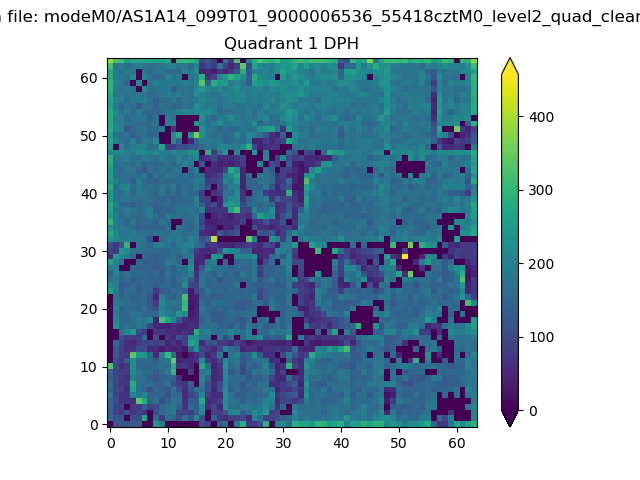 |
Quadrant B |
|---|---|---|---|
| Quadrant D | 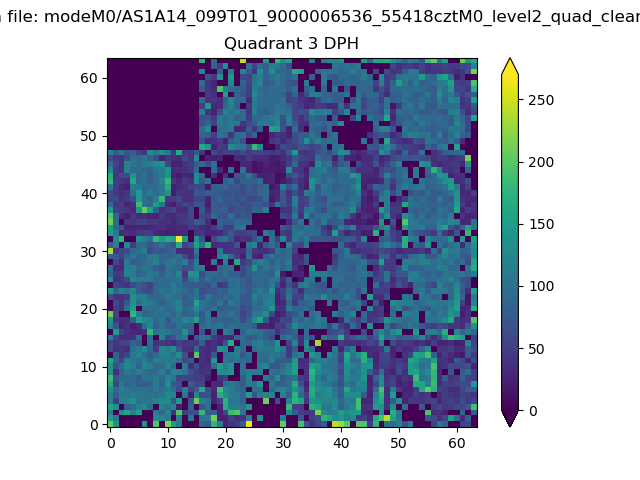 |
 |
Quadrant C |
| Plot type | Count rate plots | Images |
|---|---|---|
| Comparison with Poisson distribution Blue bars denote a histogram of data divided into 1 sec bins. Red curve is a Poisson curve with rate = median count rate of data. |
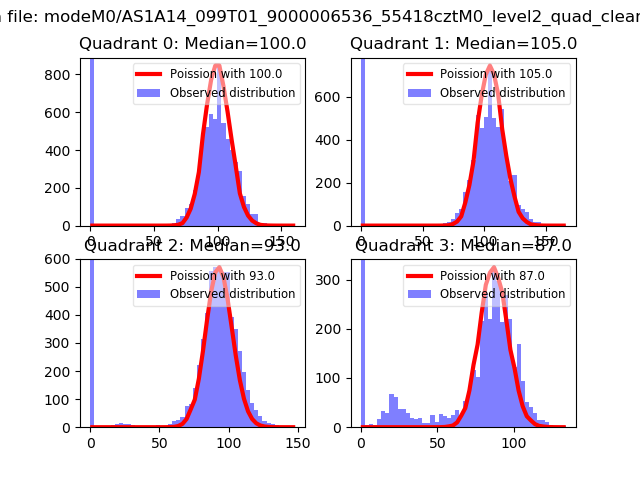 |
 |
| Quadrant-wise count rates Data is divided into 100 sec bins |
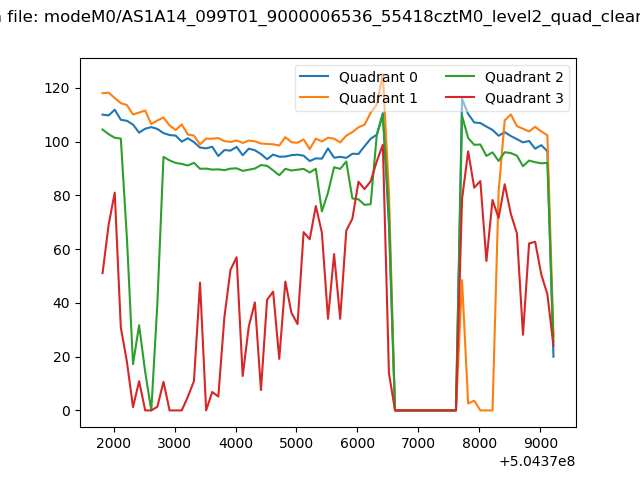 |
|
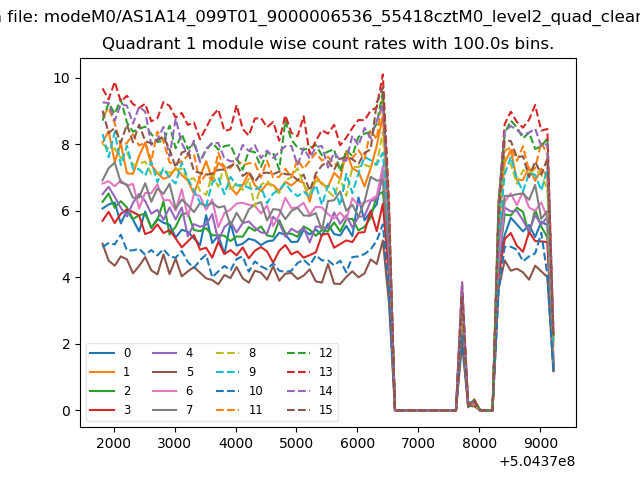
| Module-wise count rates for Quadrant A Data is divided into 100 sec bins |
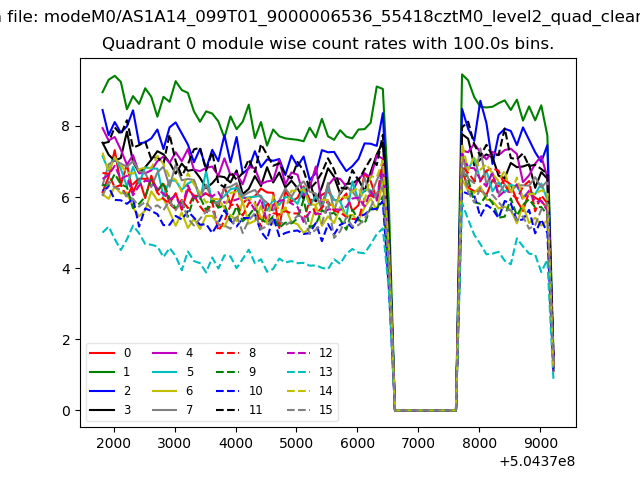 |
 |
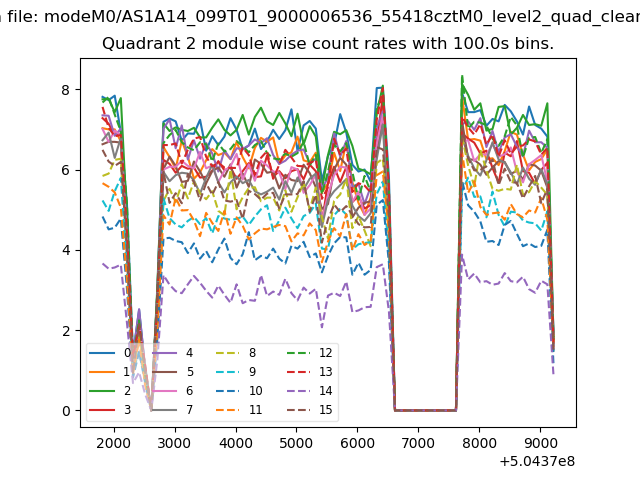
| Module-wise count rates for Quadrant B Data is divided into 100 sec bins |
 |
 |
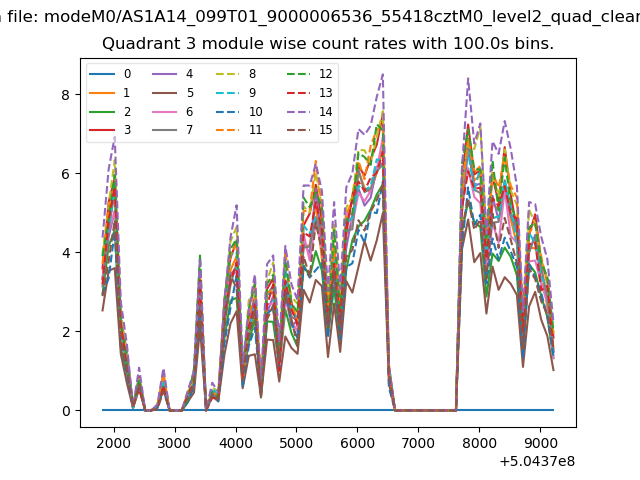
| Module-wise count rates for Quadrant C Data is divided into 100 sec bins |
 |
 |
| Module-wise count rates for Quadrant D Data is divided into 100 sec bins |
 |
 |
| Parameter | Plot |
|---|---|
| CZT HV Monitor | 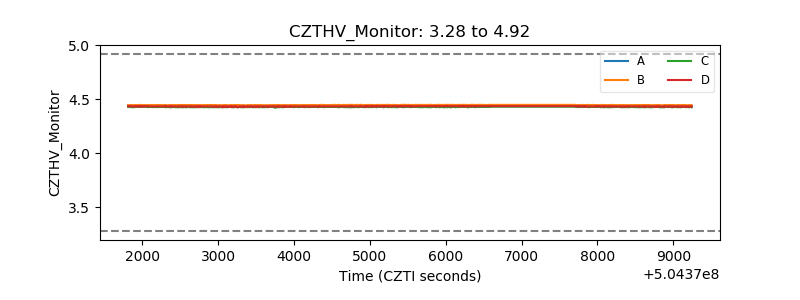 |
| D_VDD | 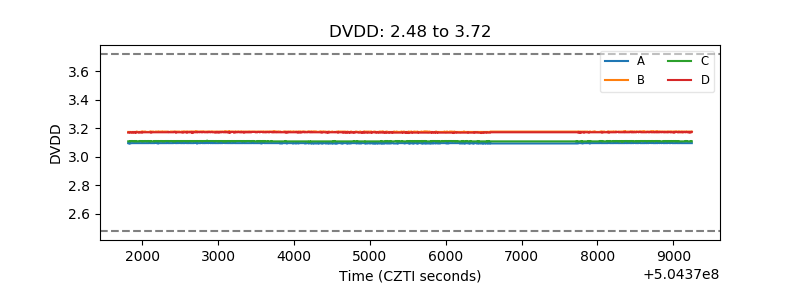 |
| Temperature 1 | 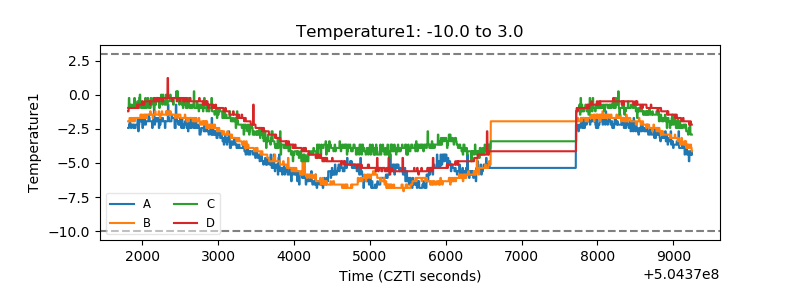 |
| Veto HV Monitor | 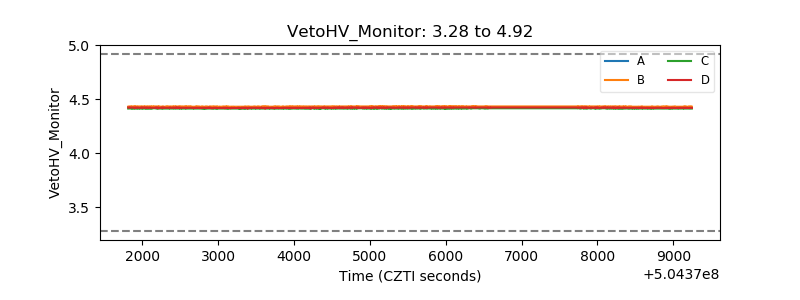 |
| Veto LLD | 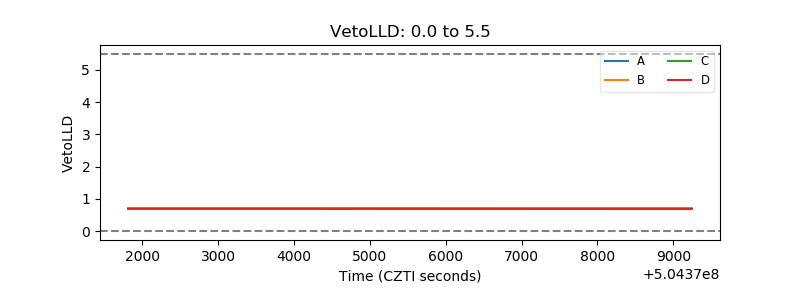 |
| Alpha Counter | 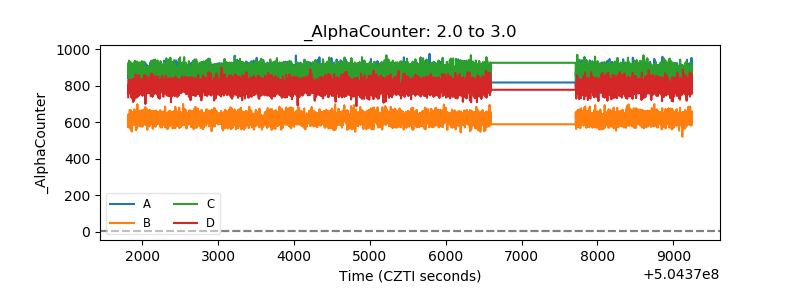 |
| _CPM_Rate | 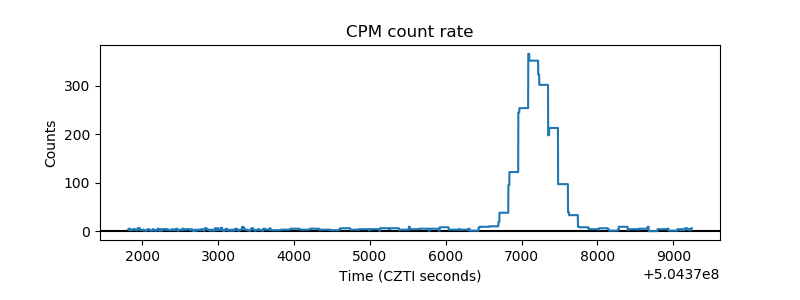 |
| CZT Counter | 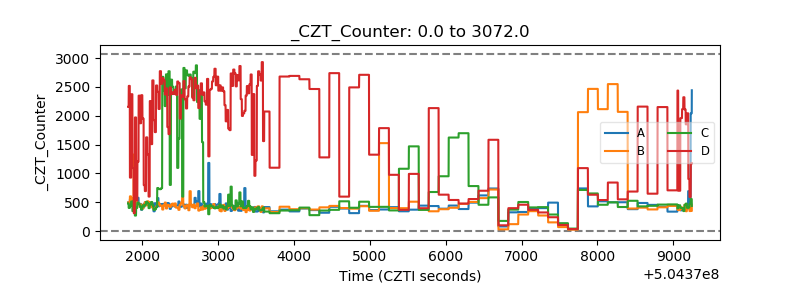 |
| +2.5 Volts monitor | 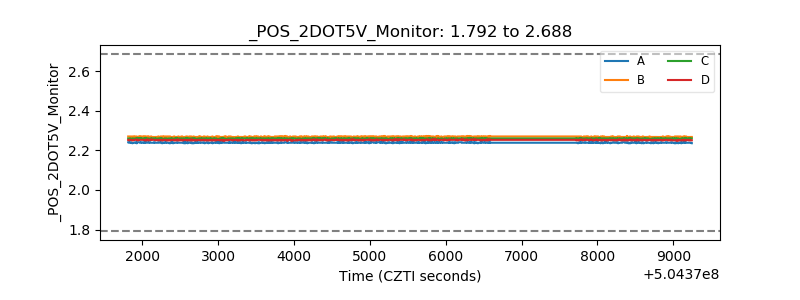 |
| +5 Volts monitor | 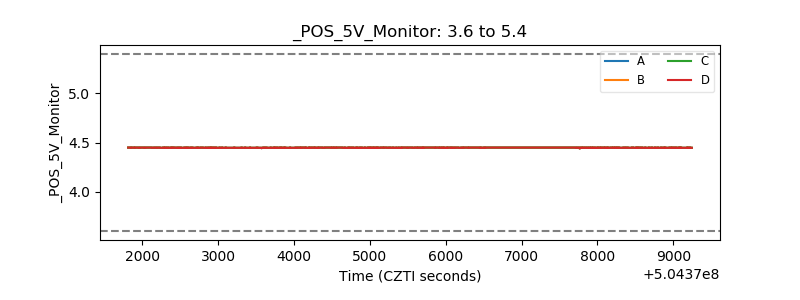 |
| _ROLL_ROT | 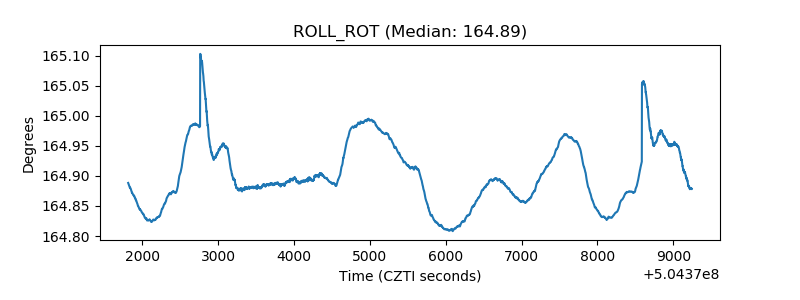 |
| _Roll_DEC | 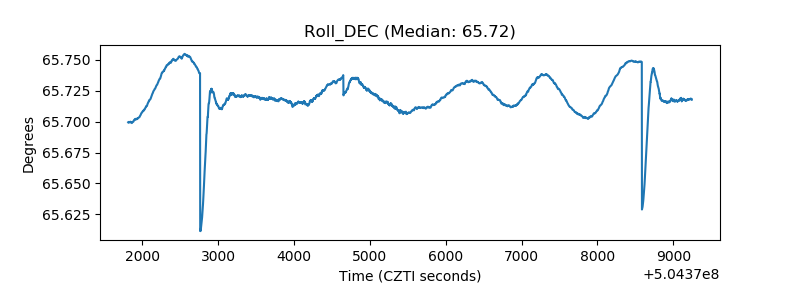 |
| _Roll_RA | 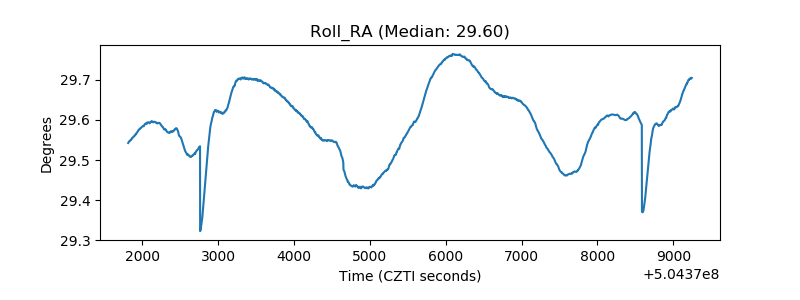 |
| Veto Counter | 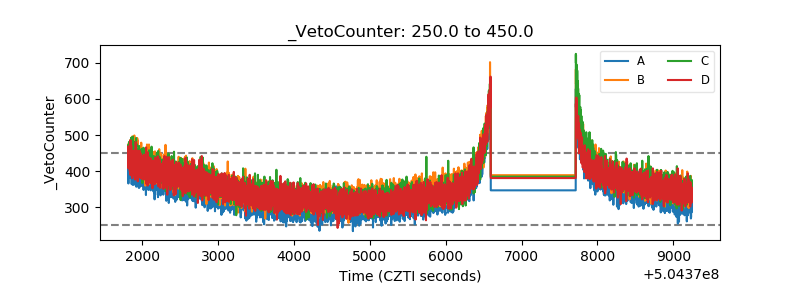 |