| Param | Original file | Final file |
|---|---|---|
| Filename | modeM0/AS1A14_099T01_9000006536_55419cztM0_level2.fits | modeM0/AS1A14_099T01_9000006536_55419cztM0_level2_quad_clean.evt |
| Size (bytes) | 554,595,840 | 93,415,680 |
| Size | 528.9 MB | 89.1 MB |
| Events in quadrant A | 3,229,266 | 654,311 |
| Events in quadrant B | 4,240,741 | 632,983 |
| Events in quadrant C | 3,286,439 | 619,840 |
| Events in quadrant D | 9,247,684 | 450,122 |
| Mode M9 | |||
|---|---|---|---|
| Quadrant | BADHDUFLAG | Total packets | Discarded packets |
| A | 0 | 9 | 0 |
| B | 0 | 9 | 0 |
| C | 0 | 10 | 0 |
| D | 0 | 10 | 0 |
| Mode SS | |||
|---|---|---|---|
| Quadrant | BADHDUFLAG | Total packets | Discarded packets |
| A | 0 | 138 | 0 |
| B | 0 | 138 | 0 |
| C | 0 | 138 | 0 |
| D | 0 | 138 | 0 |
| Mode M0 | |||
|---|---|---|---|
| Quadrant | BADHDUFLAG | Total packets | Discarded packets |
| A | 0 | 14729 | 2 |
| B | 0 | 17714 | 2 |
| C | 0 | 14873 | 2 |
| D | 0 | 32164 | 2 |
| Quadrant | Total seconds | Saturated seconds | Saturation percentage |
|---|---|---|---|
| A | 6759 | 82 | 1.213197% |
| B | 6759 | 635 | 9.394881% |
| C | 6759 | 80 | 1.183607% |
| D | 6759 | 1869 | 27.652020% |
Noise dominated data is calculated using 1-second bins in cleaned event files. If a bin has >2000 counts, and if more than 50% of those come from <1% of pixels, then it is considered to be noise-dominated and hence unusable.
| Quadrant | # 1 sec bins | Bins with >0 counts | Bins with >2000 counts | High rate bins dominated by noise | Noise dominated (total time) | Noise dominated (detector-on time) | Marked lightcurve |
|---|---|---|---|---|---|---|---|
| A | 7694 | 6760 | 57 | 57 | 0.74% | 0.84% | 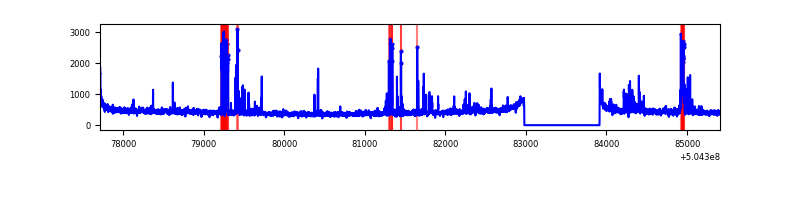 |
| B | 7694 | 6760 | 528 | 528 | 6.86% | 7.81% | 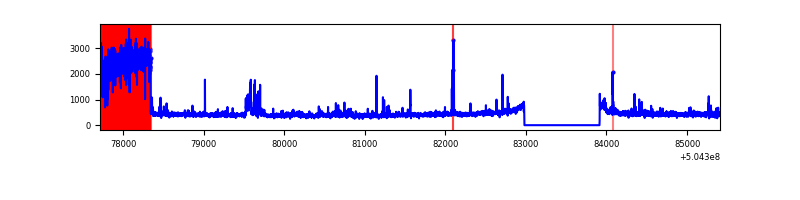 |
| C | 7694 | 6760 | 25 | 25 | 0.32% | 0.37% | 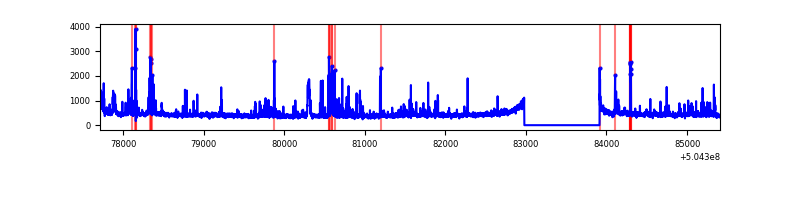 |
| D | 7694 | 6760 | 1718 | 1718 | 22.33% | 25.41% | 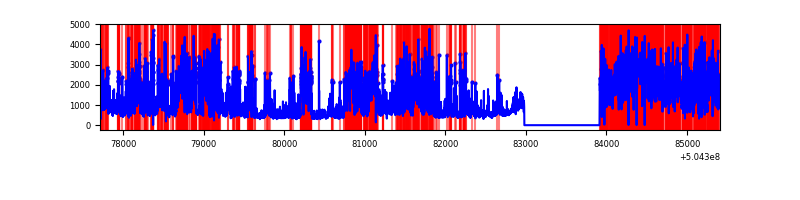 |
Top three noisy pixels from each quadrant. If the there are fewer than three noisy pixels in the level2.evt file, extra rows are filled as -1
| Pixel properties | Quadrant properties | ||||||
|---|---|---|---|---|---|---|---|
| Quadrant | DetID | PixID | Counts | Sigma | Mean | Median | Sigma |
| A | 0 | 8 | 252758 | 1423.2 | 715 | 697 | 177.1 |
| A | 7 | 7 | 79568 | 445.33 | 715 | 697 | 177.1 |
| A | 4 | 3 | 32266 | 178.25 | 715 | 697 | 177.1 |
| B | 5 | 172 | 1419476 | 9914.58 | 674 | 650 | 143.1 |
| B | 10 | 247 | 38031 | 261.21 | 674 | 650 | 143.1 |
| B | 9 | 254 | 28640 | 195.59 | 674 | 650 | 143.1 |
| C | 13 | 3 | 193169 | 995.71 | 705 | 697 | 193.3 |
| C | 12 | 252 | 112906 | 580.49 | 705 | 697 | 193.3 |
| C | 10 | 64 | 107365 | 551.82 | 705 | 697 | 193.3 |
| D | 11 | 129 | 4043651 | 23202.58 | 617 | 590 | 174.3 |
| D | 8 | 48 | 2088453 | 11981.96 | 617 | 590 | 174.3 |
| D | 8 | 160 | 159782 | 913.58 | 617 | 590 | 174.3 |
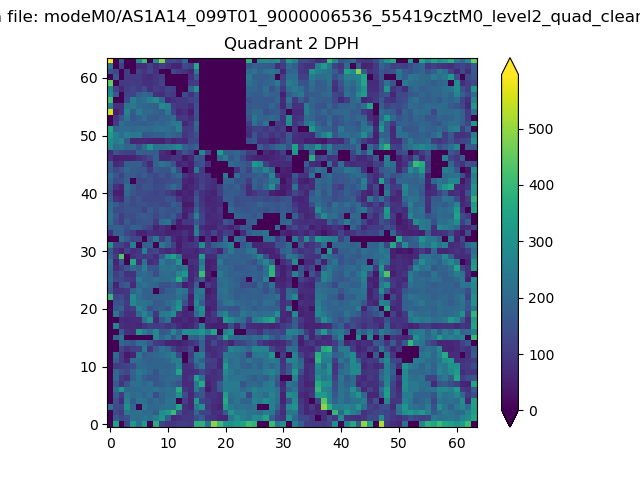
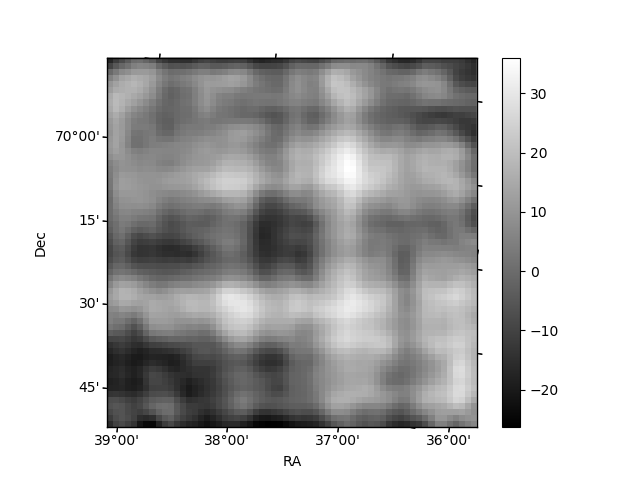
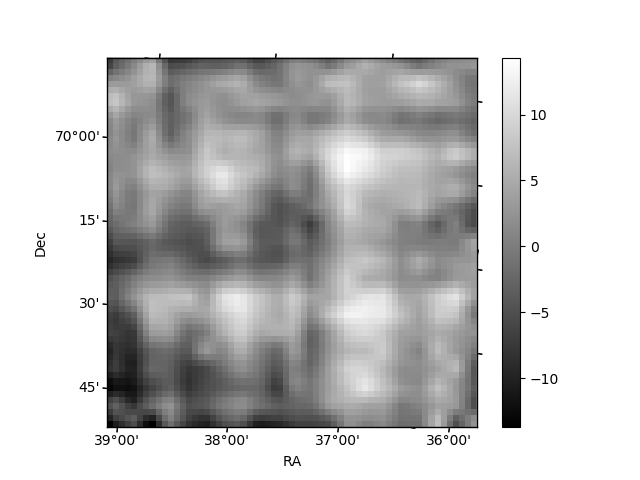
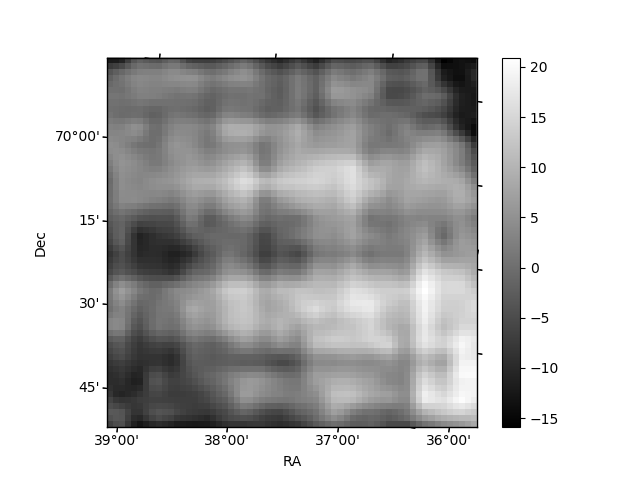
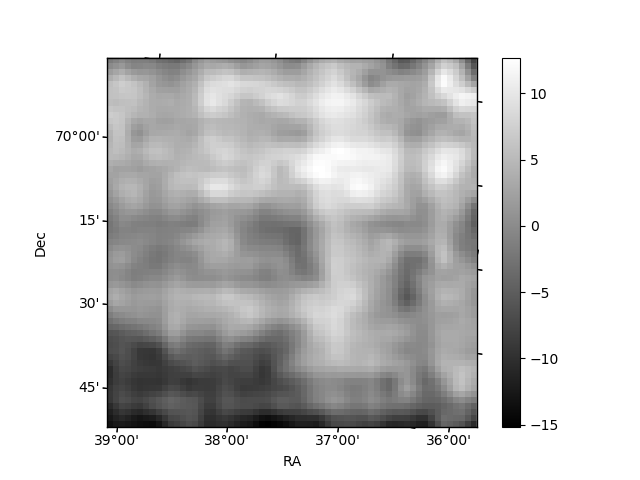
Histogram calculated using DETX and DETY for each event in the final _common_clean file
| Quadrant A | 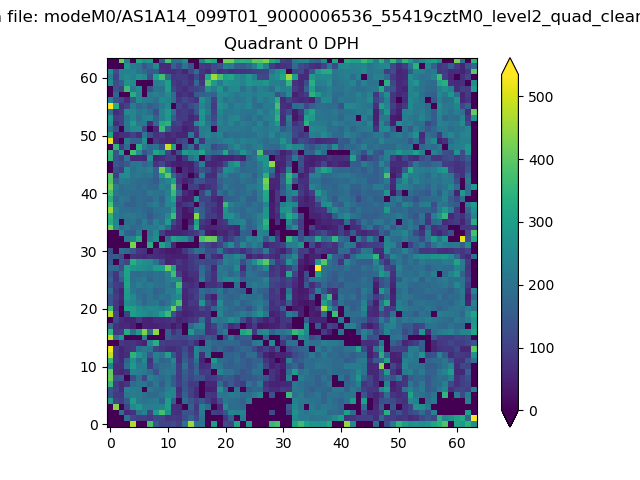 |
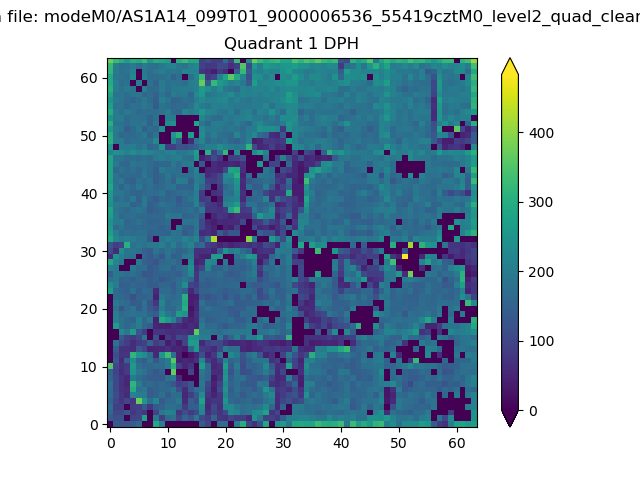 |
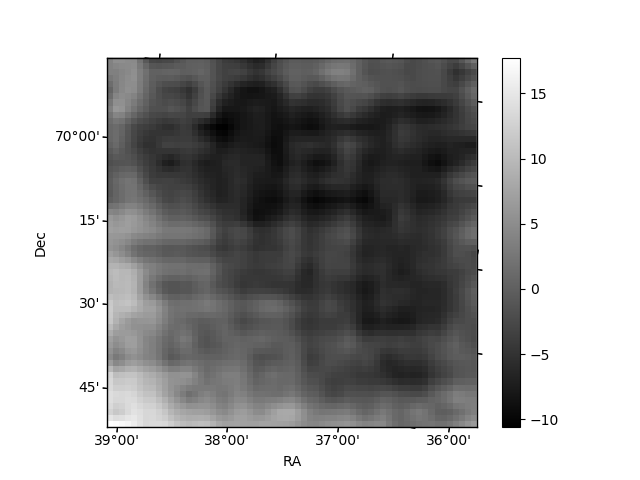
Quadrant B |
|---|---|---|---|
| Quadrant D | 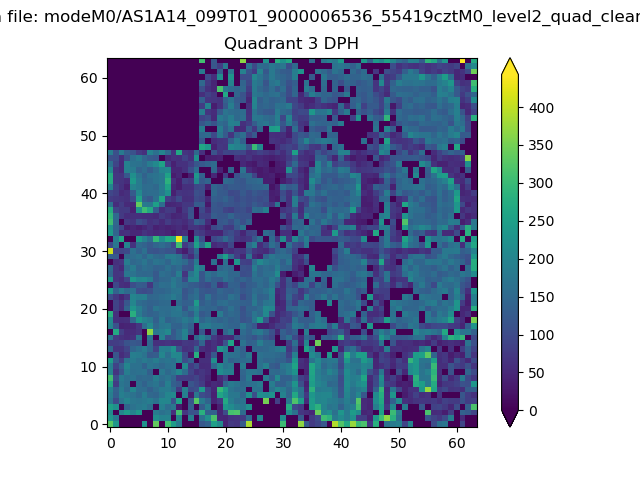 |
 |
Quadrant C |
| Plot type | Count rate plots | Images |
|---|---|---|
| Comparison with Poisson distribution Blue bars denote a histogram of data divided into 1 sec bins. Red curve is a Poisson curve with rate = median count rate of data. |
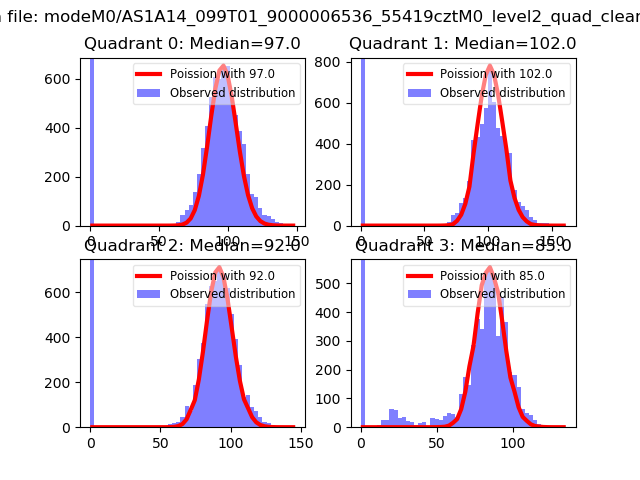 |
 |
| Quadrant-wise count rates Data is divided into 100 sec bins |
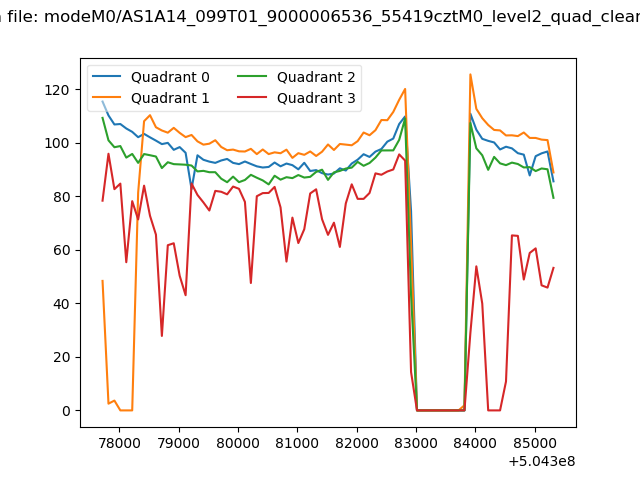 |
|
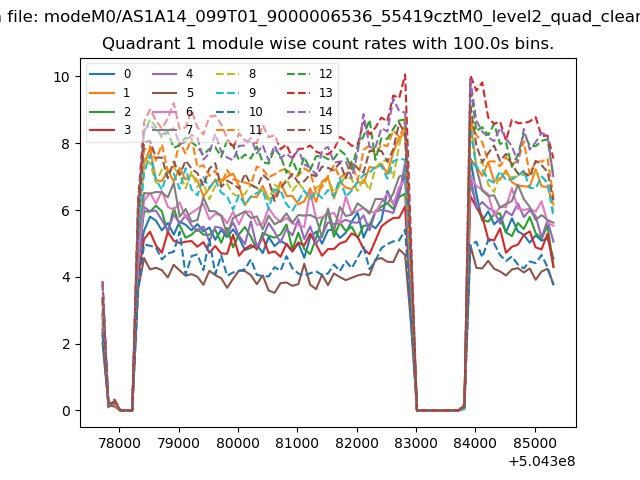
| Module-wise count rates for Quadrant A Data is divided into 100 sec bins |
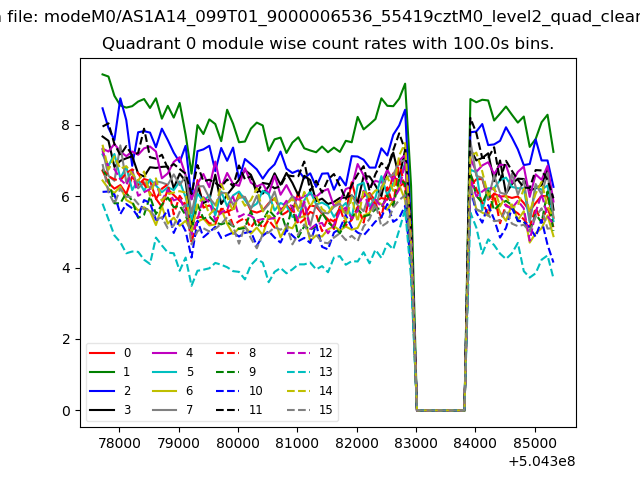 |
 |
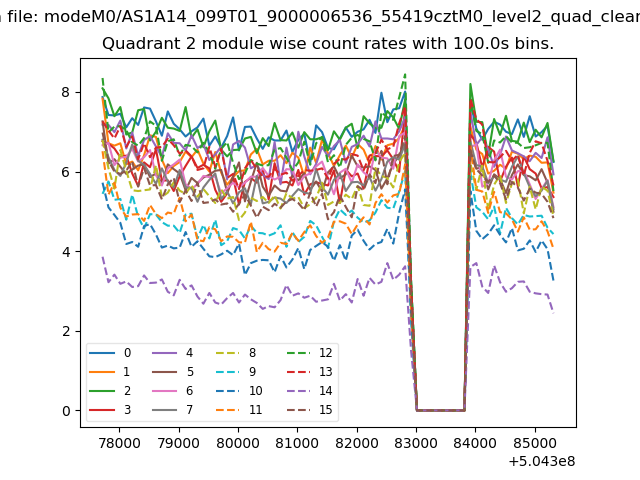
| Module-wise count rates for Quadrant B Data is divided into 100 sec bins |
 |
 |
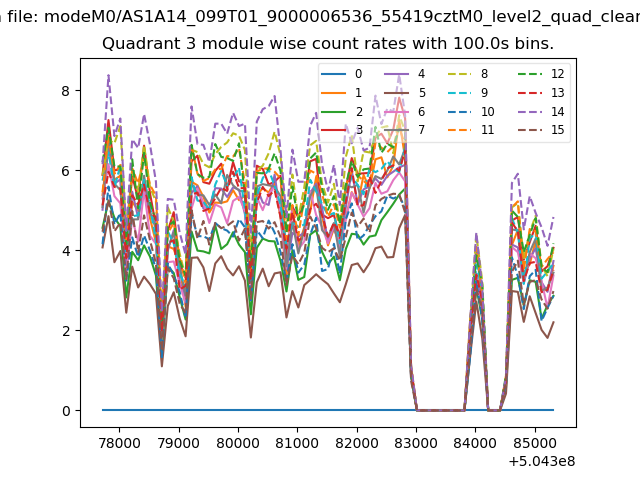
| Module-wise count rates for Quadrant C Data is divided into 100 sec bins |
 |
 |
| Module-wise count rates for Quadrant D Data is divided into 100 sec bins |
 |
 |
| Parameter | Plot |
|---|---|
| CZT HV Monitor | 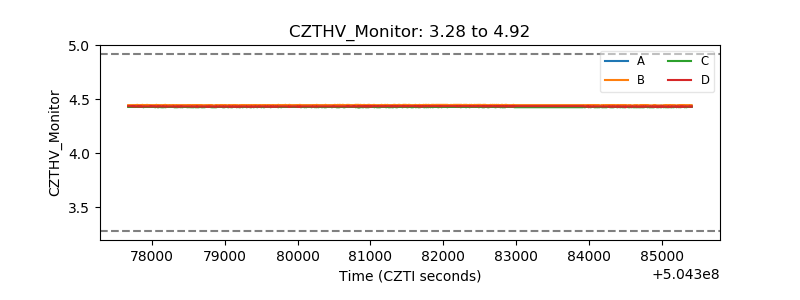 |
| D_VDD | 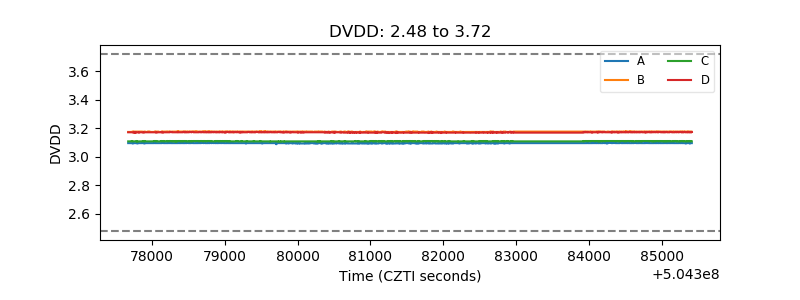 |
| Temperature 1 | 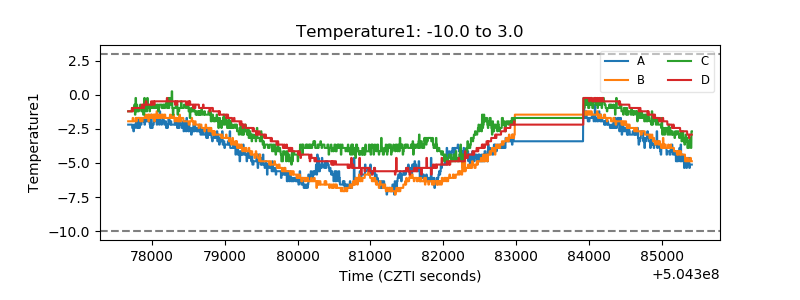 |
| Veto HV Monitor | 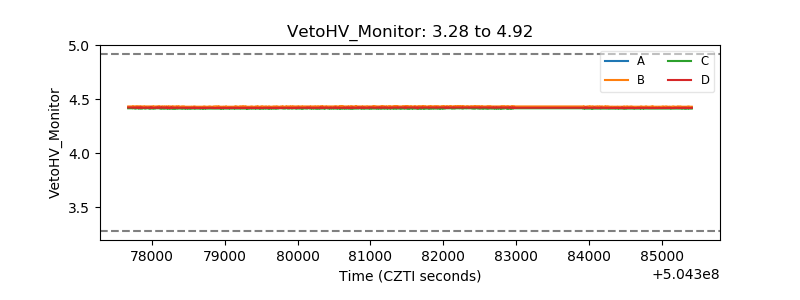 |
| Veto LLD | 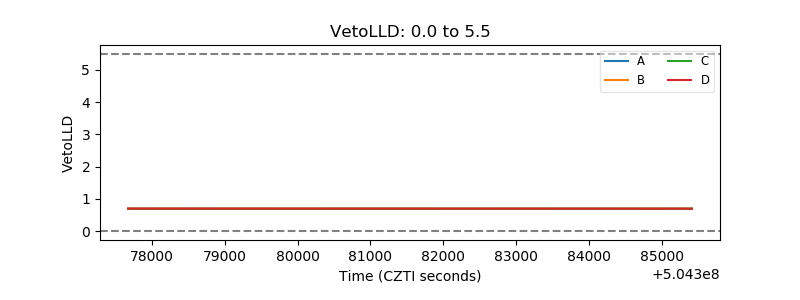 |
| Alpha Counter | 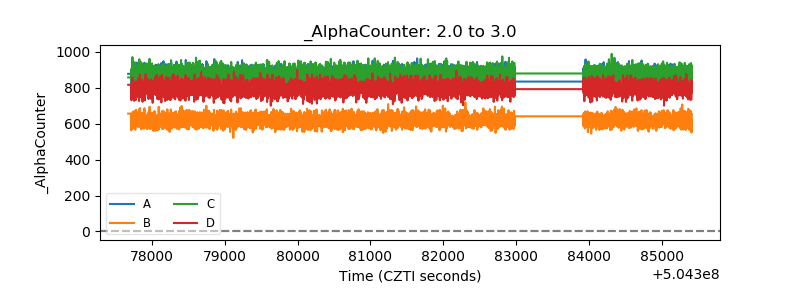 |
| _CPM_Rate | 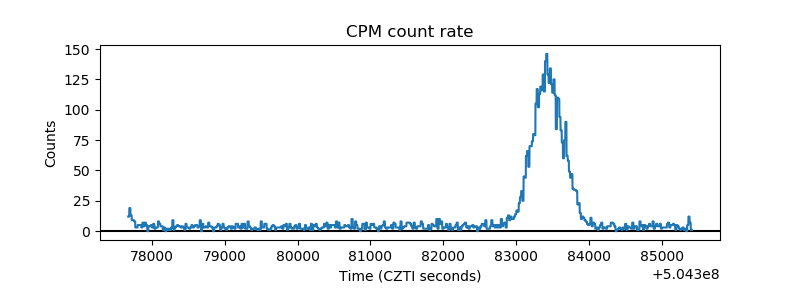 |
| CZT Counter | 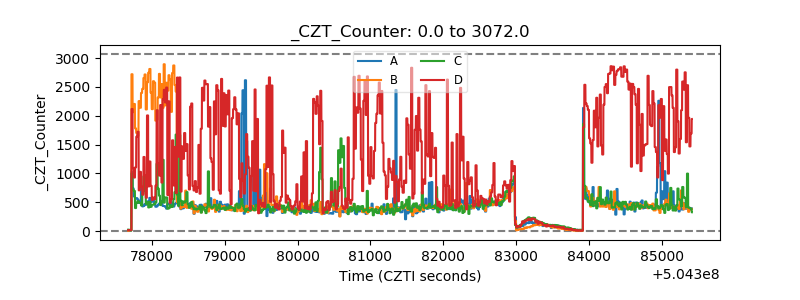 |
| +2.5 Volts monitor | 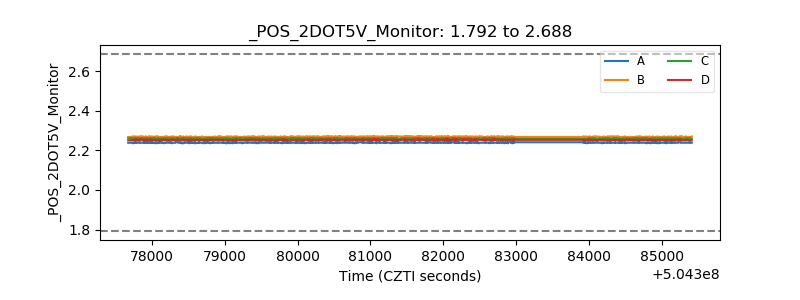 |
| +5 Volts monitor | 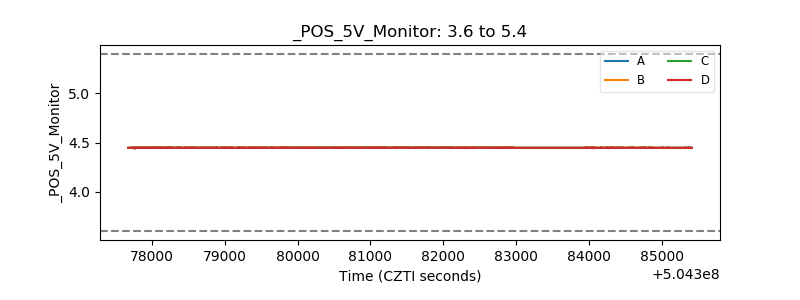 |
| _ROLL_ROT | 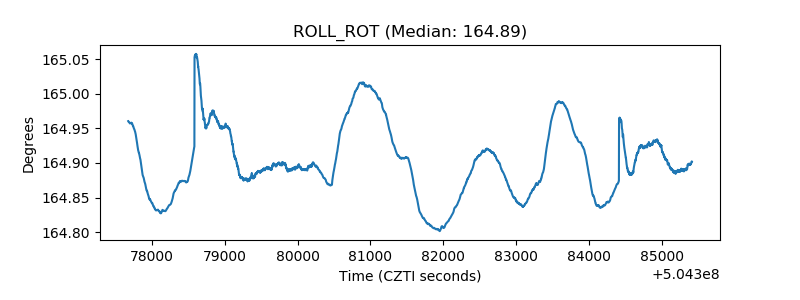 |
| _Roll_DEC | 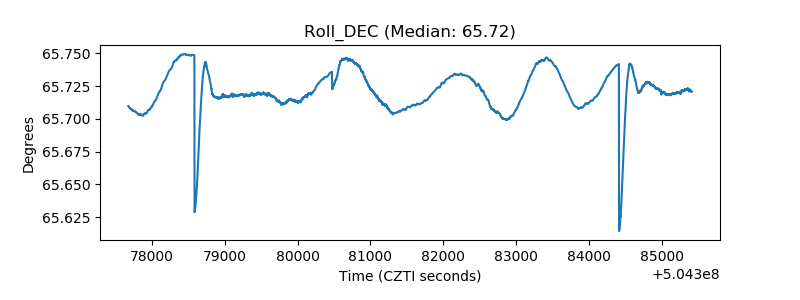 |
| _Roll_RA | 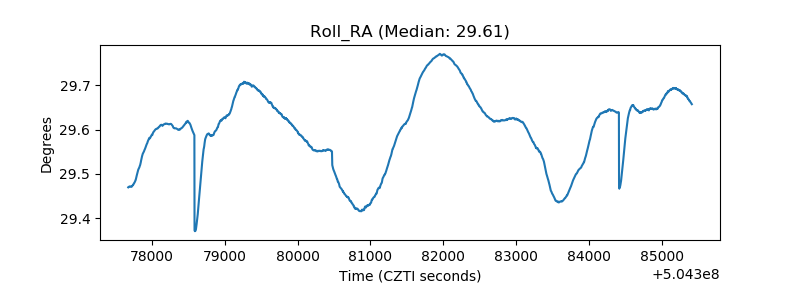 |
| Veto Counter | 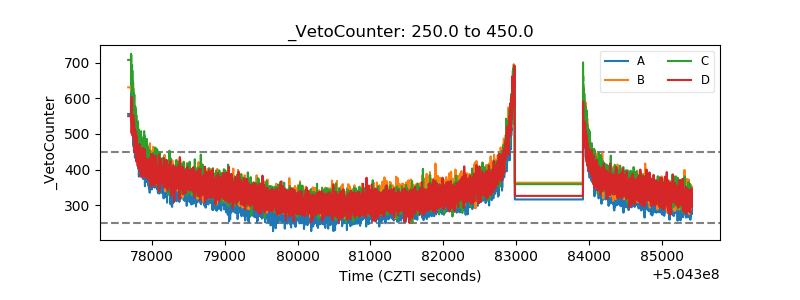 |