| Param | Original file | Final file |
|---|---|---|
| Filename | modeM0/AS1A14_099T01_9000006536_55420cztM0_level2.fits | modeM0/AS1A14_099T01_9000006536_55420cztM0_level2_quad_clean.evt |
| Size (bytes) | 682,758,720 | 95,135,040 |
| Size | 651.1 MB | 90.7 MB |
| Events in quadrant A | 3,489,211 | 675,088 |
| Events in quadrant B | 4,080,602 | 706,112 |
| Events in quadrant C | 4,242,042 | 628,255 |
| Events in quadrant D | 12,909,111 | 374,999 |
| Mode M9 | |||
|---|---|---|---|
| Quadrant | BADHDUFLAG | Total packets | Discarded packets |
| A | 0 | 7 | 0 |
| B | 0 | 7 | 0 |
| C | 0 | 8 | 0 |
| D | 0 | 8 | 0 |
| Mode SS | |||
|---|---|---|---|
| Quadrant | BADHDUFLAG | Total packets | Discarded packets |
| A | 0 | 144 | 0 |
| B | 0 | 144 | 0 |
| C | 0 | 144 | 0 |
| D | 0 | 144 | 0 |
| Mode M0 | |||
|---|---|---|---|
| Quadrant | BADHDUFLAG | Total packets | Discarded packets |
| A | 0 | 15779 | 2 |
| B | 0 | 17543 | 2 |
| C | 0 | 17900 | 2 |
| D | 0 | 43257 | 5 |
| Quadrant | Total seconds | Saturated seconds | Saturation percentage |
|---|---|---|---|
| A | 7123 | 100 | 1.403903% |
| B | 7123 | 254 | 3.565913% |
| C | 7123 | 295 | 4.141513% |
| D | 7122 | 3130 | 43.948329% |
Noise dominated data is calculated using 1-second bins in cleaned event files. If a bin has >2000 counts, and if more than 50% of those come from <1% of pixels, then it is considered to be noise-dominated and hence unusable.
| Quadrant | # 1 sec bins | Bins with >0 counts | Bins with >2000 counts | High rate bins dominated by noise | Noise dominated (total time) | Noise dominated (detector-on time) | Marked lightcurve |
|---|---|---|---|---|---|---|---|
| A | 7603 | 7124 | 43 | 43 | 0.57% | 0.60% | 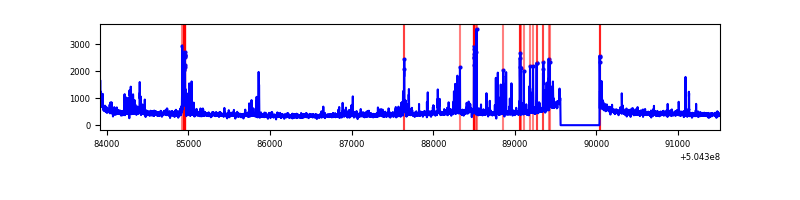 |
| B | 7603 | 7124 | 75 | 75 | 0.99% | 1.05% | 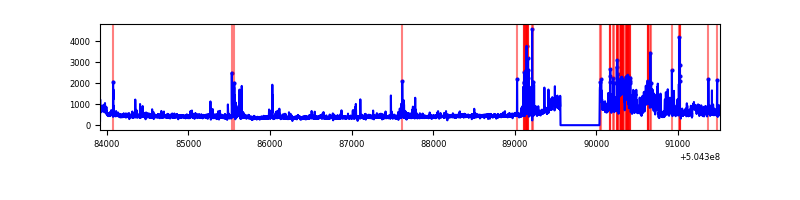 |
| C | 7603 | 7124 | 225 | 225 | 2.96% | 3.16% | 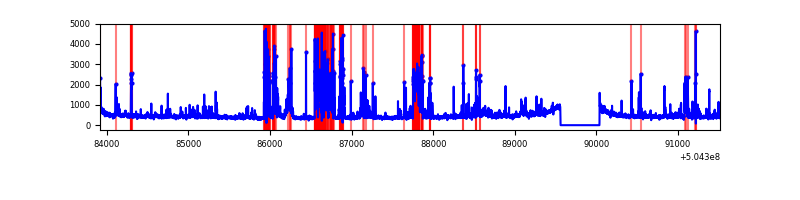 |
| D | 7602 | 7123 | 2844 | 2844 | 37.41% | 39.93% | 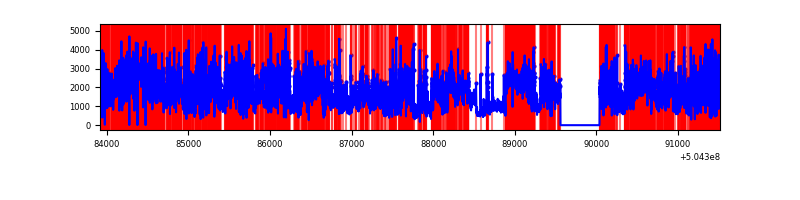 |
Top three noisy pixels from each quadrant. If the there are fewer than three noisy pixels in the level2.evt file, extra rows are filled as -1
| Pixel properties | Quadrant properties | ||||||
|---|---|---|---|---|---|---|---|
| Quadrant | DetID | PixID | Counts | Sigma | Mean | Median | Sigma |
| A | 0 | 8 | 303623 | 1628.47 | 752 | 731 | 186.0 |
| A | 7 | 7 | 79658 | 424.34 | 752 | 731 | 186.0 |
| A | 12 | 115 | 62831 | 333.87 | 752 | 731 | 186.0 |
| B | 5 | 236 | 716032 | 4556.83 | 743 | 717 | 157.0 |
| B | 5 | 185 | 134903 | 854.82 | 743 | 717 | 157.0 |
| B | 10 | 247 | 103137 | 652.45 | 743 | 717 | 157.0 |
| C | 12 | 252 | 896353 | 4466.28 | 732 | 725 | 200.5 |
| C | 13 | 3 | 149049 | 739.66 | 732 | 725 | 200.5 |
| C | 14 | 254 | 67428 | 332.63 | 732 | 725 | 200.5 |
| D | 11 | 129 | 5044859 | 29321.01 | 602 | 574 | 172.0 |
| D | 8 | 48 | 4576686 | 26599.65 | 602 | 574 | 172.0 |
| D | 2 | 62 | 247712 | 1436.54 | 602 | 574 | 172.0 |
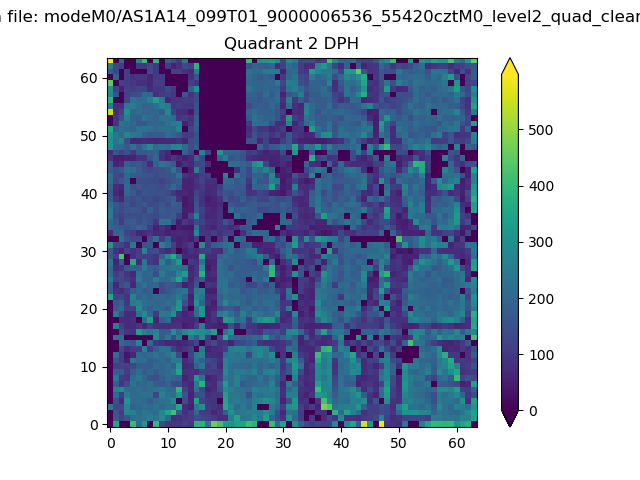
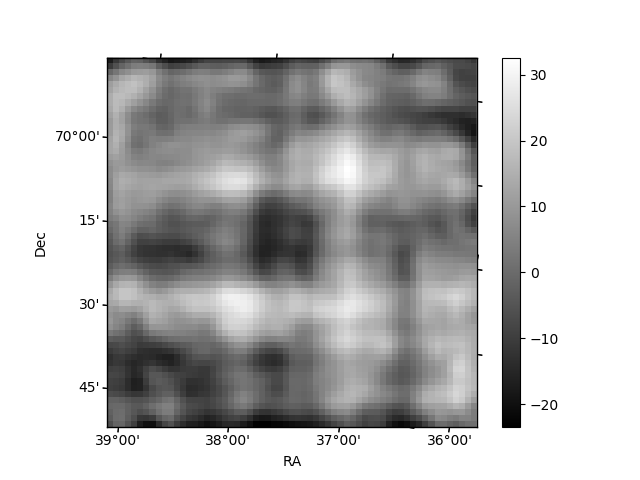
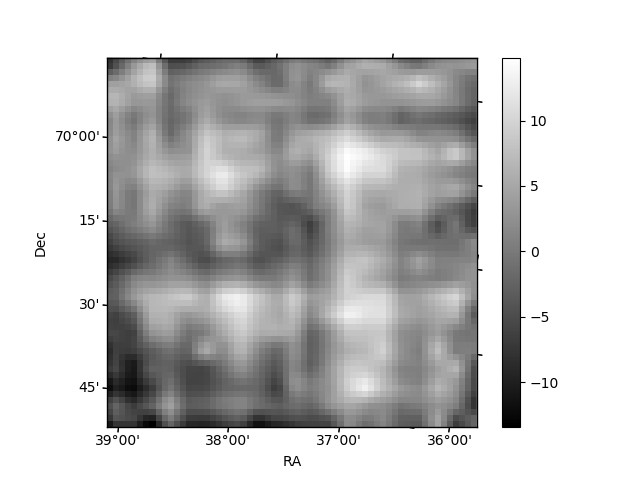
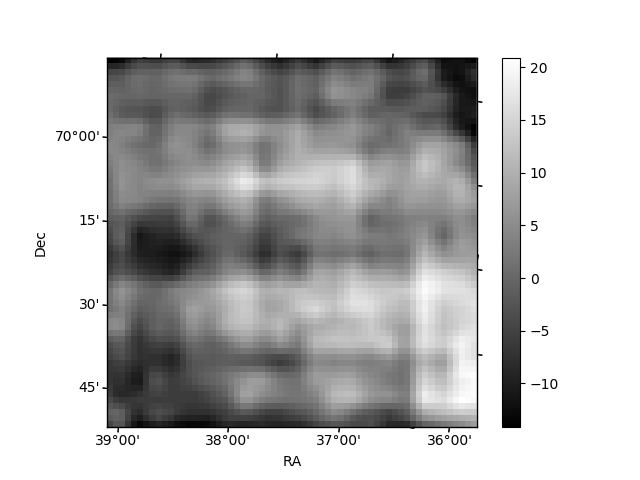
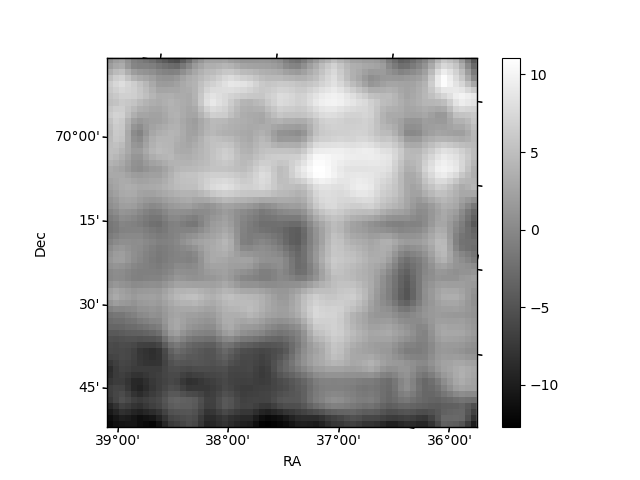
Histogram calculated using DETX and DETY for each event in the final _common_clean file
| Quadrant A | 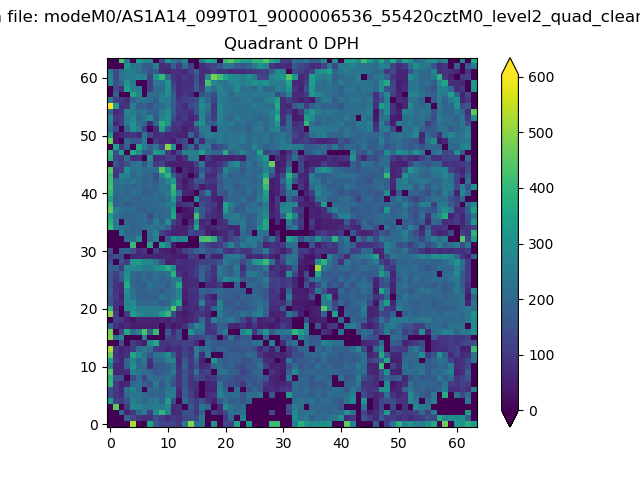 |
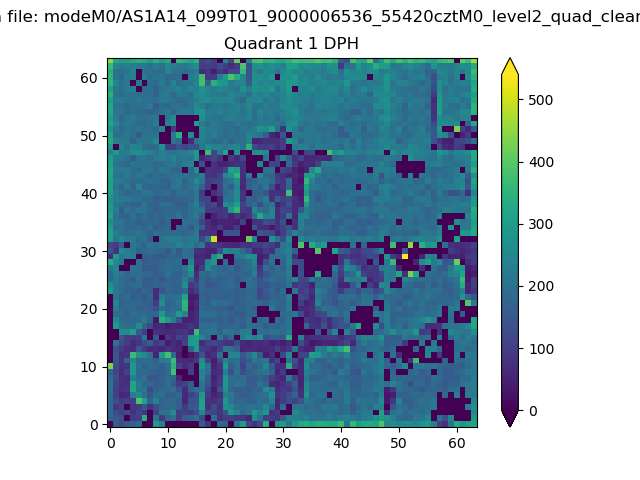 |
Quadrant B |
|---|---|---|---|
| Quadrant D | 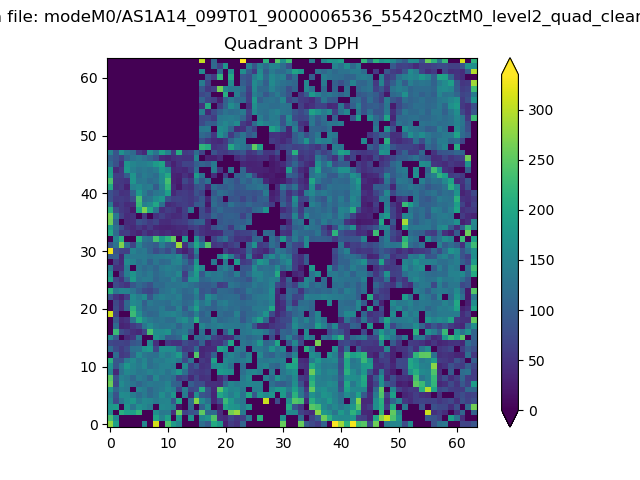 |
 |
Quadrant C |
| Plot type | Count rate plots | Images |
|---|---|---|
| Comparison with Poisson distribution Blue bars denote a histogram of data divided into 1 sec bins. Red curve is a Poisson curve with rate = median count rate of data. |
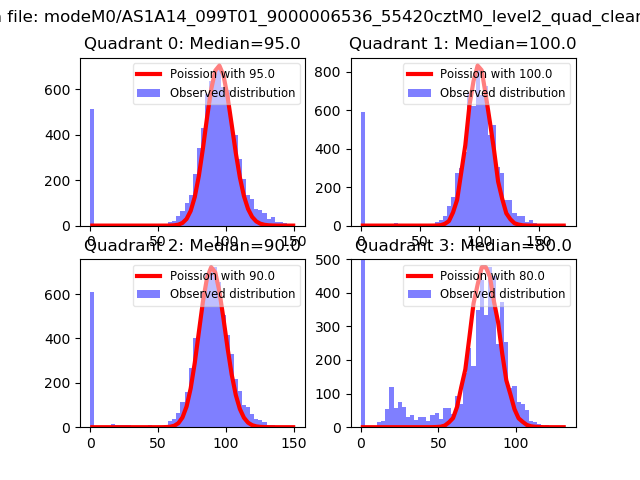 |
 |
| Quadrant-wise count rates Data is divided into 100 sec bins |
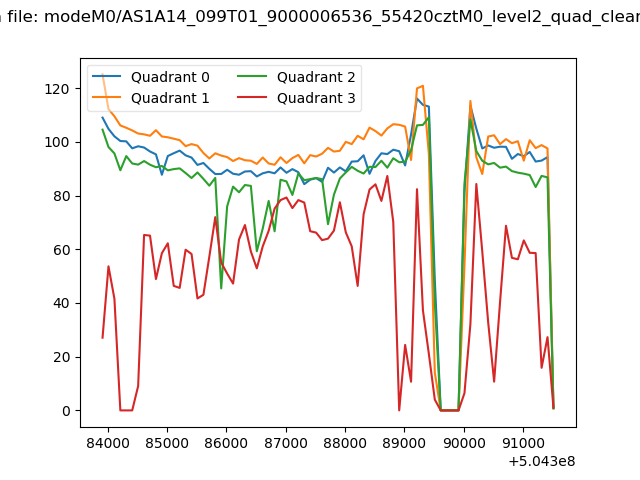 |
|
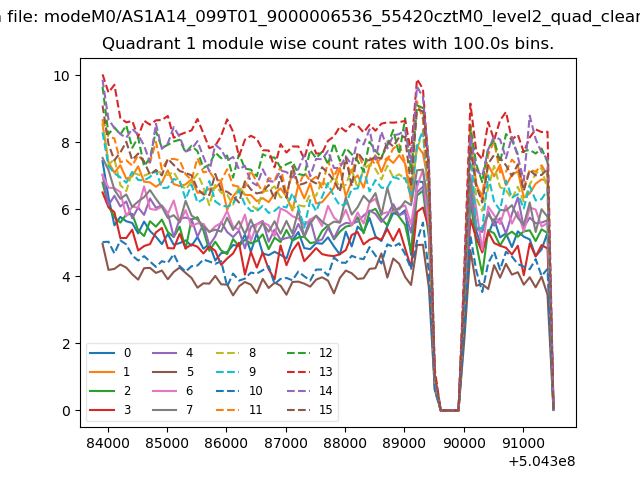
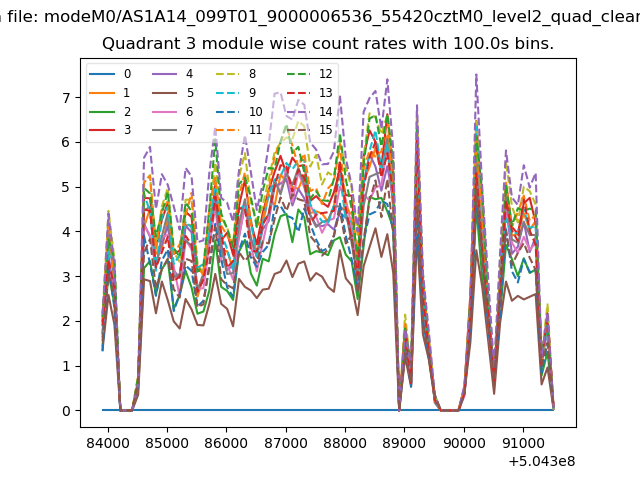
| Module-wise count rates for Quadrant A Data is divided into 100 sec bins |
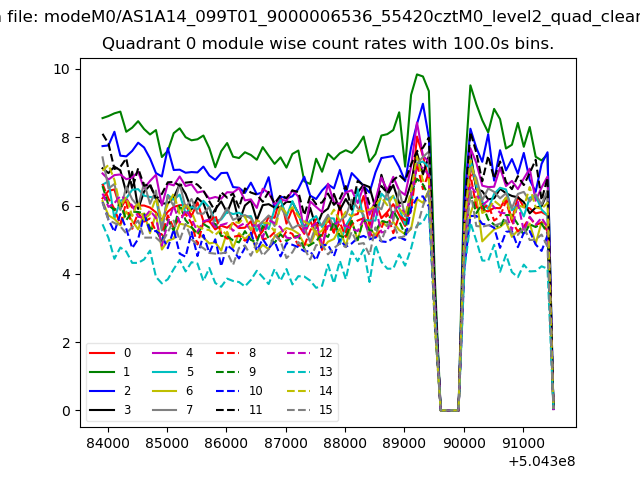 |
 |
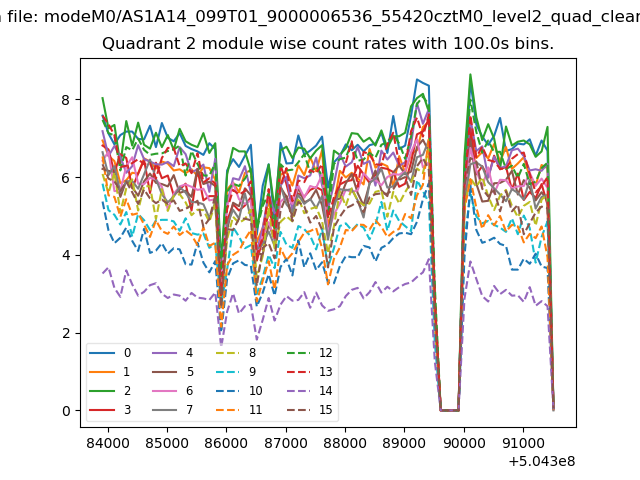
| Module-wise count rates for Quadrant B Data is divided into 100 sec bins |
 |
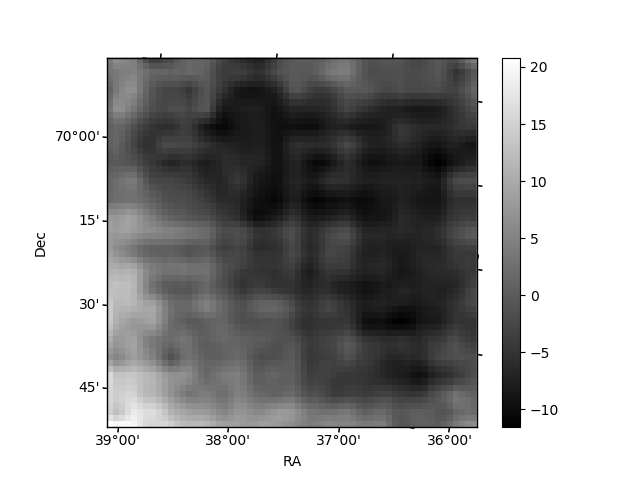 |
| Module-wise count rates for Quadrant C Data is divided into 100 sec bins |
 |
 |
| Module-wise count rates for Quadrant D Data is divided into 100 sec bins |
 |
 |
| Parameter | Plot |
|---|---|
| CZT HV Monitor | 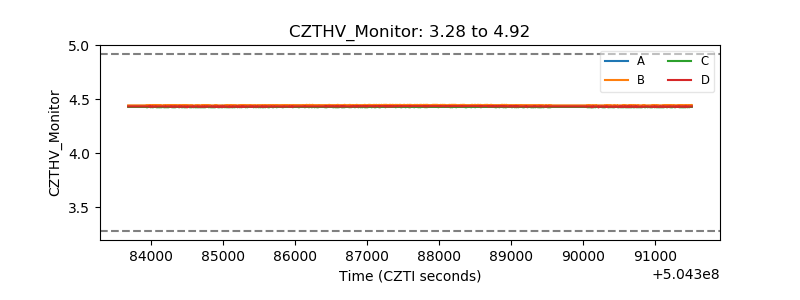 |
| D_VDD | 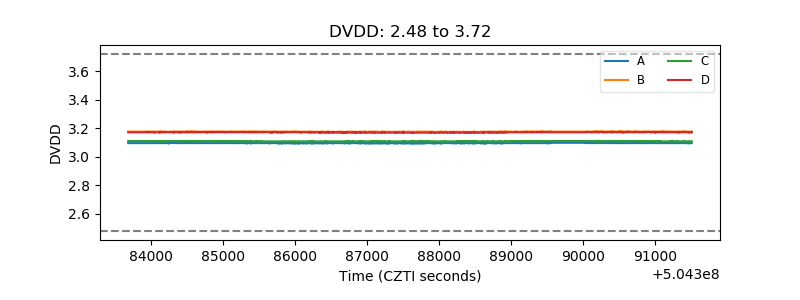 |
| Temperature 1 | 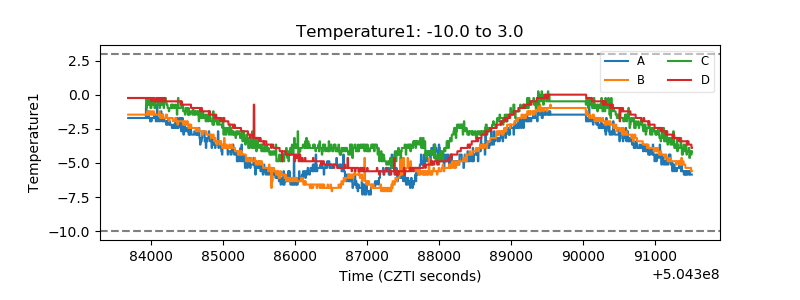 |
| Veto HV Monitor |  |
| Veto LLD | 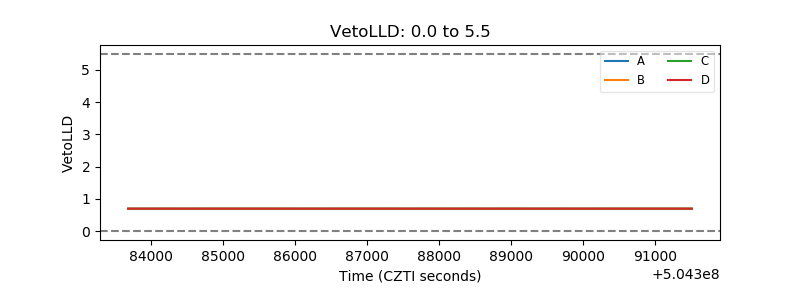 |
| Alpha Counter | 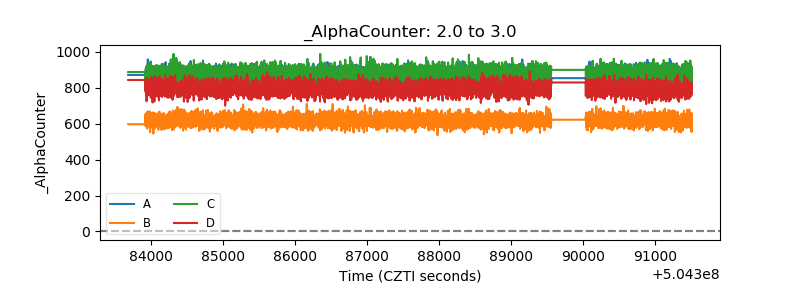 |
| _CPM_Rate | 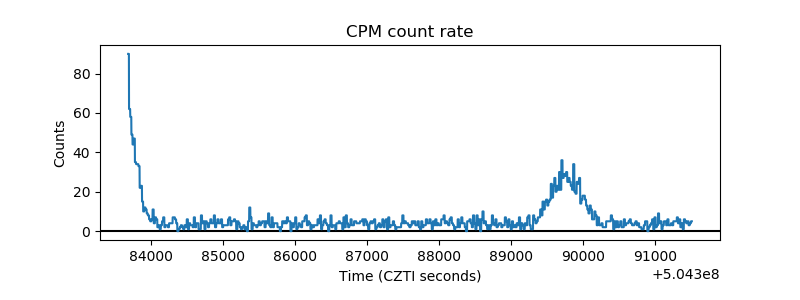 |
| CZT Counter | 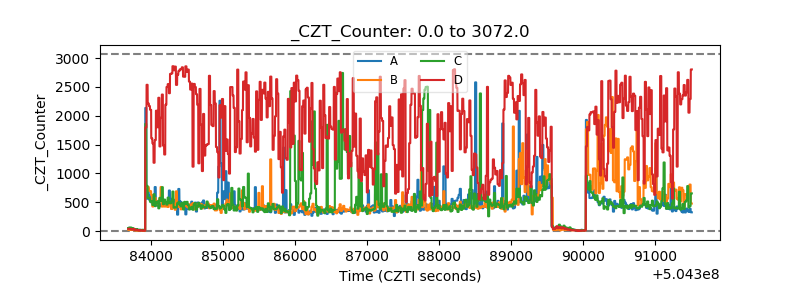 |
| +2.5 Volts monitor | 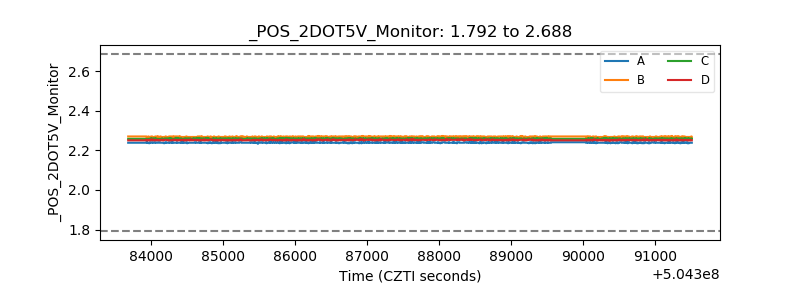 |
| +5 Volts monitor | 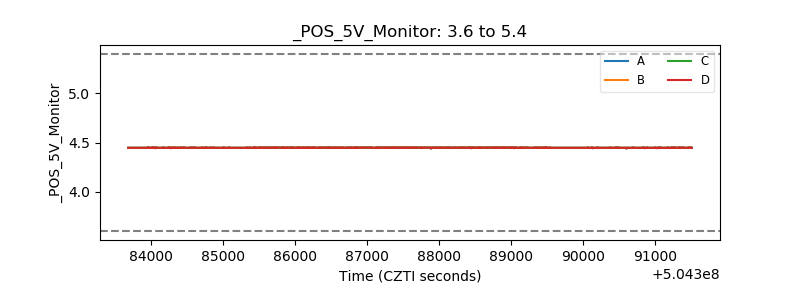 |
| _ROLL_ROT | 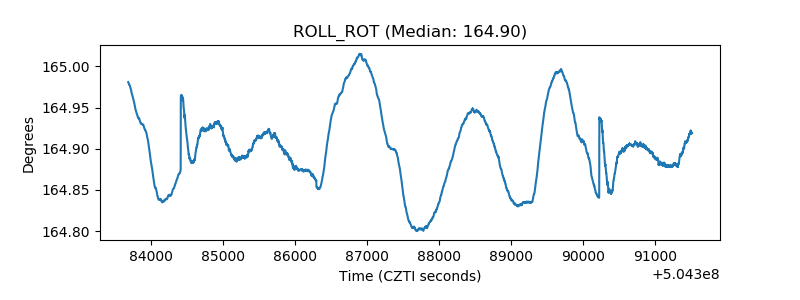 |
| _Roll_DEC | 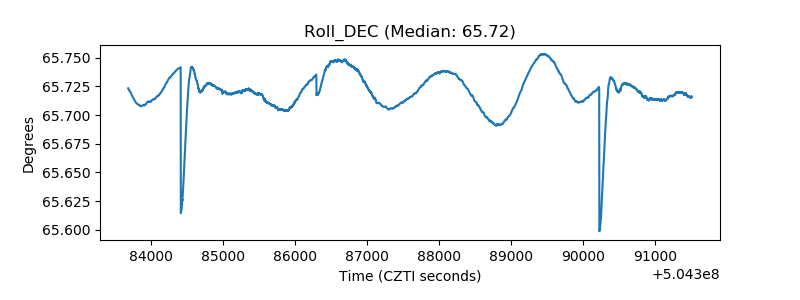 |
| _Roll_RA | 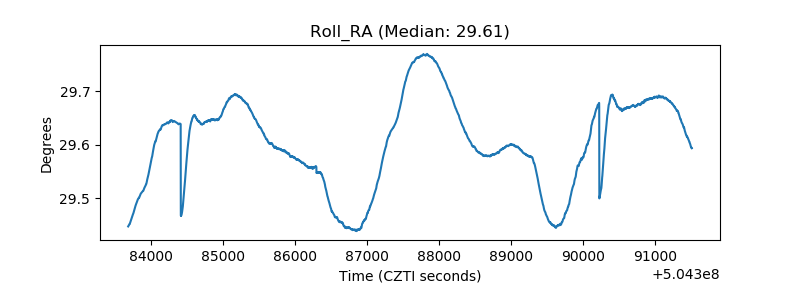 |
| Veto Counter | 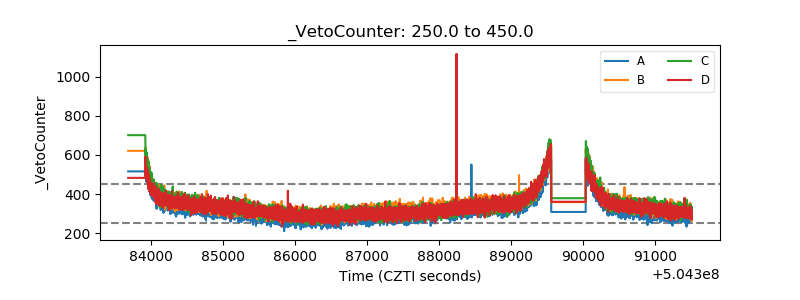 |