| Param | Original file | Final file |
|---|---|---|
| Filename | modeM0/AS1A14_099T01_9000006536_55422cztM0_level2.fits | modeM0/AS1A14_099T01_9000006536_55422cztM0_level2_quad_clean.evt |
| Size (bytes) | 854,179,200 | 98,418,240 |
| Size | 814.6 MB | 93.9 MB |
| Events in quadrant A | 4,423,916 | 703,924 |
| Events in quadrant B | 4,816,945 | 759,965 |
| Events in quadrant C | 4,396,273 | 672,080 |
| Events in quadrant D | 17,321,866 | 253,169 |
| Mode SS | |||
|---|---|---|---|
| Quadrant | BADHDUFLAG | Total packets | Discarded packets |
| A | 0 | 170 | 0 |
| B | 0 | 170 | 0 |
| C | 0 | 170 | 0 |
| D | 0 | 170 | 0 |
| Mode M0 | |||
|---|---|---|---|
| Quadrant | BADHDUFLAG | Total packets | Discarded packets |
| A | 0 | 19680 | 1 |
| B | 0 | 20408 | 0 |
| C | 0 | 19682 | 0 |
| D | 0 | 57252 | 0 |
| Quadrant | Total seconds | Saturated seconds | Saturation percentage |
|---|---|---|---|
| A | 8500 | 216 | 2.541176% |
| B | 8501 | 202 | 2.376191% |
| C | 8501 | 155 | 1.823315% |
| D | 8501 | 5549 | 65.274674% |
Noise dominated data is calculated using 1-second bins in cleaned event files. If a bin has >2000 counts, and if more than 50% of those come from <1% of pixels, then it is considered to be noise-dominated and hence unusable.
| Quadrant | # 1 sec bins | Bins with >0 counts | Bins with >2000 counts | High rate bins dominated by noise | Noise dominated (total time) | Noise dominated (detector-on time) | Marked lightcurve |
|---|---|---|---|---|---|---|---|
| A | 8768 | 8768 | 152 | 152 | 1.73% | 1.73% | 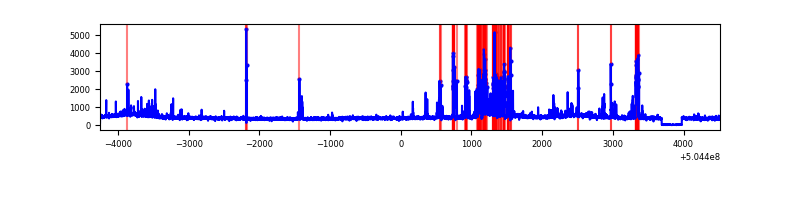 |
| B | 8769 | 8769 | 127 | 127 | 1.45% | 1.45% | 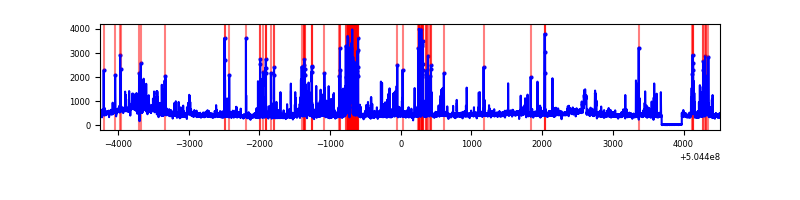 |
| C | 8769 | 8769 | 99 | 99 | 1.13% | 1.13% | 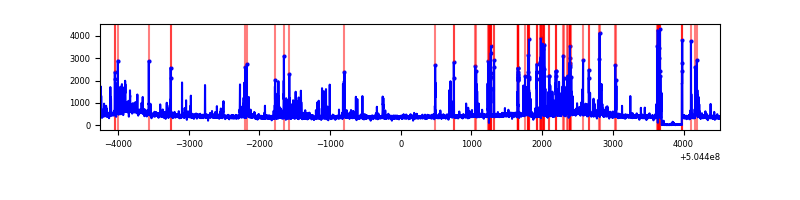 |
| D | 8769 | 8709 | 4886 | 4886 | 55.72% | 56.10% | 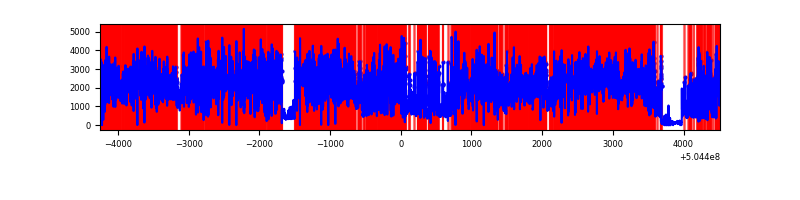 |
Top three noisy pixels from each quadrant. If the there are fewer than three noisy pixels in the level2.evt file, extra rows are filled as -1
| Pixel properties | Quadrant properties | ||||||
|---|---|---|---|---|---|---|---|
| Quadrant | DetID | PixID | Counts | Sigma | Mean | Median | Sigma |
| A | 0 | 8 | 554724 | 2513.69 | 886 | 865 | 220.3 |
| A | 4 | 159 | 229181 | 1036.21 | 886 | 865 | 220.3 |
| A | 7 | 14 | 47721 | 212.66 | 886 | 865 | 220.3 |
| B | 12 | 32 | 510114 | 2740.8 | 880 | 850 | 185.8 |
| B | 7 | 252 | 346889 | 1862.34 | 880 | 850 | 185.8 |
| B | 5 | 236 | 191840 | 1027.89 | 880 | 850 | 185.8 |
| C | 13 | 3 | 628824 | 2616.81 | 874 | 866 | 240.0 |
| C | 15 | 148 | 113496 | 469.35 | 874 | 866 | 240.0 |
| C | 15 | 178 | 55694 | 228.48 | 874 | 866 | 240.0 |
| D | 11 | 129 | 13110654 | 79695.62 | 572 | 546 | 164.5 |
| D | 8 | 48 | 396607 | 2407.63 | 572 | 546 | 164.5 |
| D | 2 | 249 | 318199 | 1931.0 | 572 | 546 | 164.5 |
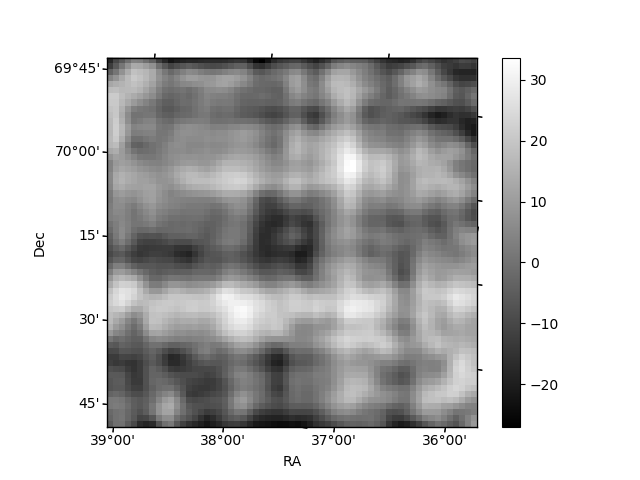
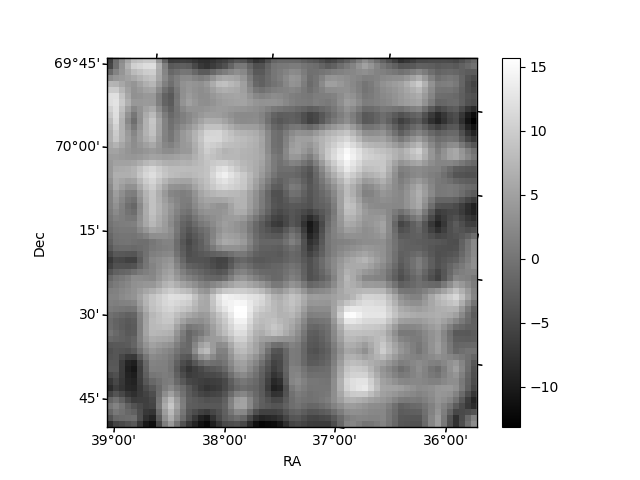
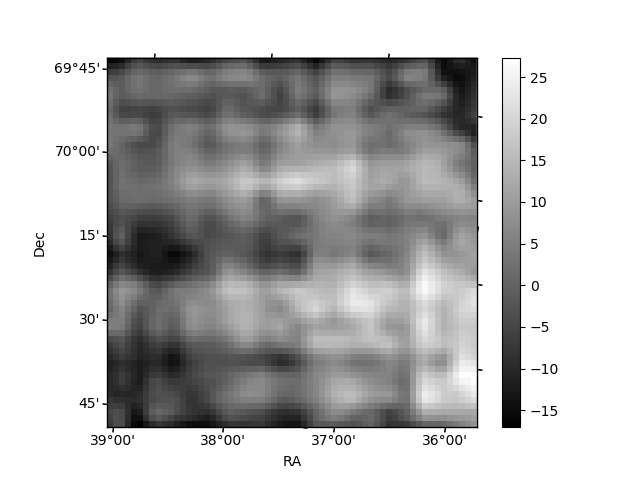
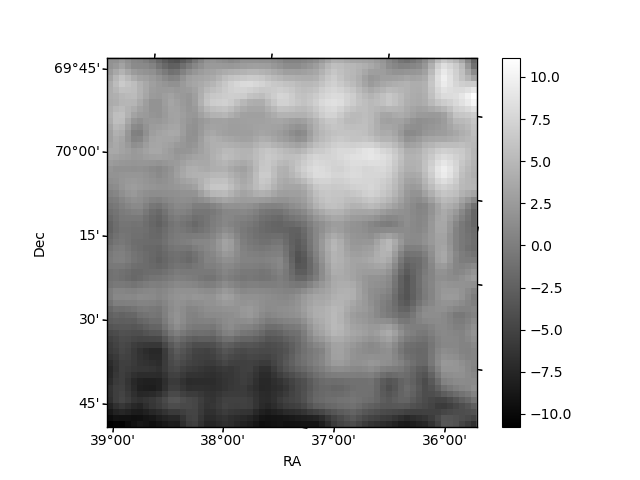
Histogram calculated using DETX and DETY for each event in the final _common_clean file
| Quadrant A | 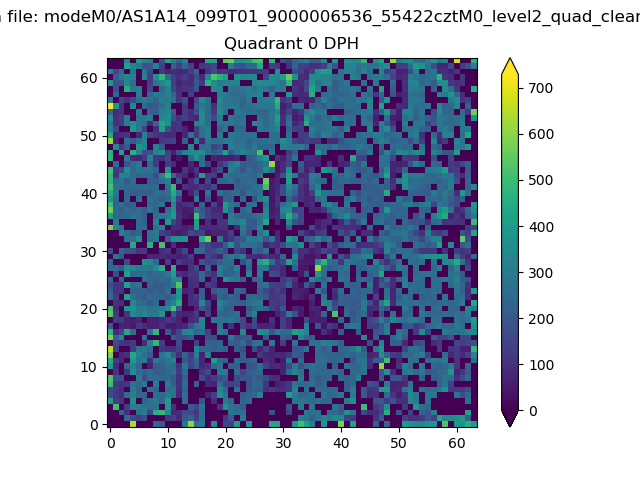 |
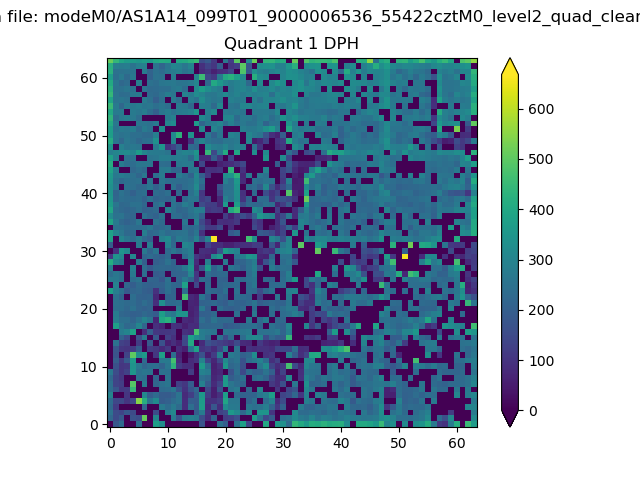 |
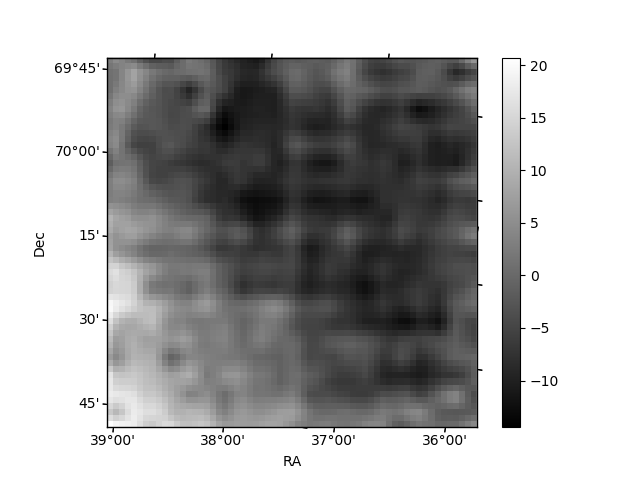
Quadrant B |
|---|---|---|---|
| Quadrant D | 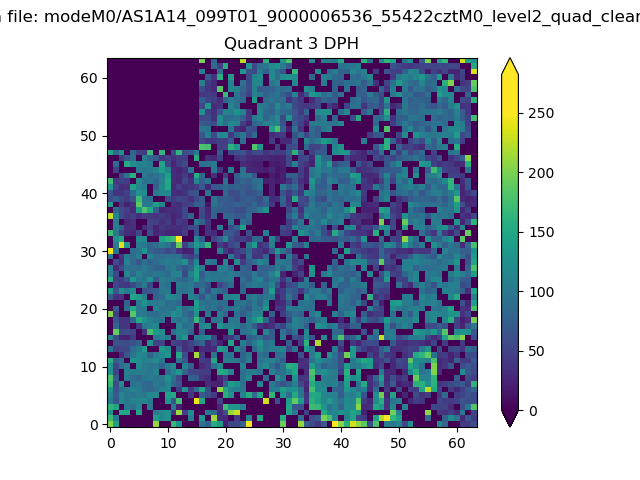 |
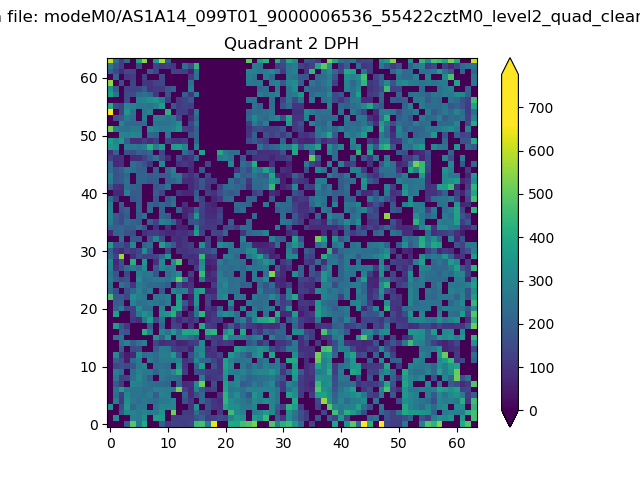 |
Quadrant C |
| Plot type | Count rate plots | Images |
|---|---|---|
| Comparison with Poisson distribution Blue bars denote a histogram of data divided into 1 sec bins. Red curve is a Poisson curve with rate = median count rate of data. |
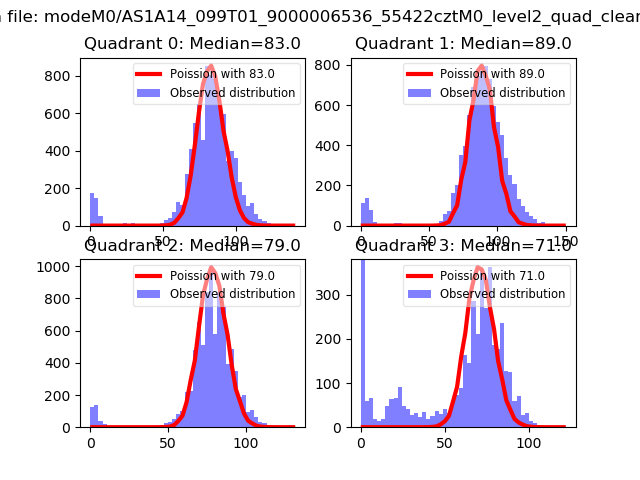 |
 |
| Quadrant-wise count rates Data is divided into 100 sec bins |
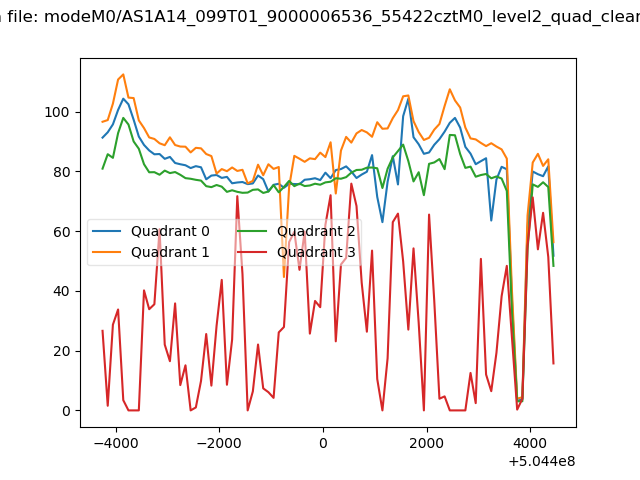 |
|
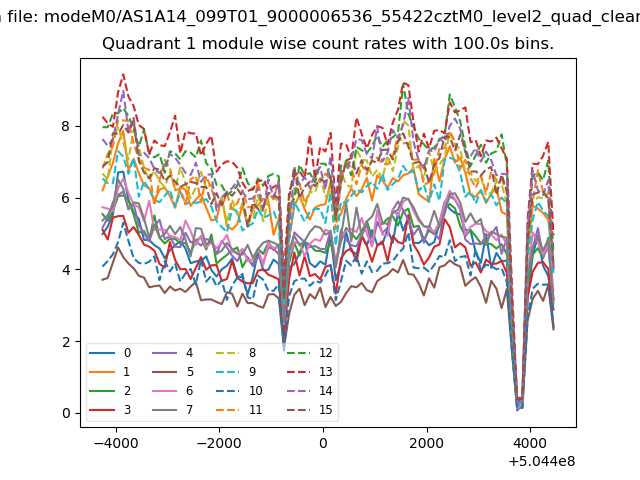
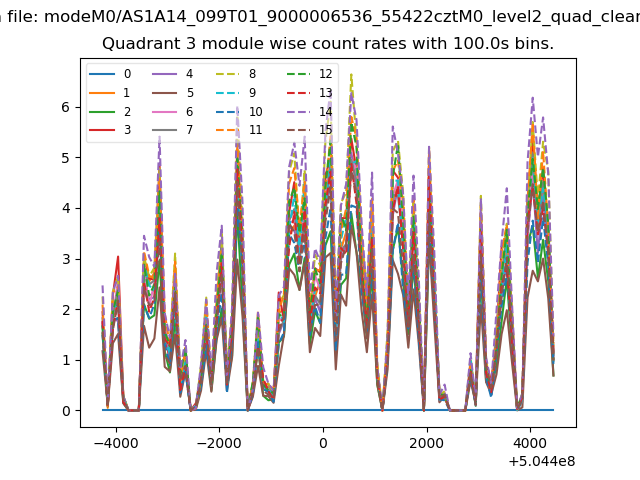
| Module-wise count rates for Quadrant A Data is divided into 100 sec bins |
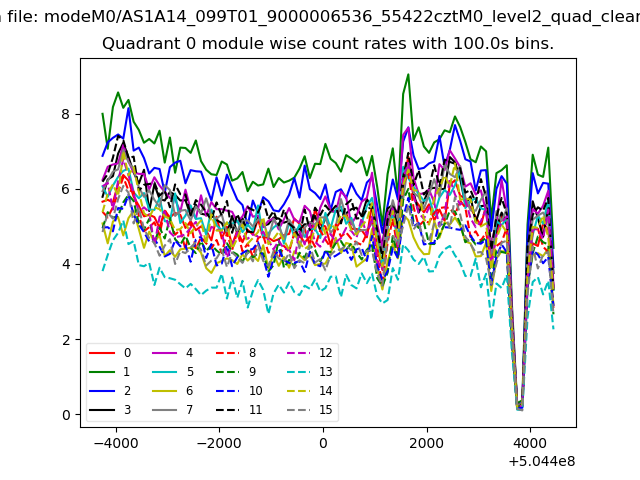 |
 |
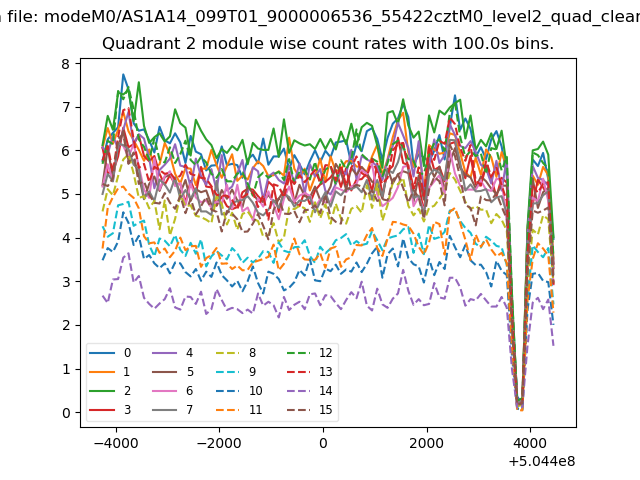
| Module-wise count rates for Quadrant B Data is divided into 100 sec bins |
 |
 |
| Module-wise count rates for Quadrant C Data is divided into 100 sec bins |
 |
 |
| Module-wise count rates for Quadrant D Data is divided into 100 sec bins |
 |
 |
| Parameter | Plot |
|---|---|
| CZT HV Monitor | 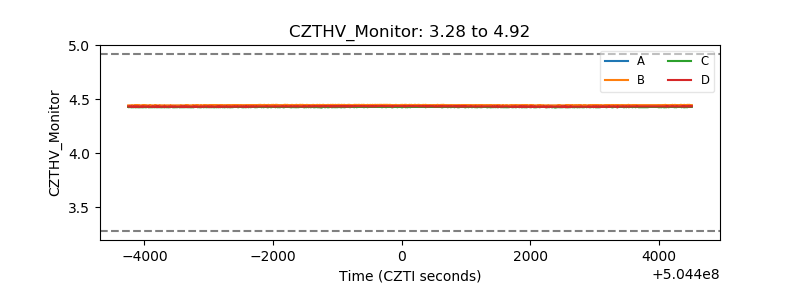 |
| D_VDD | 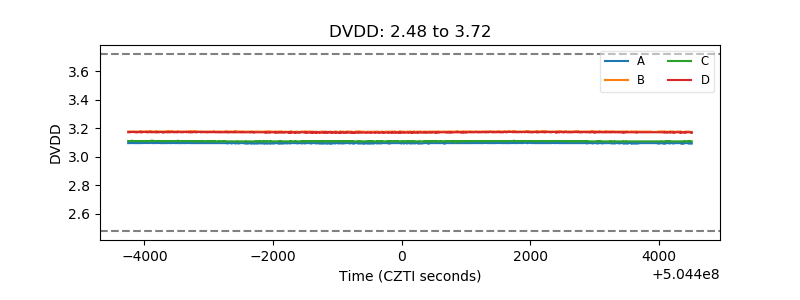 |
| Temperature 1 | 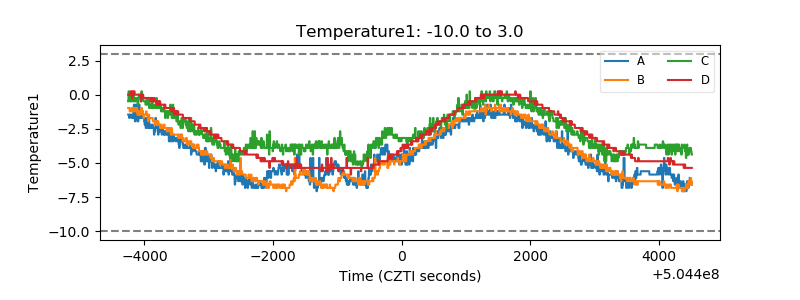 |
| Veto HV Monitor |  |
| Veto LLD | 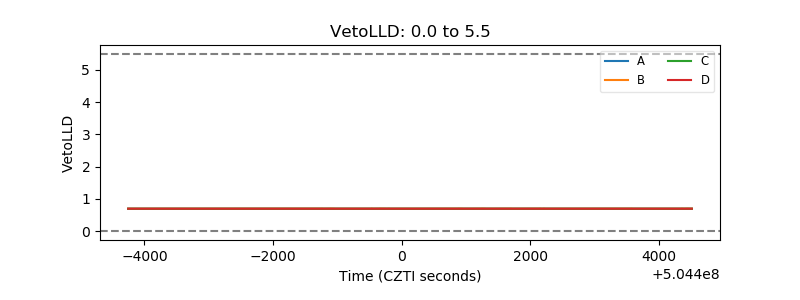 |
| Alpha Counter | 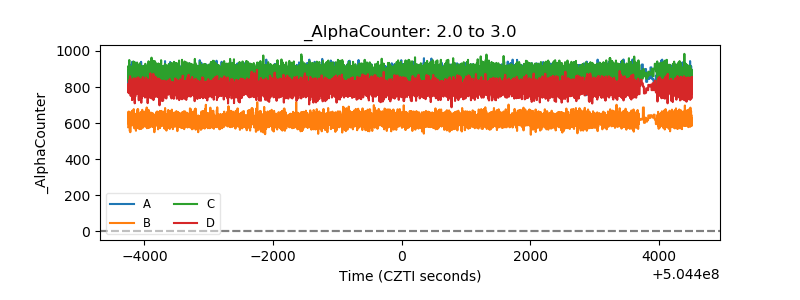 |
| _CPM_Rate | 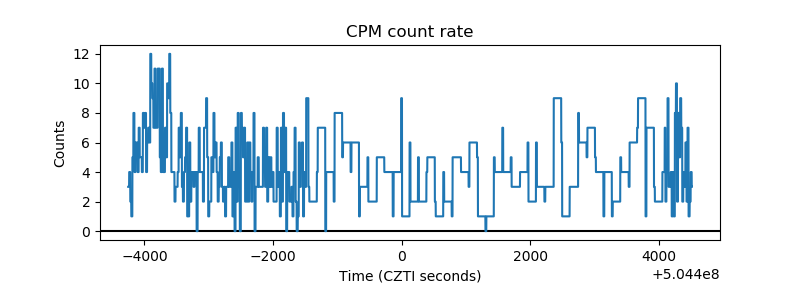 |
| CZT Counter | 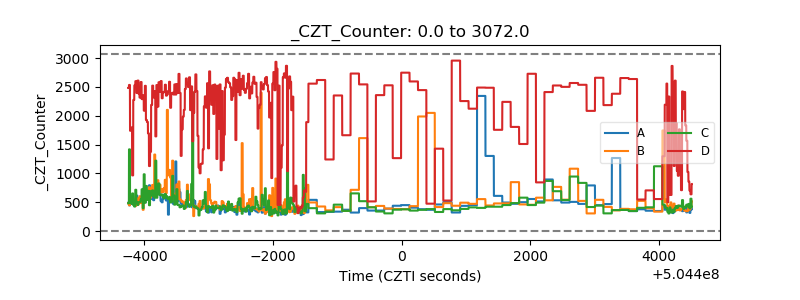 |
| +2.5 Volts monitor | 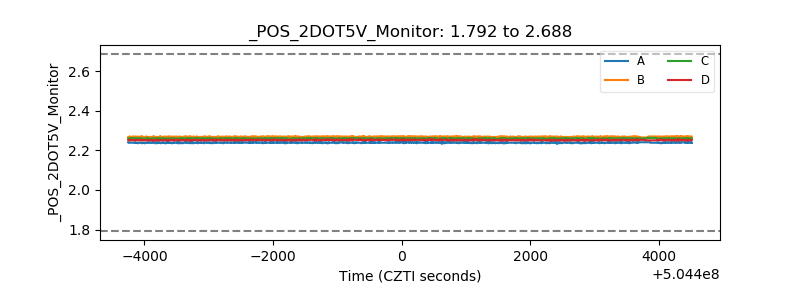 |
| +5 Volts monitor | 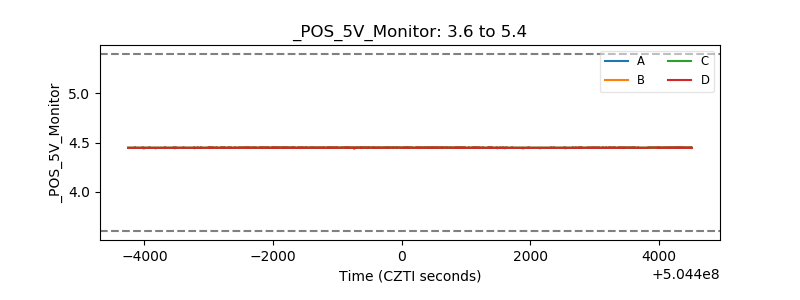 |
| _ROLL_ROT | 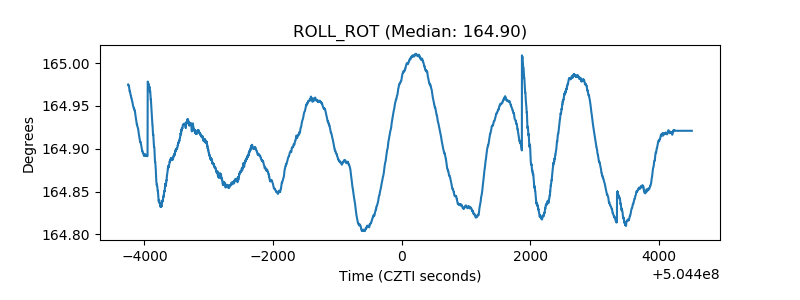 |
| _Roll_DEC | 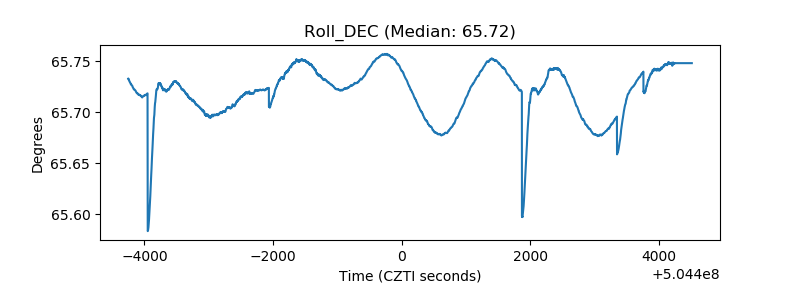 |
| _Roll_RA | 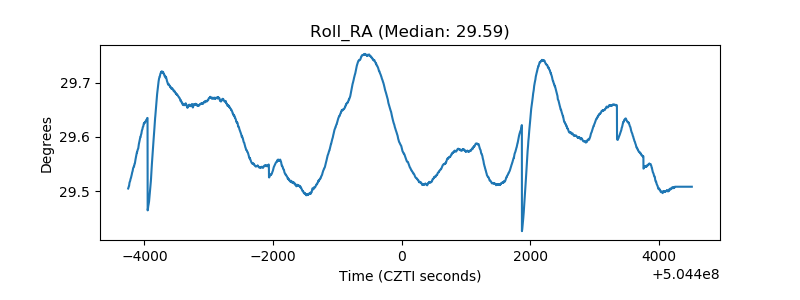 |
| Veto Counter | 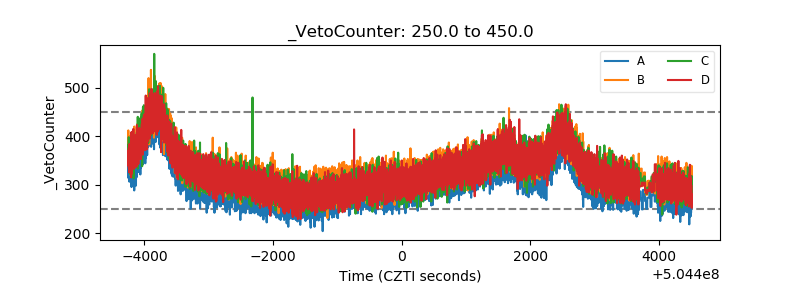 |