| Param | Original file | Final file |
|---|---|---|
| Filename | modeM0/AS1A14_099T01_9000006536_55423cztM0_level2.fits | modeM0/AS1A14_099T01_9000006536_55423cztM0_level2_quad_clean.evt |
| Size (bytes) | 802,549,440 | 95,279,040 |
| Size | 765.4 MB | 90.9 MB |
| Events in quadrant A | 4,312,196 | 674,946 |
| Events in quadrant B | 4,232,945 | 738,371 |
| Events in quadrant C | 4,210,220 | 656,824 |
| Events in quadrant D | 16,294,486 | 226,192 |
| Mode SS | |||
|---|---|---|---|
| Quadrant | BADHDUFLAG | Total packets | Discarded packets |
| A | 0 | 170 | 0 |
| B | 0 | 170 | 0 |
| C | 0 | 170 | 0 |
| D | 0 | 170 | 0 |
| Mode M0 | |||
|---|---|---|---|
| Quadrant | BADHDUFLAG | Total packets | Discarded packets |
| A | 0 | 19206 | 0 |
| B | 0 | 18962 | 0 |
| C | 0 | 18917 | 0 |
| D | 0 | 54250 | 0 |
| Quadrant | Total seconds | Saturated seconds | Saturation percentage |
|---|---|---|---|
| A | 8466 | 128 | 1.511930% |
| B | 8467 | 100 | 1.181056% |
| C | 8467 | 110 | 1.299161% |
| D | 8467 | 5463 | 64.521082% |
Noise dominated data is calculated using 1-second bins in cleaned event files. If a bin has >2000 counts, and if more than 50% of those come from <1% of pixels, then it is considered to be noise-dominated and hence unusable.
| Quadrant | # 1 sec bins | Bins with >0 counts | Bins with >2000 counts | High rate bins dominated by noise | Noise dominated (total time) | Noise dominated (detector-on time) | Marked lightcurve |
|---|---|---|---|---|---|---|---|
| A | 8734 | 8734 | 77 | 77 | 0.88% | 0.88% | 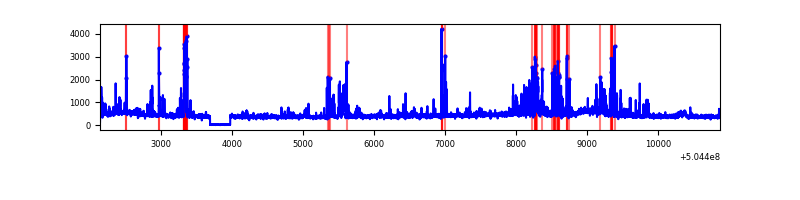 |
| B | 8735 | 8735 | 47 | 47 | 0.54% | 0.54% | 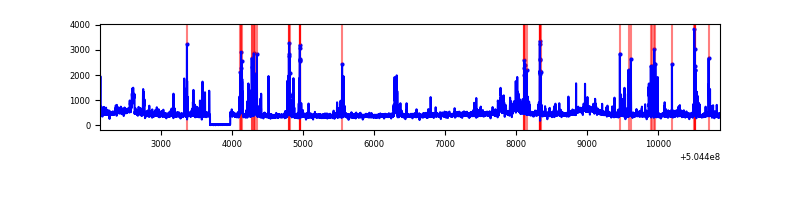 |
| C | 8735 | 8735 | 80 | 80 | 0.92% | 0.92% | 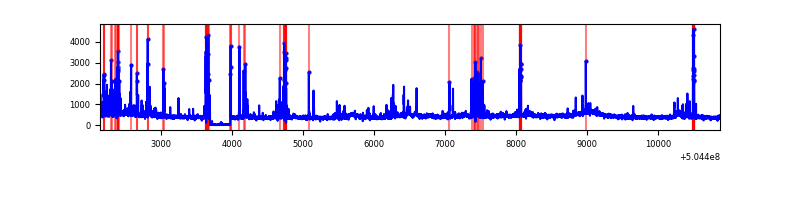 |
| D | 8735 | 8674 | 4636 | 4636 | 53.07% | 53.45% | 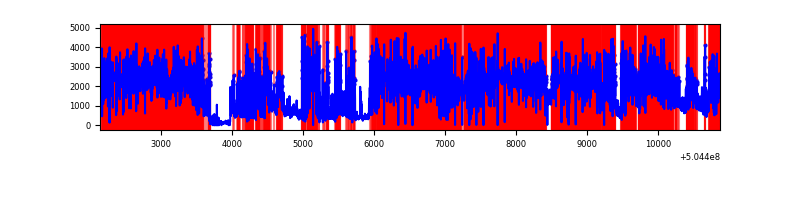 |
Top three noisy pixels from each quadrant. If the there are fewer than three noisy pixels in the level2.evt file, extra rows are filled as -1
| Pixel properties | Quadrant properties | ||||||
|---|---|---|---|---|---|---|---|
| Quadrant | DetID | PixID | Counts | Sigma | Mean | Median | Sigma |
| A | 4 | 159 | 396185 | 1793.54 | 881 | 856 | 220.4 |
| A | 0 | 8 | 188983 | 853.5 | 881 | 856 | 220.4 |
| A | 6 | 162 | 78594 | 352.68 | 881 | 856 | 220.4 |
| B | 7 | 252 | 367735 | 1971.14 | 876 | 843 | 186.1 |
| B | 5 | 236 | 158021 | 844.44 | 876 | 843 | 186.1 |
| B | 10 | 247 | 87344 | 464.73 | 876 | 843 | 186.1 |
| C | 13 | 3 | 560375 | 2365.76 | 868 | 860 | 236.5 |
| C | 3 | 248 | 59218 | 246.75 | 868 | 860 | 236.5 |
| C | 12 | 252 | 52855 | 219.85 | 868 | 860 | 236.5 |
| D | 11 | 129 | 13602499 | 93795.84 | 504 | 482 | 145.0 |
| D | 8 | 160 | 132696 | 911.71 | 504 | 482 | 145.0 |
| D | 3 | 12 | 92979 | 637.83 | 504 | 482 | 145.0 |
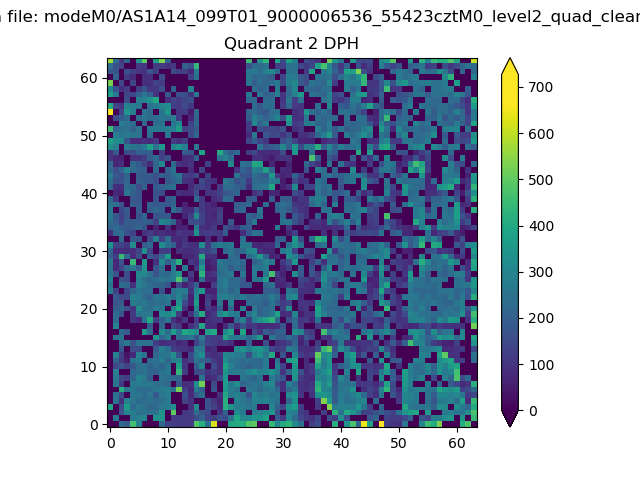
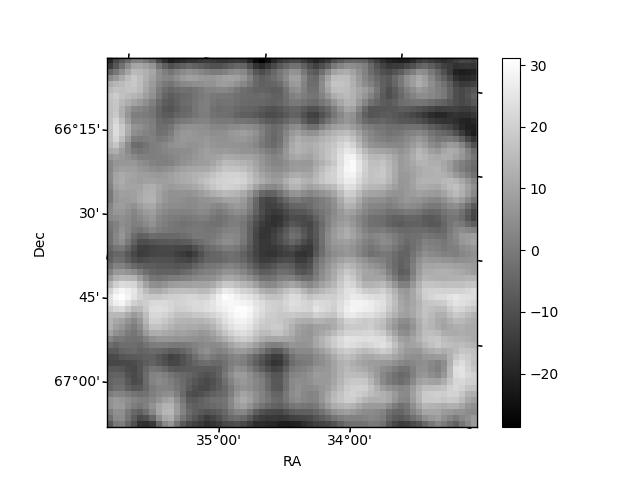
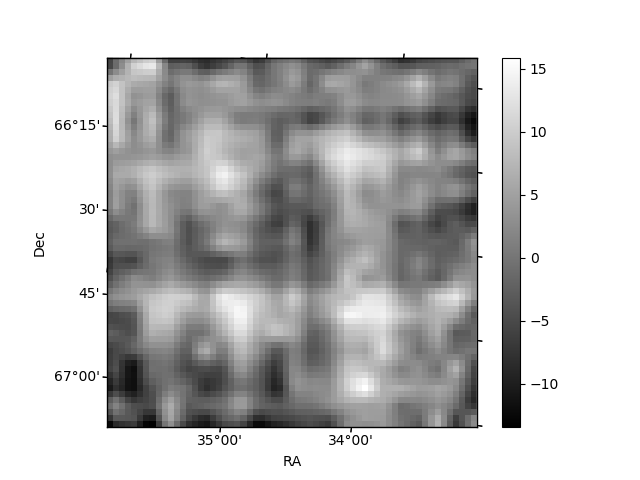
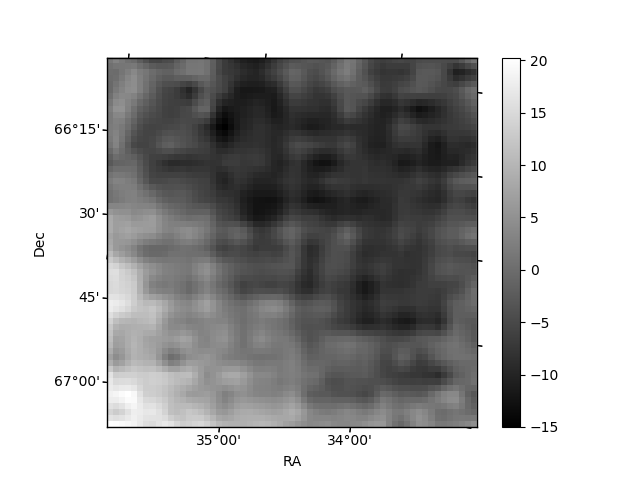
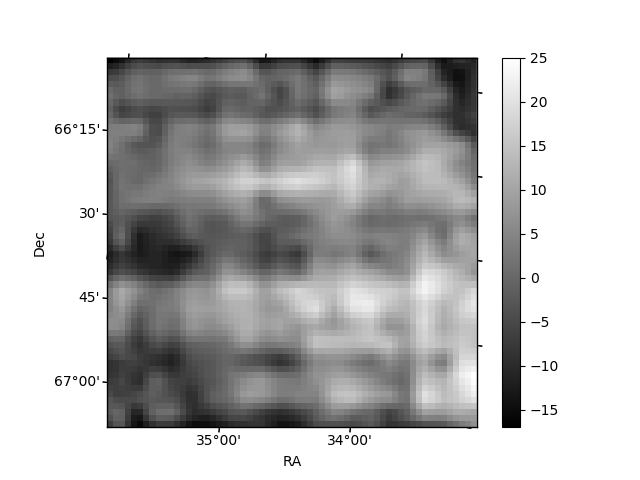
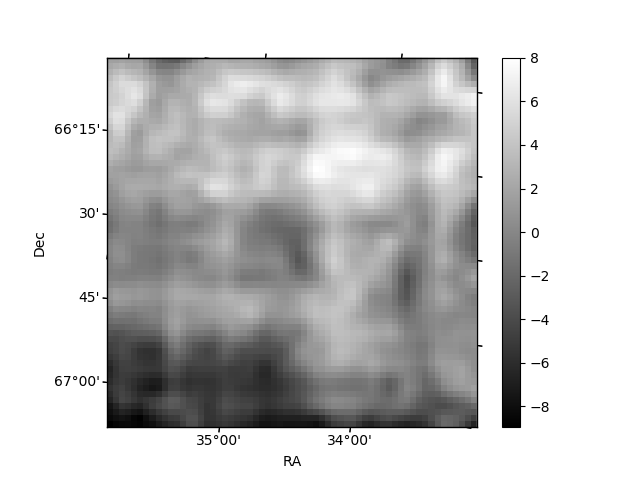
Histogram calculated using DETX and DETY for each event in the final _common_clean file
| Quadrant A | 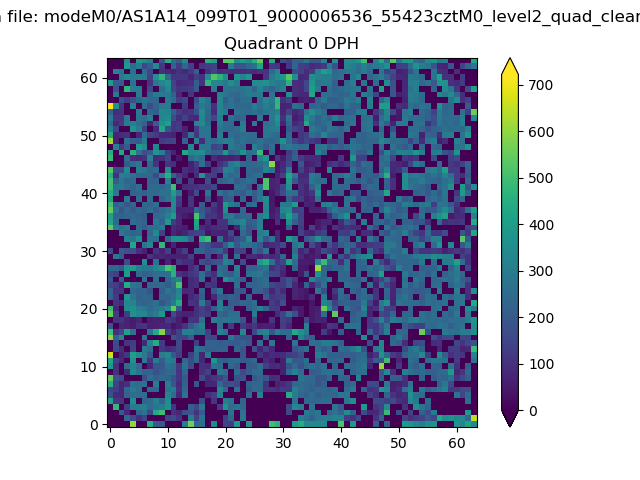 |
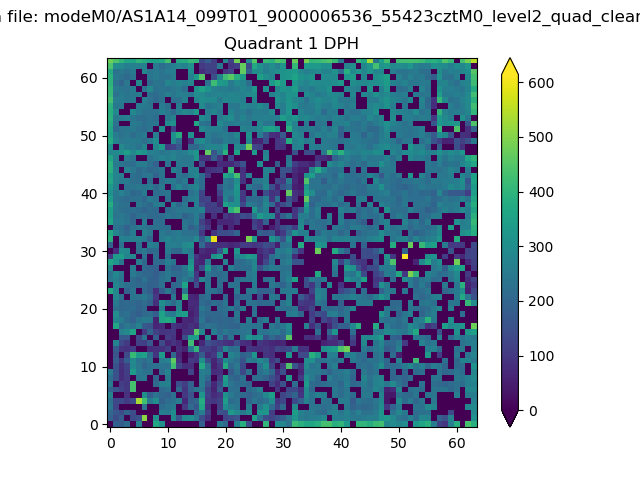 |
Quadrant B |
|---|---|---|---|
| Quadrant D | 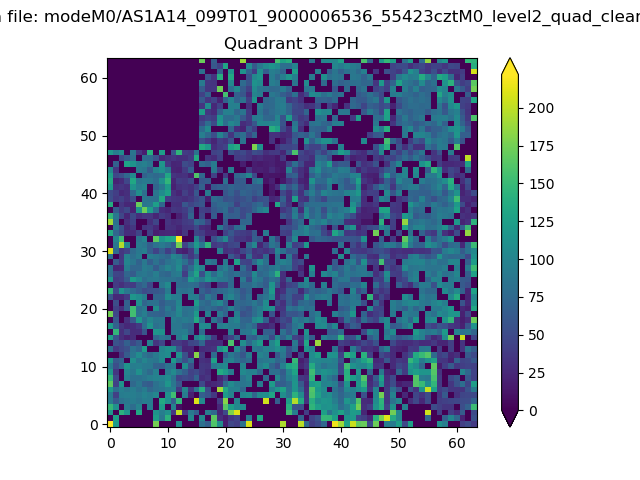 |
 |
Quadrant C |
| Plot type | Count rate plots | Images |
|---|---|---|
| Comparison with Poisson distribution Blue bars denote a histogram of data divided into 1 sec bins. Red curve is a Poisson curve with rate = median count rate of data. |
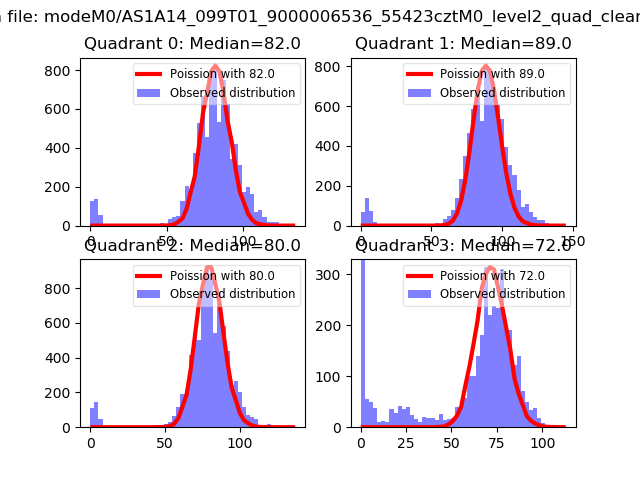 |
 |
| Quadrant-wise count rates Data is divided into 100 sec bins |
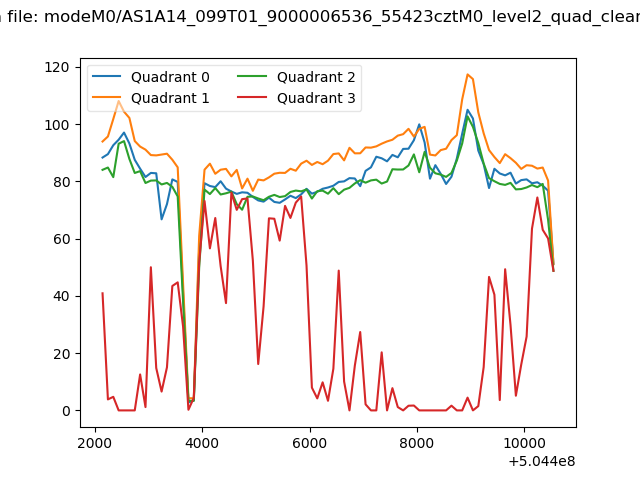 |
|
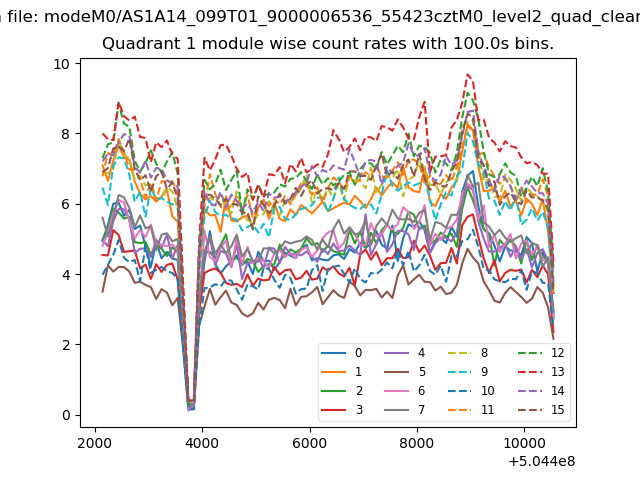
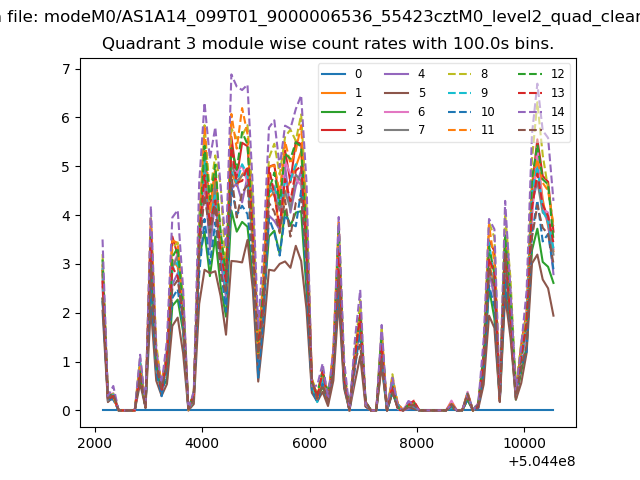
| Module-wise count rates for Quadrant A Data is divided into 100 sec bins |
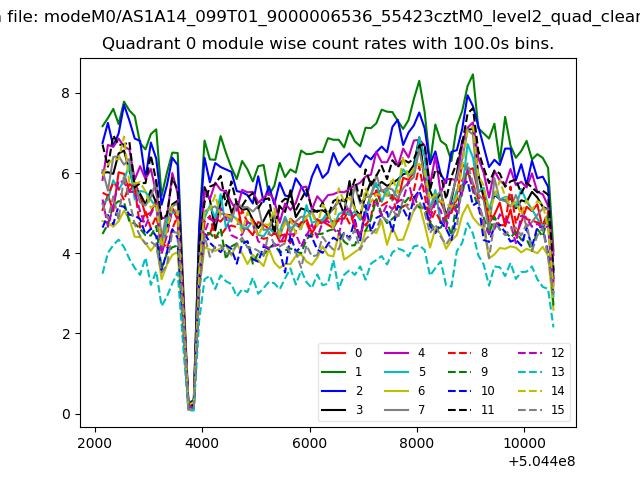 |
 |
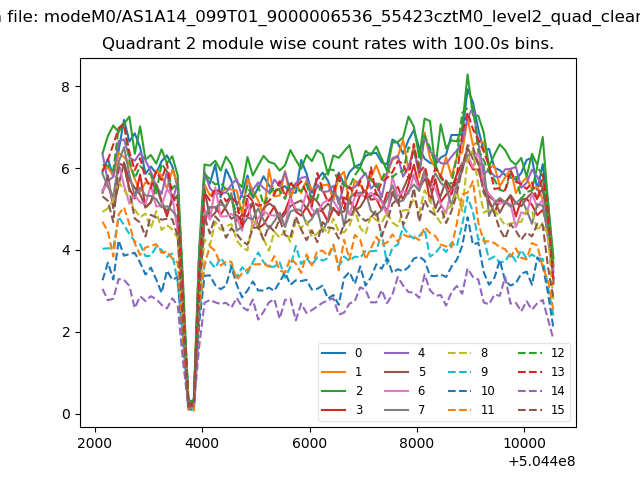
| Module-wise count rates for Quadrant B Data is divided into 100 sec bins |
 |
 |
| Module-wise count rates for Quadrant C Data is divided into 100 sec bins |
 |
 |
| Module-wise count rates for Quadrant D Data is divided into 100 sec bins |
 |
 |
| Parameter | Plot |
|---|---|
| CZT HV Monitor | 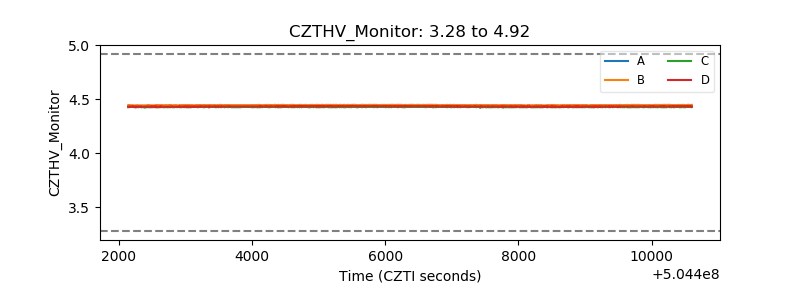 |
| D_VDD | 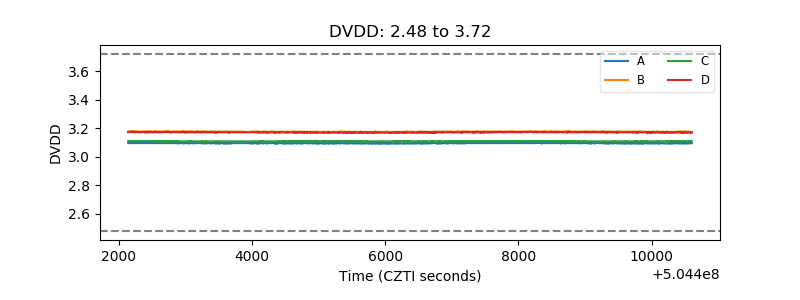 |
| Temperature 1 | 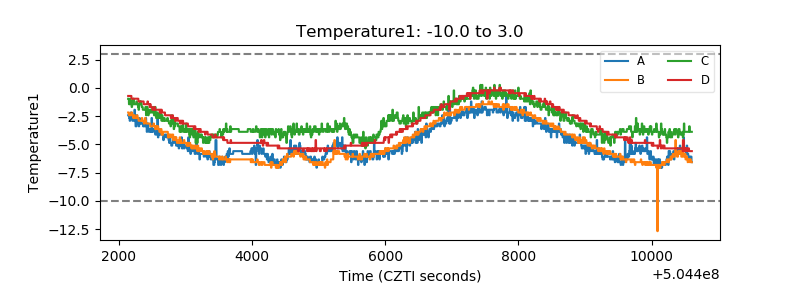 |
| Veto HV Monitor | 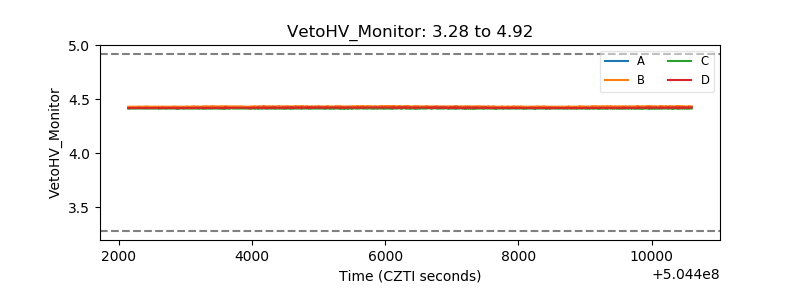 |
| Veto LLD | 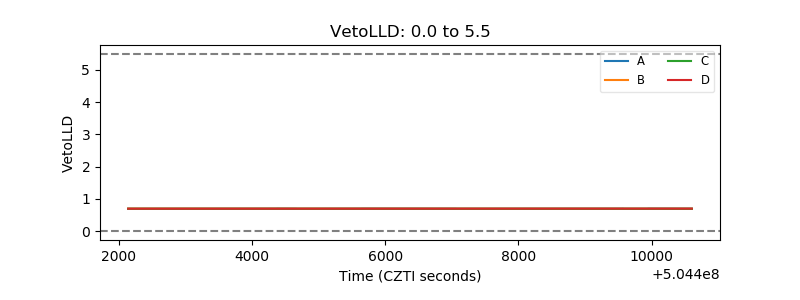 |
| Alpha Counter | 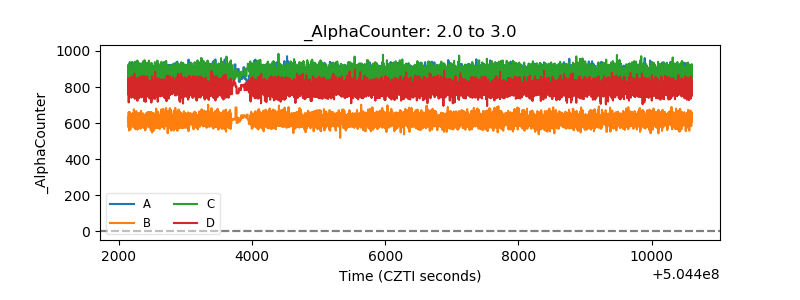 |
| _CPM_Rate | 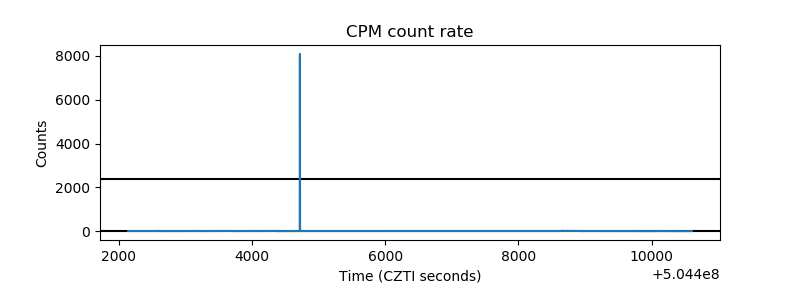 |
| CZT Counter | 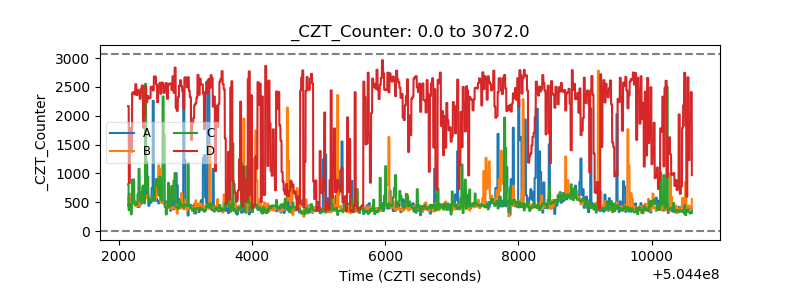 |
| +2.5 Volts monitor |  |
| +5 Volts monitor |  |
| _ROLL_ROT | 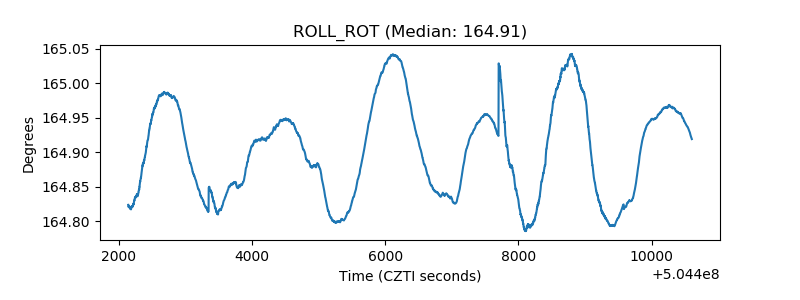 |
| _Roll_DEC | 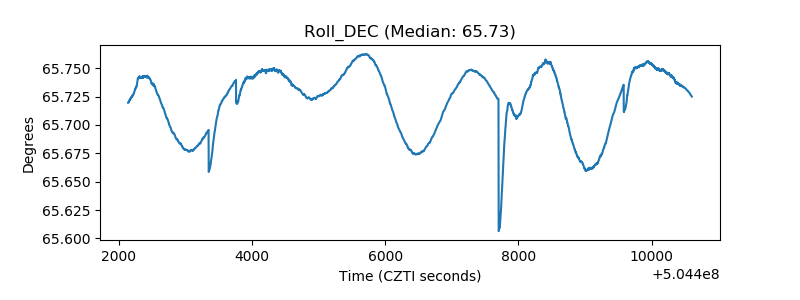 |
| _Roll_RA | 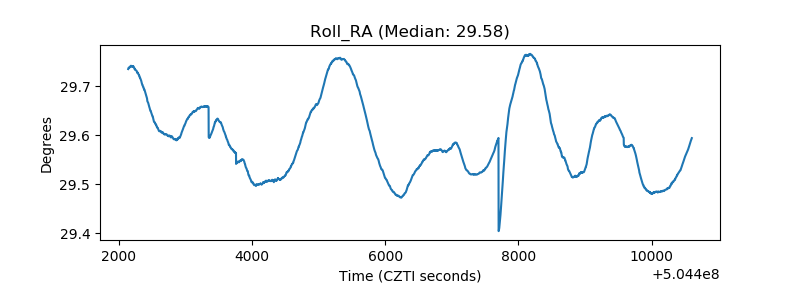 |
| Veto Counter | 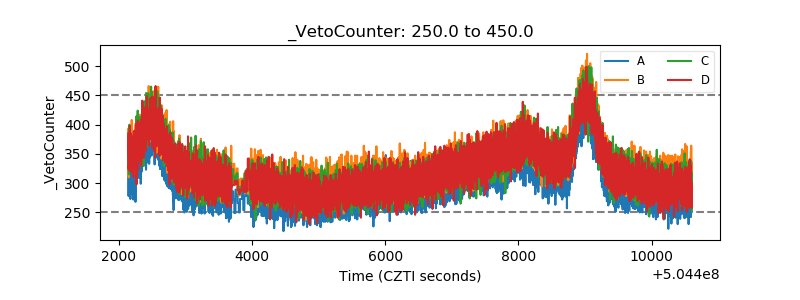 |