| Param | Original file | Final file |
|---|---|---|
| Filename | modeM0/AS1A14_099T01_9000006536_55426cztM0_level2.fits | modeM0/AS1A14_099T01_9000006536_55426cztM0_level2_quad_clean.evt |
| Size (bytes) | 745,519,680 | 126,887,040 |
| Size | 711.0 MB | 121.0 MB |
| Events in quadrant A | 4,107,540 | 877,345 |
| Events in quadrant B | 5,273,962 | 921,574 |
| Events in quadrant C | 4,494,737 | 831,951 |
| Events in quadrant D | 12,984,764 | 553,802 |
| Mode M9 | |||
|---|---|---|---|
| Quadrant | BADHDUFLAG | Total packets | Discarded packets |
| A | 0 | 12 | 0 |
| B | 0 | 12 | 0 |
| C | 0 | 12 | 0 |
| D | 0 | 12 | 0 |
| Mode SS | |||
|---|---|---|---|
| Quadrant | BADHDUFLAG | Total packets | Discarded packets |
| A | 0 | 194 | 0 |
| B | 0 | 194 | 0 |
| C | 0 | 194 | 0 |
| D | 0 | 194 | 0 |
| Mode M0 | |||
|---|---|---|---|
| Quadrant | BADHDUFLAG | Total packets | Discarded packets |
| A | 0 | 19368 | 2 |
| B | 0 | 22716 | 2 |
| C | 0 | 20500 | 2 |
| D | 0 | 45141 | 2 |
| Quadrant | Total seconds | Saturated seconds | Saturation percentage |
|---|---|---|---|
| A | 9471 | 112 | 1.182557% |
| B | 9472 | 346 | 3.652872% |
| C | 9472 | 147 | 1.551943% |
| D | 9472 | 3177 | 33.540963% |
Noise dominated data is calculated using 1-second bins in cleaned event files. If a bin has >2000 counts, and if more than 50% of those come from <1% of pixels, then it is considered to be noise-dominated and hence unusable.
| Quadrant | # 1 sec bins | Bins with >0 counts | Bins with >2000 counts | High rate bins dominated by noise | Noise dominated (total time) | Noise dominated (detector-on time) | Marked lightcurve |
|---|---|---|---|---|---|---|---|
| A | 10711 | 9473 | 3 | 3 | 0.03% | 0.03% | 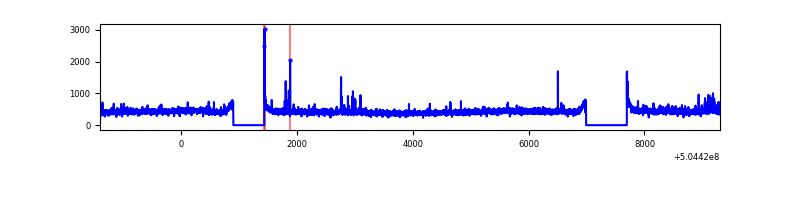 |
| B | 10712 | 9474 | 156 | 156 | 1.46% | 1.65% | 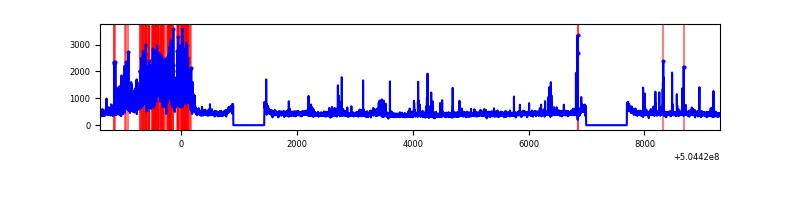 |
| C | 10712 | 9474 | 57 | 57 | 0.53% | 0.60% | 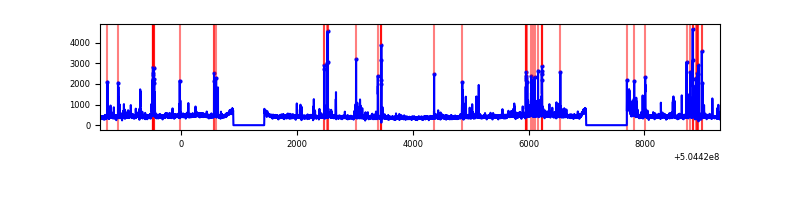 |
| D | 10712 | 9474 | 2648 | 2648 | 24.72% | 27.95% | 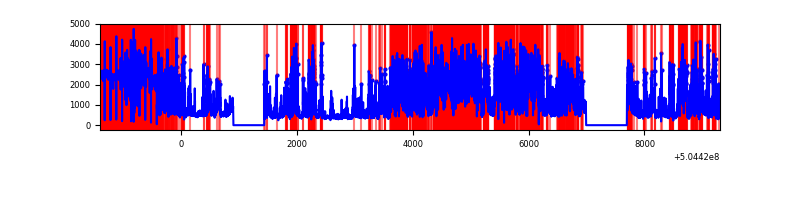 |
Top three noisy pixels from each quadrant. If the there are fewer than three noisy pixels in the level2.evt file, extra rows are filled as -1
| Pixel properties | Quadrant properties | ||||||
|---|---|---|---|---|---|---|---|
| Quadrant | DetID | PixID | Counts | Sigma | Mean | Median | Sigma |
| A | 4 | 159 | 46791 | 185.5 | 1006 | 980 | 247.0 |
| A | 12 | 115 | 43892 | 173.76 | 1006 | 980 | 247.0 |
| A | 4 | 3 | 35339 | 139.12 | 1006 | 980 | 247.0 |
| B | 12 | 32 | 1094399 | 5150.81 | 991 | 953 | 212.3 |
| B | 0 | 183 | 50165 | 231.82 | 991 | 953 | 212.3 |
| B | 5 | 185 | 46235 | 213.31 | 991 | 953 | 212.3 |
| C | 13 | 3 | 286669 | 1065.45 | 980 | 970 | 268.1 |
| C | 12 | 252 | 127319 | 471.19 | 980 | 970 | 268.1 |
| C | 9 | 38 | 86149 | 317.66 | 980 | 970 | 268.1 |
| D | 11 | 129 | 9090082 | 39223.71 | 813 | 778 | 231.7 |
| D | 8 | 160 | 166943 | 717.06 | 813 | 778 | 231.7 |
| D | 11 | 176 | 151332 | 649.7 | 813 | 778 | 231.7 |
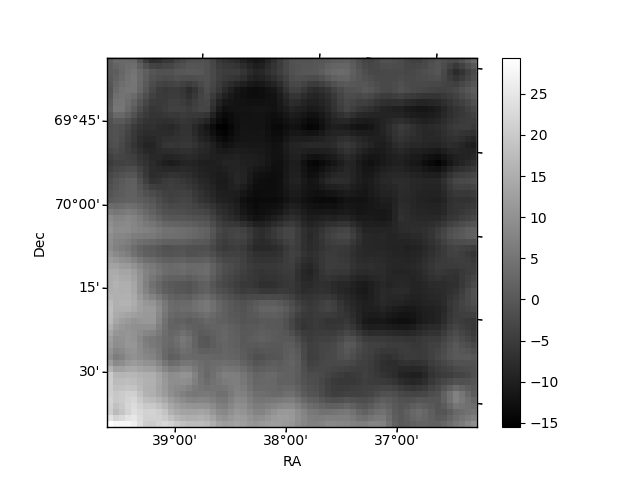
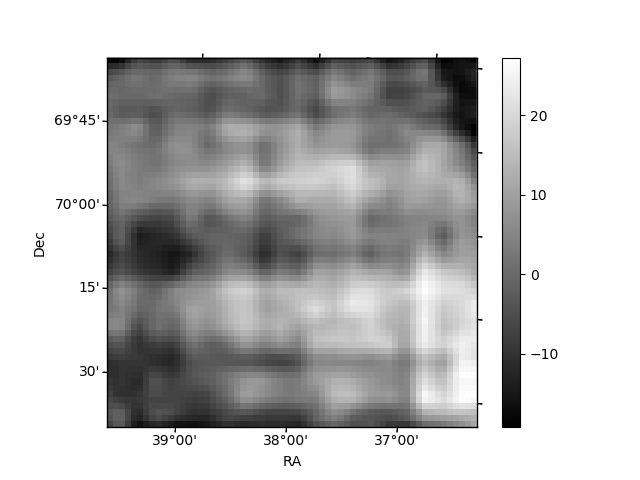
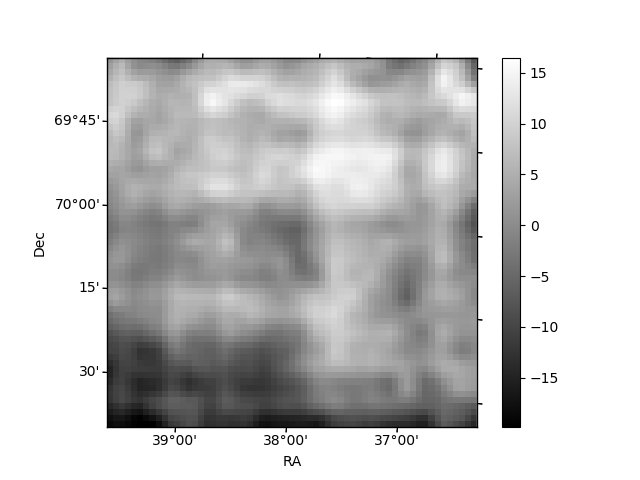
Histogram calculated using DETX and DETY for each event in the final _common_clean file
| Quadrant A | 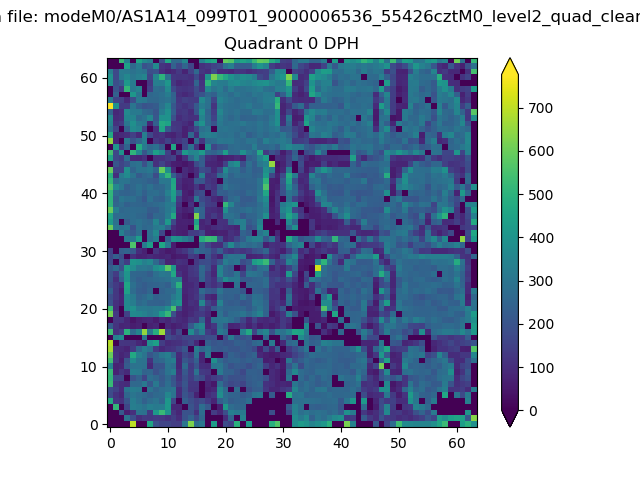 |
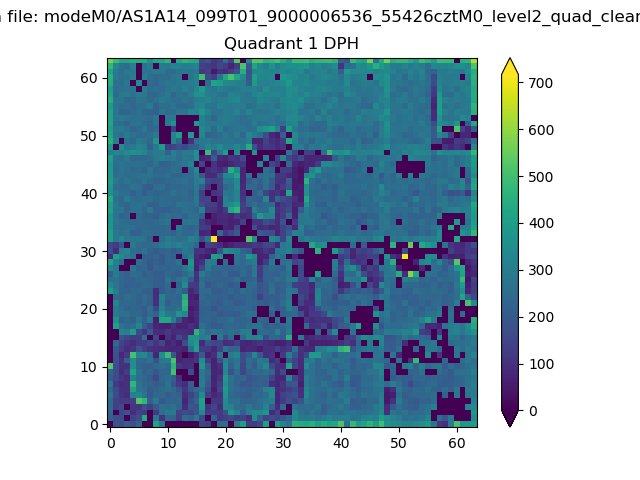 |
Quadrant B |
|---|---|---|---|
| Quadrant D | 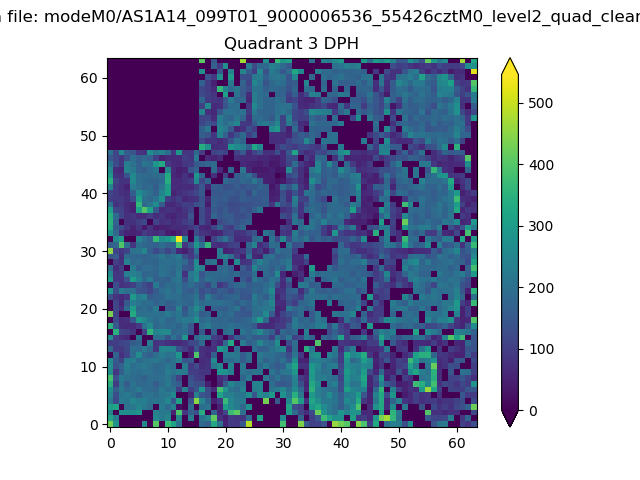 |
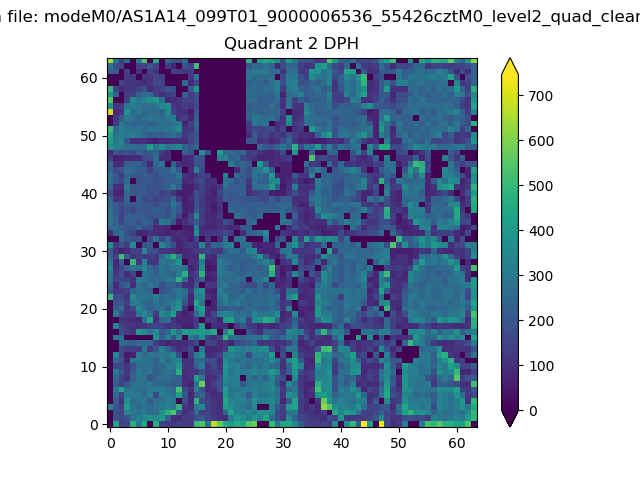 |
Quadrant C |
| Plot type | Count rate plots | Images |
|---|---|---|
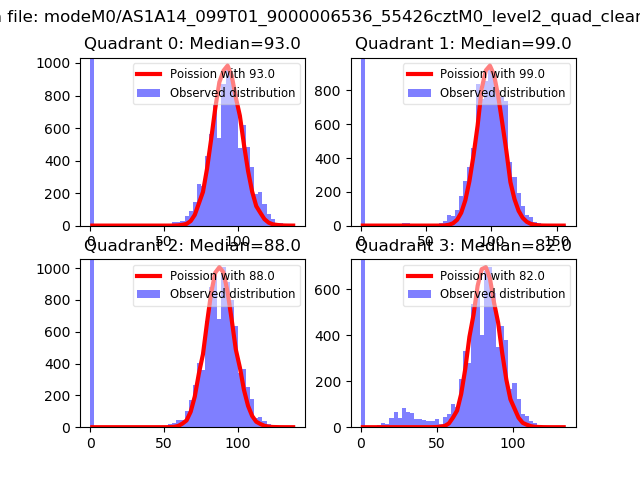
| Comparison with Poisson distribution Blue bars denote a histogram of data divided into 1 sec bins. Red curve is a Poisson curve with rate = median count rate of data. |
 |
 |
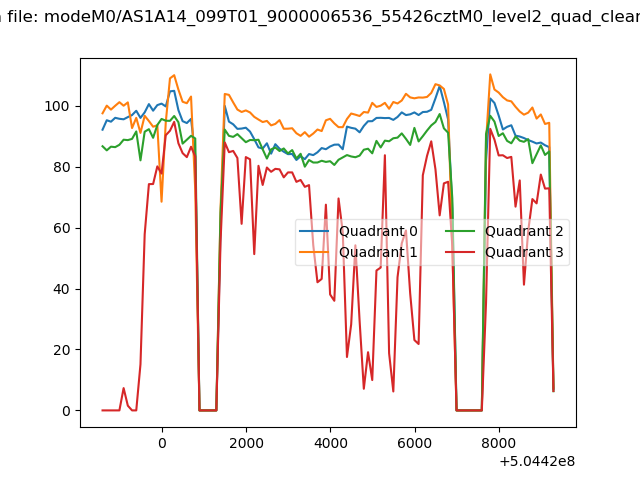
| Quadrant-wise count rates Data is divided into 100 sec bins |
 |
|
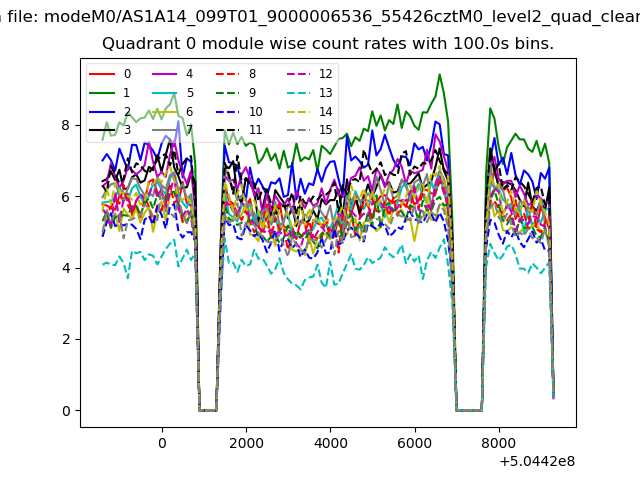
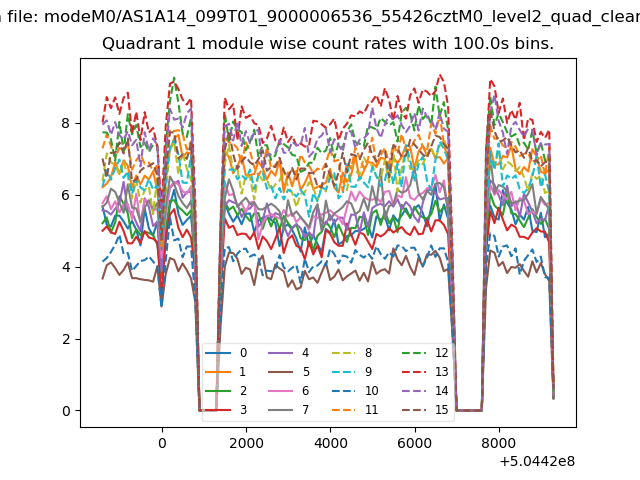
| Module-wise count rates for Quadrant A Data is divided into 100 sec bins |
 |
 |
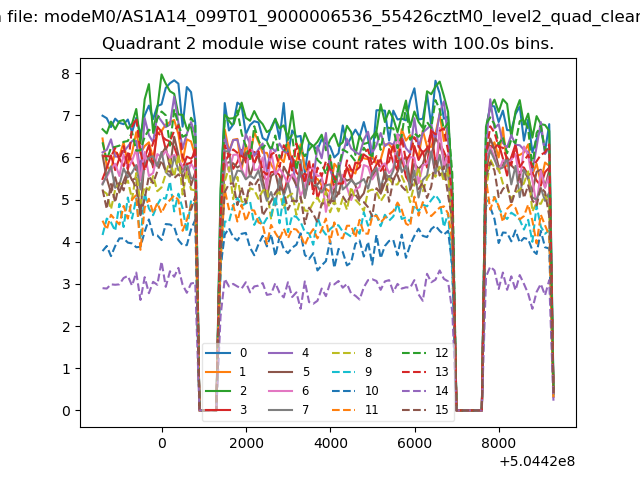
| Module-wise count rates for Quadrant B Data is divided into 100 sec bins |
 |
 |
| Module-wise count rates for Quadrant C Data is divided into 100 sec bins |
 |
 |
| Module-wise count rates for Quadrant D Data is divided into 100 sec bins |
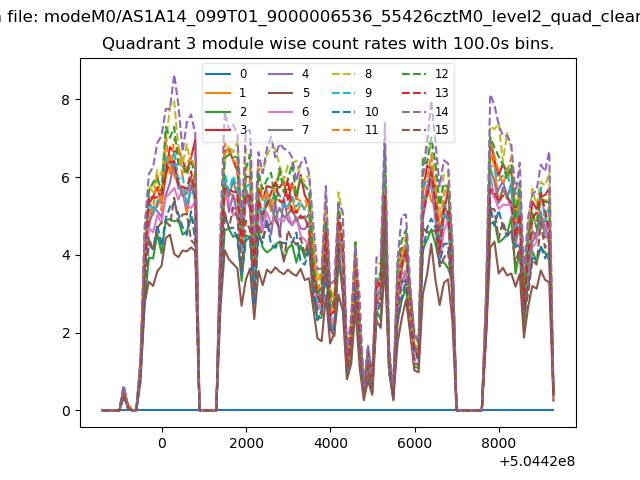 |
 |
| Parameter | Plot |
|---|---|
| CZT HV Monitor | 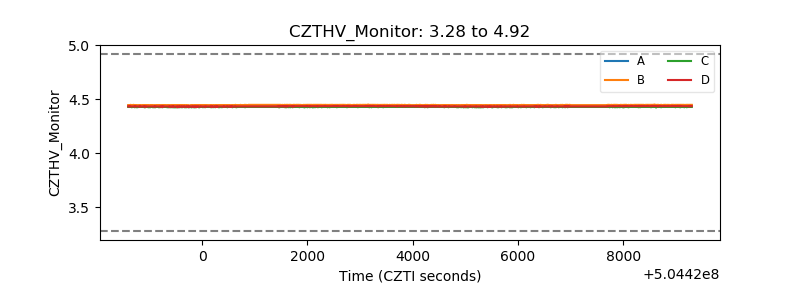 |
| D_VDD | 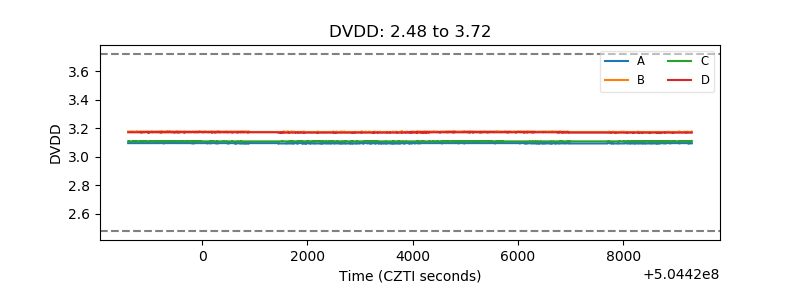 |
| Temperature 1 | 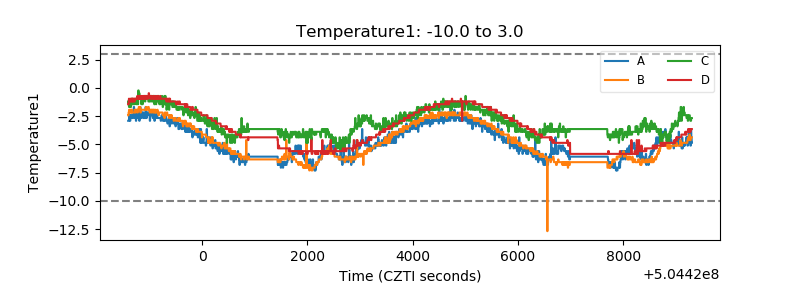 |
| Veto HV Monitor | 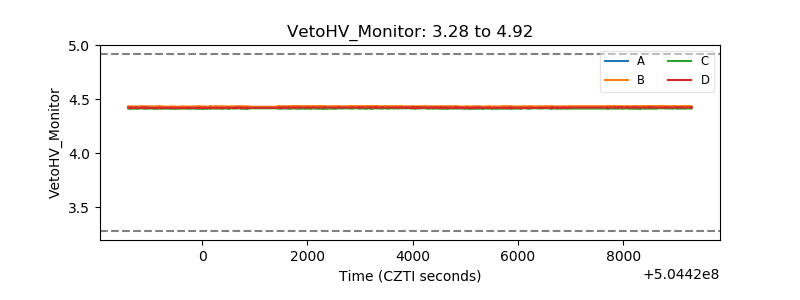 |
| Veto LLD | 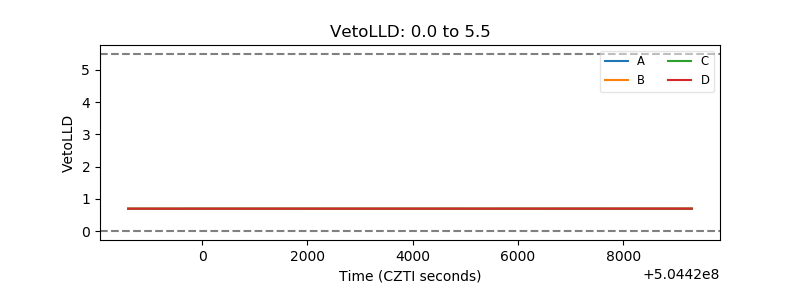 |
| Alpha Counter | 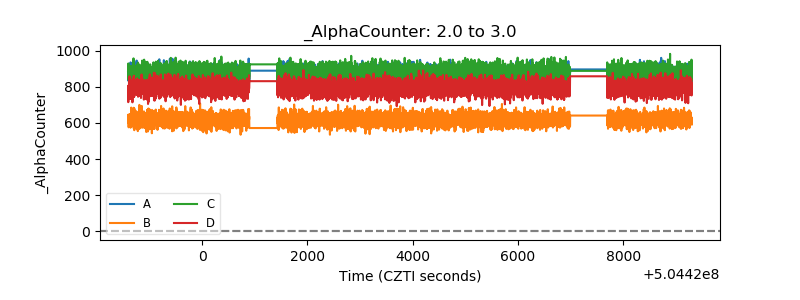 |
| _CPM_Rate | 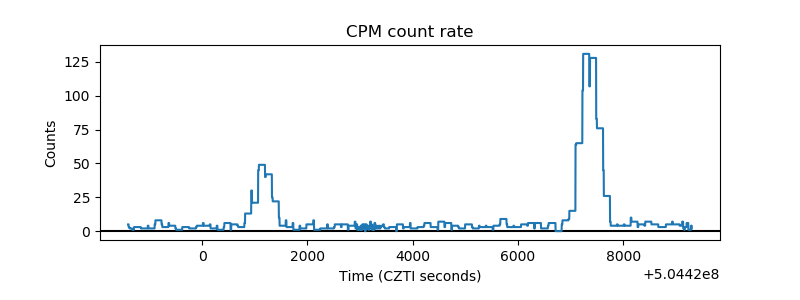 |
| CZT Counter | 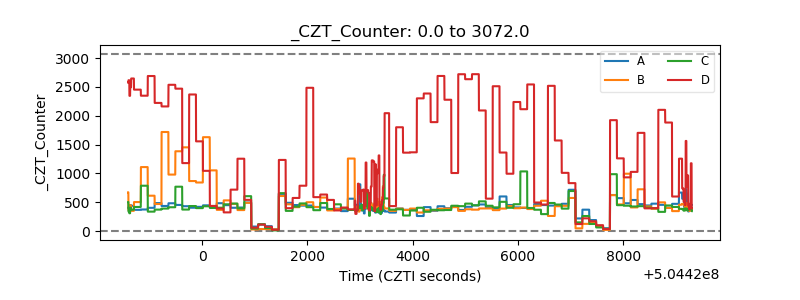 |
| +2.5 Volts monitor |  |
| +5 Volts monitor | 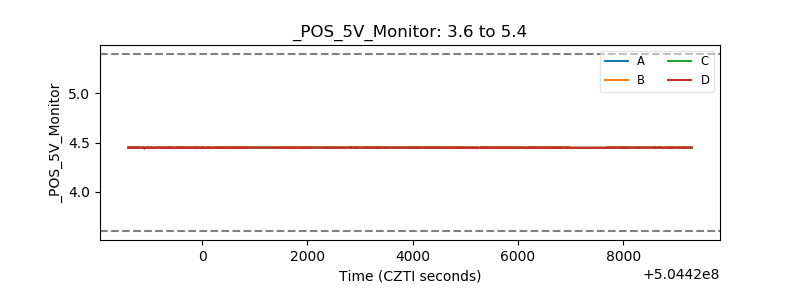 |
| _ROLL_ROT | 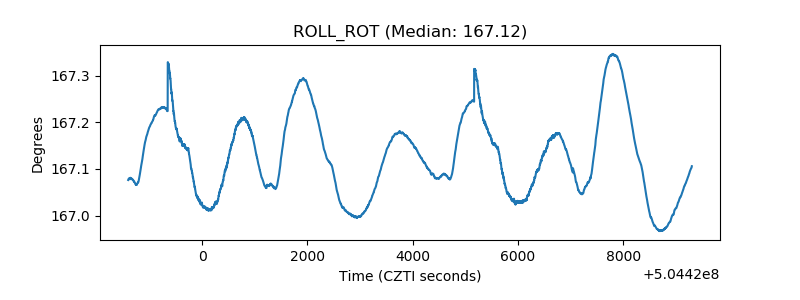 |
| _Roll_DEC | 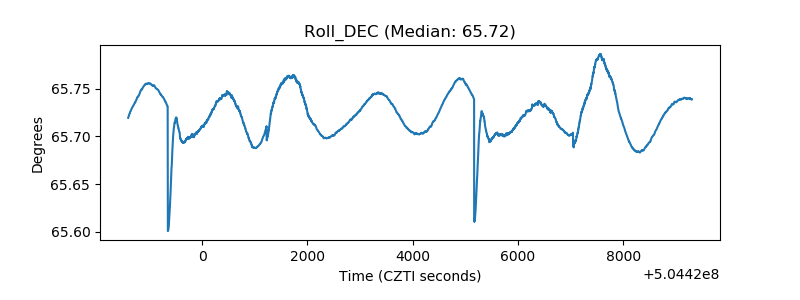 |
| _Roll_RA | 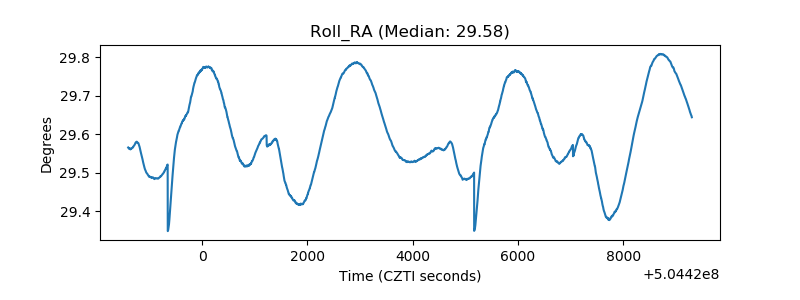 |
| Veto Counter | 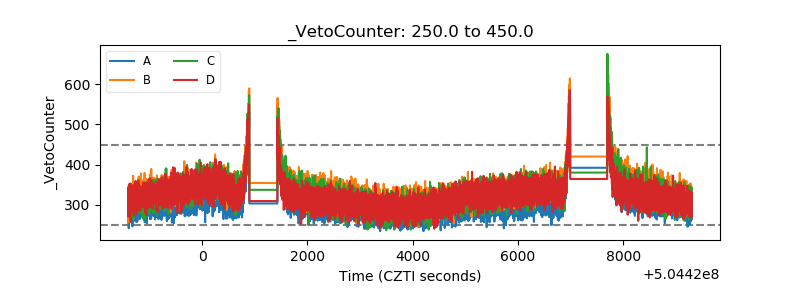 |