| Param | Original file | Final file |
|---|---|---|
| Filename | modeM0/AS1A14_099T01_9000006536_55427cztM0_level2.fits | modeM0/AS1A14_099T01_9000006536_55427cztM0_level2_quad_clean.evt |
| Size (bytes) | 515,940,480 | 94,426,560 |
| Size | 492.0 MB | 90.1 MB |
| Events in quadrant A | 3,272,978 | 642,433 |
| Events in quadrant B | 3,045,614 | 691,262 |
| Events in quadrant C | 3,271,607 | 611,062 |
| Events in quadrant D | 8,968,199 | 430,540 |
| Mode M9 | |||
|---|---|---|---|
| Quadrant | BADHDUFLAG | Total packets | Discarded packets |
| A | 0 | 16 | 0 |
| B | 0 | 16 | 0 |
| C | 0 | 16 | 0 |
| D | 0 | 16 | 0 |
| Mode SS | |||
|---|---|---|---|
| Quadrant | BADHDUFLAG | Total packets | Discarded packets |
| A | 0 | 144 | 0 |
| B | 0 | 144 | 0 |
| C | 0 | 144 | 0 |
| D | 0 | 144 | 0 |
| Mode M0 | |||
|---|---|---|---|
| Quadrant | BADHDUFLAG | Total packets | Discarded packets |
| A | 0 | 14823 | 2 |
| B | 0 | 14429 | 2 |
| C | 0 | 15200 | 2 |
| D | 0 | 31451 | 2 |
| Quadrant | Total seconds | Saturated seconds | Saturation percentage |
|---|---|---|---|
| A | 6939 | 149 | 2.147283% |
| B | 6940 | 152 | 2.190202% |
| C | 6940 | 163 | 2.348703% |
| D | 6940 | 2007 | 28.919308% |
Noise dominated data is calculated using 1-second bins in cleaned event files. If a bin has >2000 counts, and if more than 50% of those come from <1% of pixels, then it is considered to be noise-dominated and hence unusable.
| Quadrant | # 1 sec bins | Bins with >0 counts | Bins with >2000 counts | High rate bins dominated by noise | Noise dominated (total time) | Noise dominated (detector-on time) | Marked lightcurve |
|---|---|---|---|---|---|---|---|
| A | 8554 | 6941 | 24 | 24 | 0.28% | 0.35% | 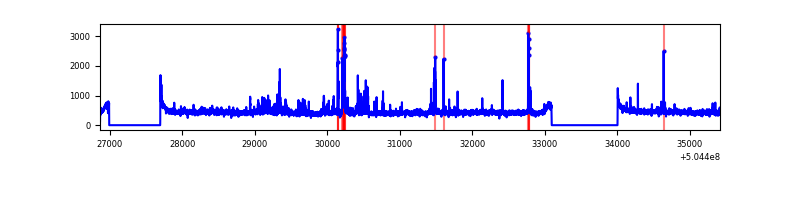 |
| B | 8555 | 6942 | 4 | 4 | 0.05% | 0.06% | 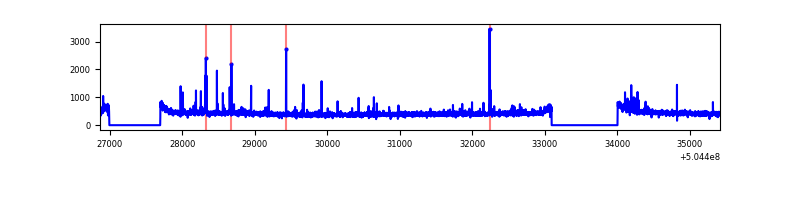 |
| C | 8555 | 6942 | 57 | 57 | 0.67% | 0.82% | 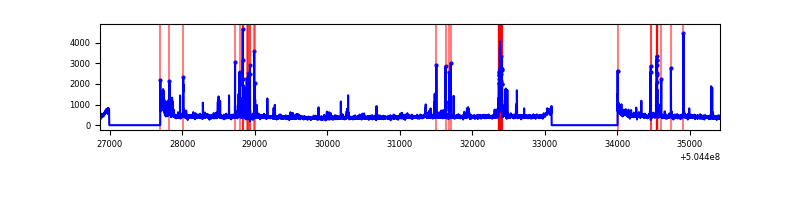 |
| D | 8555 | 6942 | 1609 | 1609 | 18.81% | 23.18% | 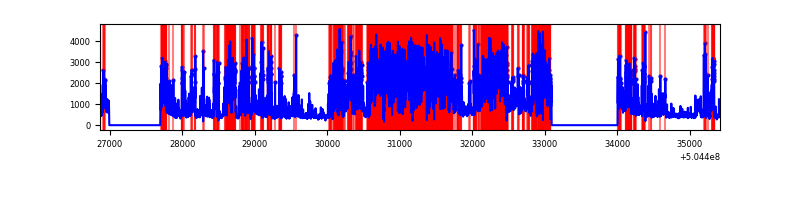 |
Top three noisy pixels from each quadrant. If the there are fewer than three noisy pixels in the level2.evt file, extra rows are filled as -1
| Pixel properties | Quadrant properties | ||||||
|---|---|---|---|---|---|---|---|
| Quadrant | DetID | PixID | Counts | Sigma | Mean | Median | Sigma |
| A | 4 | 159 | 119620 | 652.33 | 742 | 723 | 182.3 |
| A | 3 | 78 | 118214 | 644.61 | 742 | 723 | 182.3 |
| A | 0 | 8 | 82989 | 451.35 | 742 | 723 | 182.3 |
| B | 10 | 247 | 38399 | 240.92 | 733 | 705 | 156.5 |
| B | 0 | 199 | 34806 | 217.96 | 733 | 705 | 156.5 |
| B | 12 | 111 | 19612 | 120.85 | 733 | 705 | 156.5 |
| C | 13 | 3 | 322713 | 1645.67 | 714 | 706 | 195.7 |
| C | 12 | 252 | 71379 | 361.19 | 714 | 706 | 195.7 |
| C | 10 | 19 | 48338 | 243.43 | 714 | 706 | 195.7 |
| D | 11 | 129 | 6060438 | 34562.12 | 623 | 596 | 175.3 |
| D | 2 | 249 | 154760 | 879.27 | 623 | 596 | 175.3 |
| D | 10 | 181 | 50953 | 287.21 | 623 | 596 | 175.3 |
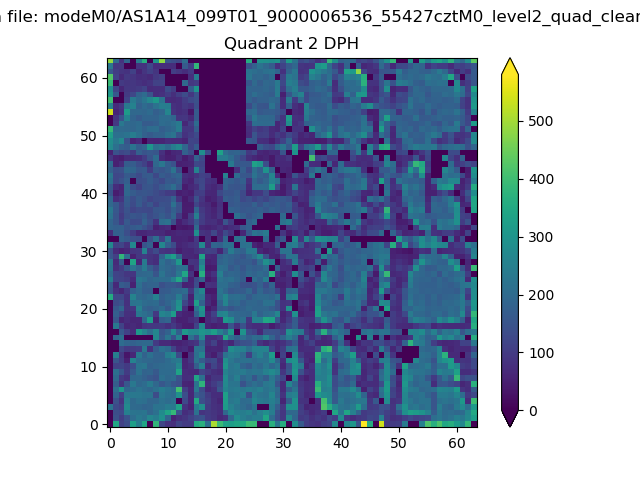
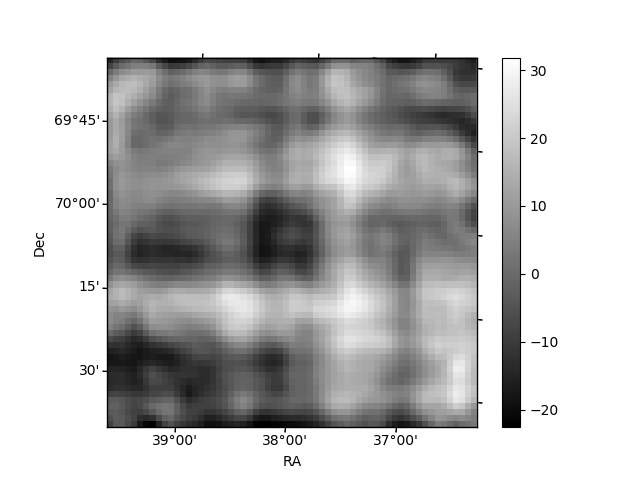
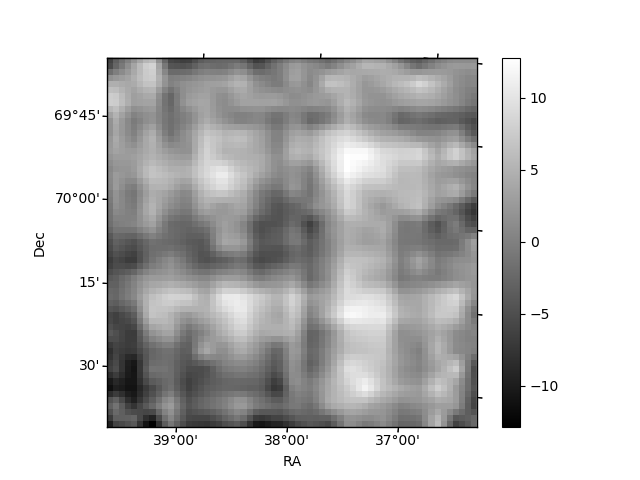
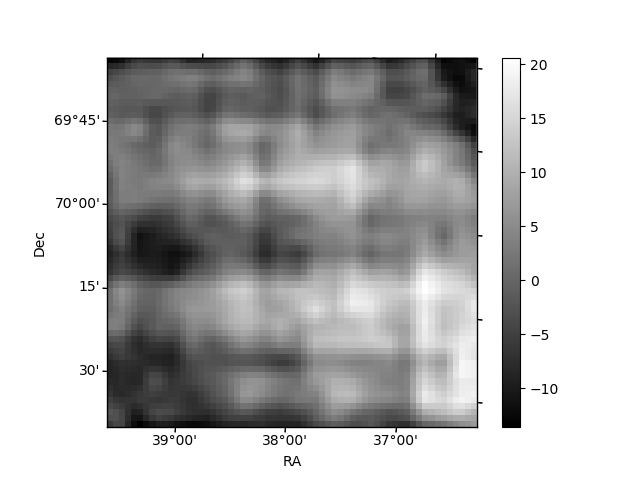
Histogram calculated using DETX and DETY for each event in the final _common_clean file
| Quadrant A | 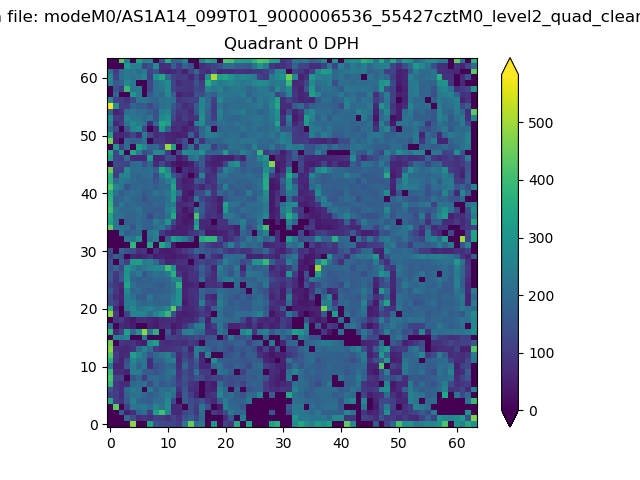 |
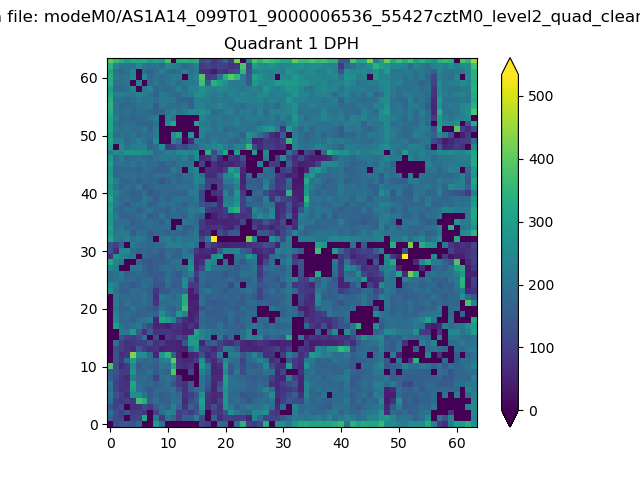 |
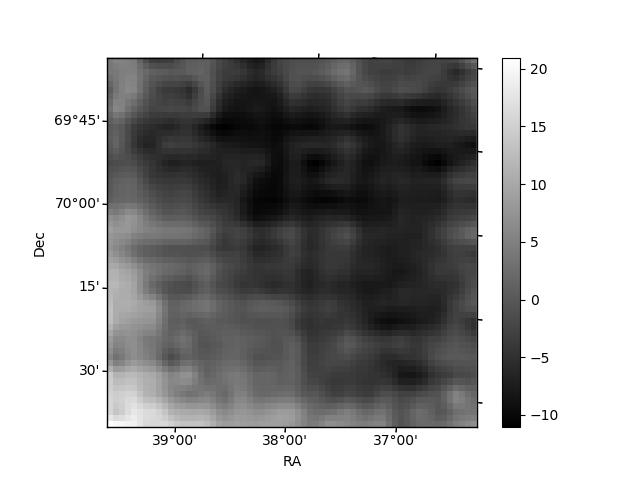
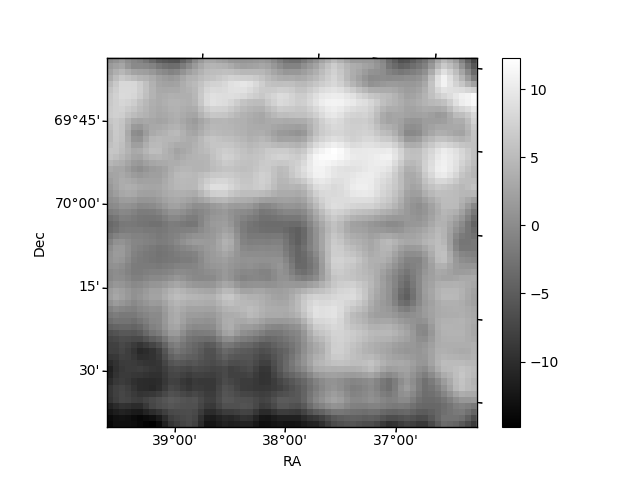
Quadrant B |
|---|---|---|---|
| Quadrant D | 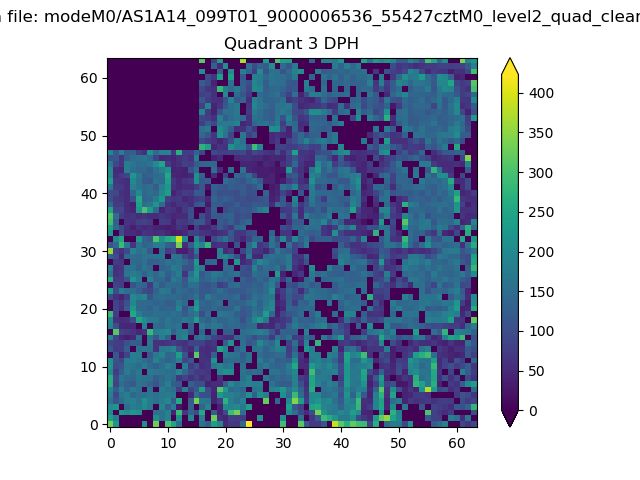 |
 |
Quadrant C |
| Plot type | Count rate plots | Images |
|---|---|---|
| Comparison with Poisson distribution Blue bars denote a histogram of data divided into 1 sec bins. Red curve is a Poisson curve with rate = median count rate of data. |
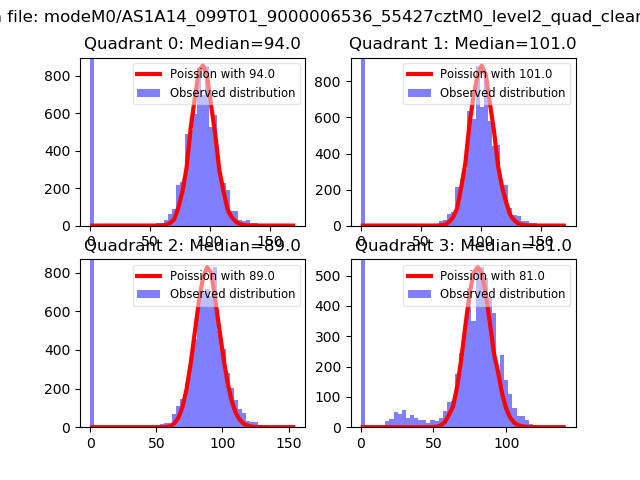 |
 |
| Quadrant-wise count rates Data is divided into 100 sec bins |
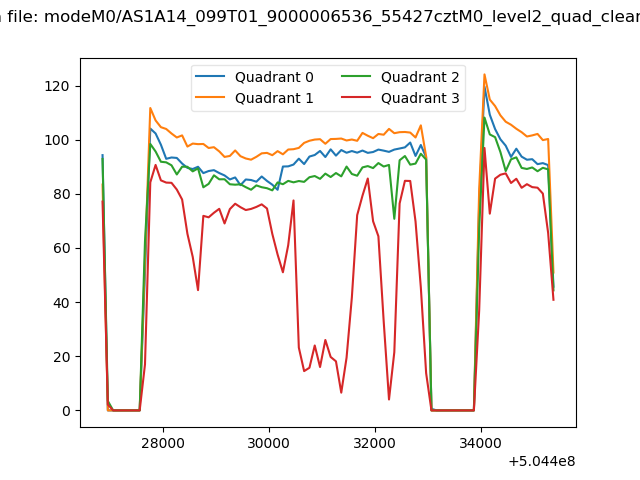 |
|
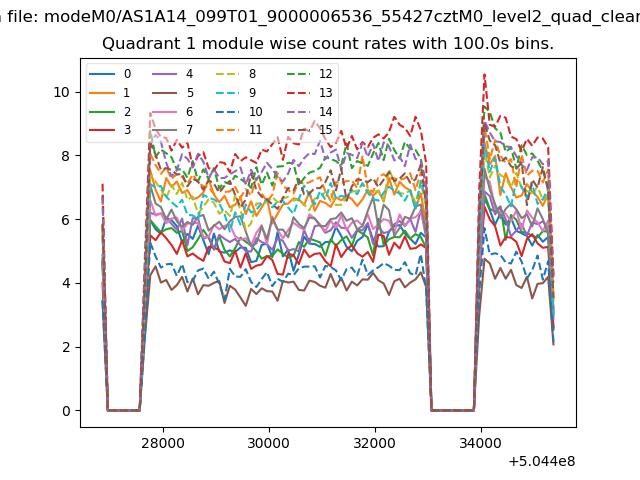
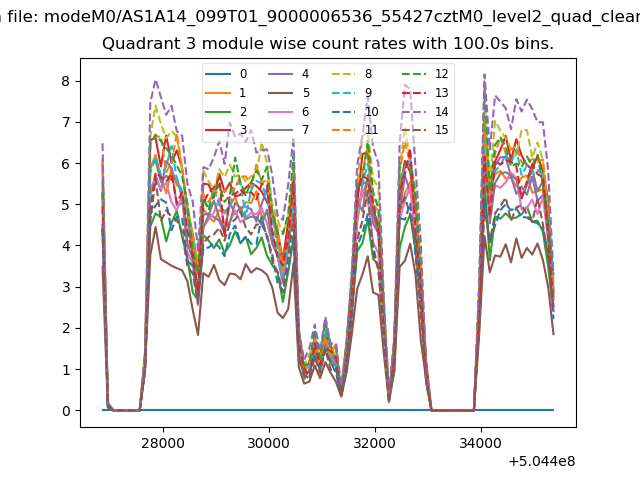
| Module-wise count rates for Quadrant A Data is divided into 100 sec bins |
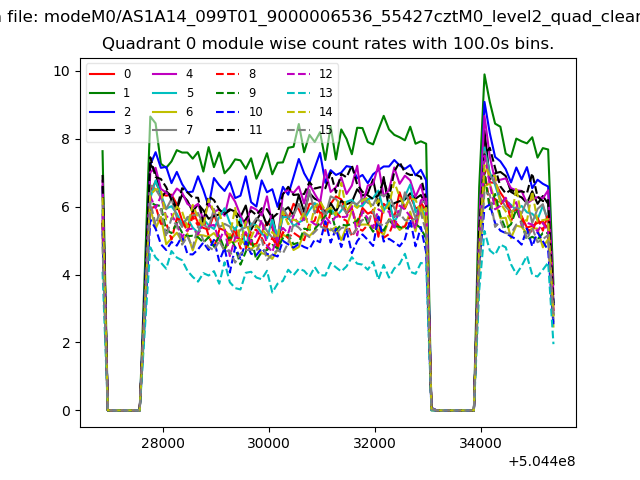 |
 |
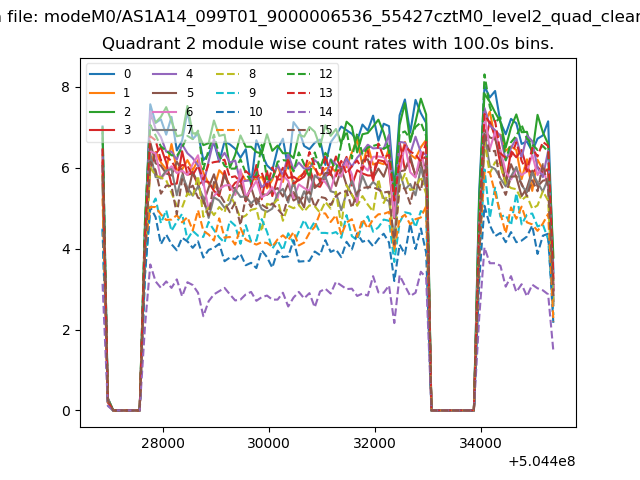
| Module-wise count rates for Quadrant B Data is divided into 100 sec bins |
 |
 |
| Module-wise count rates for Quadrant C Data is divided into 100 sec bins |
 |
 |
| Module-wise count rates for Quadrant D Data is divided into 100 sec bins |
 |
 |
| Parameter | Plot |
|---|---|
| CZT HV Monitor | 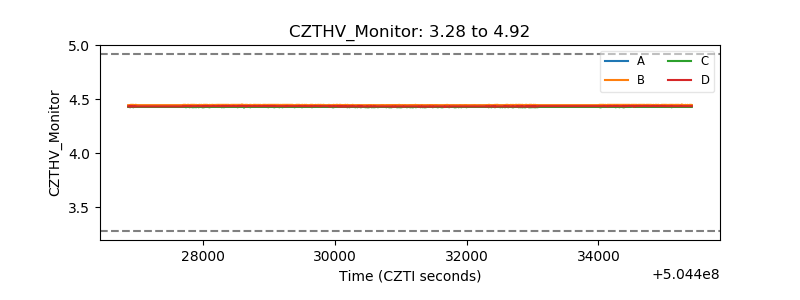 |
| D_VDD | 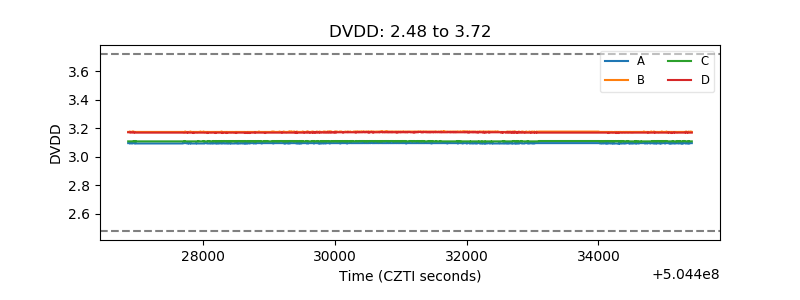 |
| Temperature 1 | 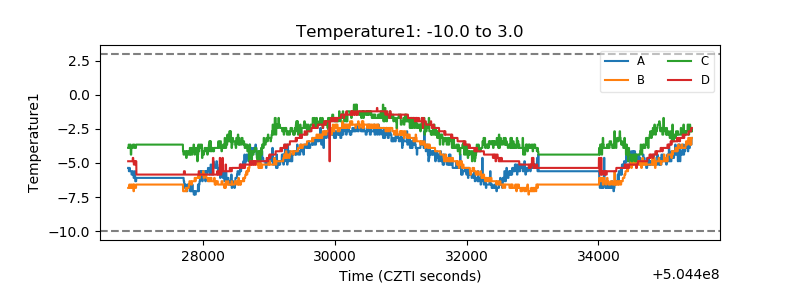 |
| Veto HV Monitor | 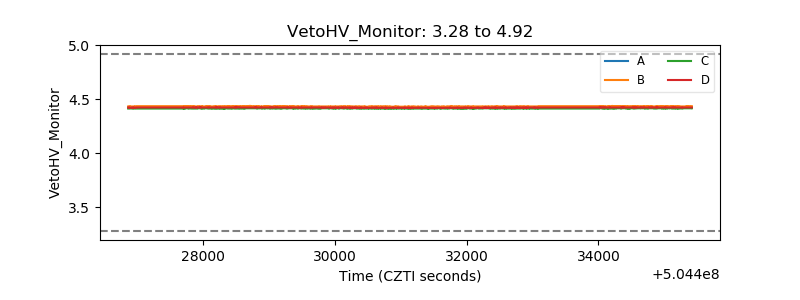 |
| Veto LLD | 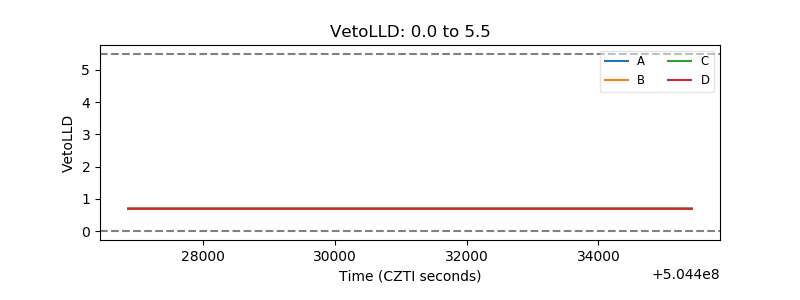 |
| Alpha Counter | 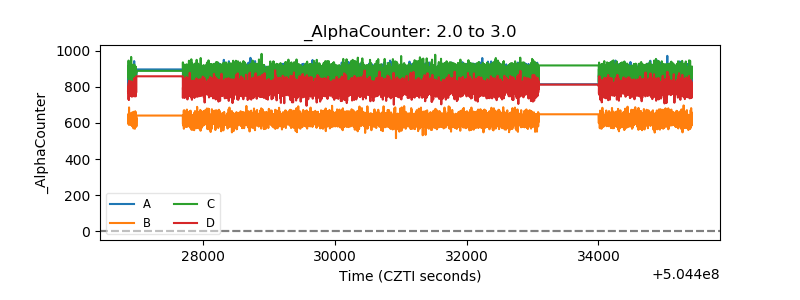 |
| _CPM_Rate | 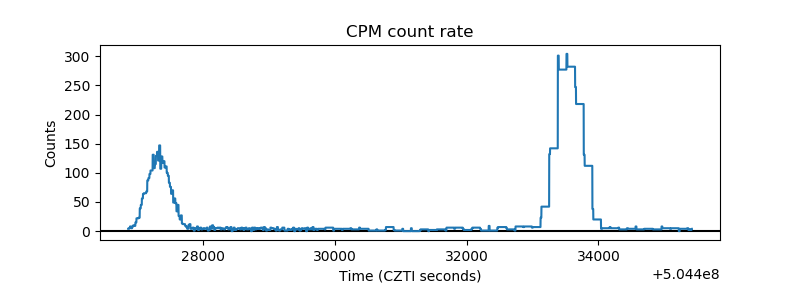 |
| CZT Counter | 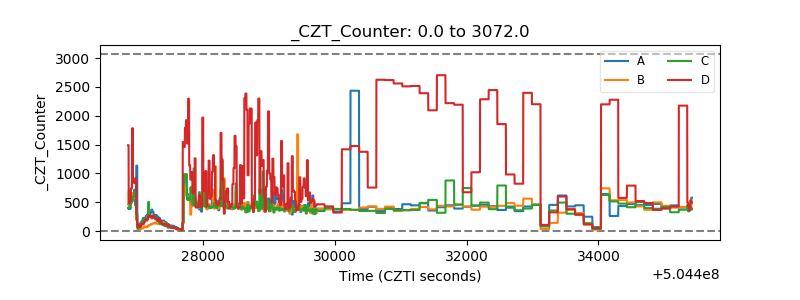 |
| +2.5 Volts monitor |  |
| +5 Volts monitor |  |
| _ROLL_ROT | 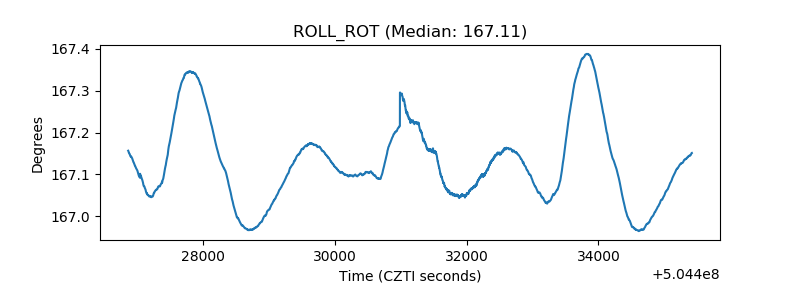 |
| _Roll_DEC | 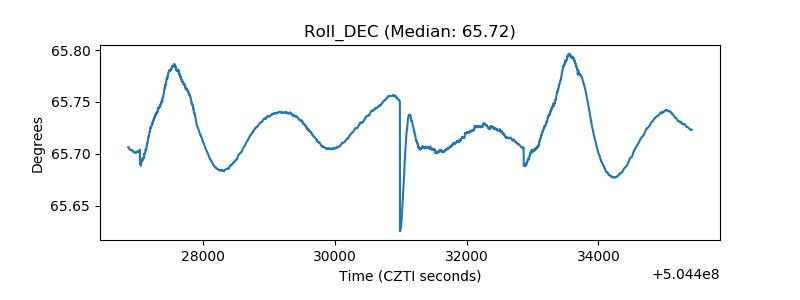 |
| _Roll_RA | 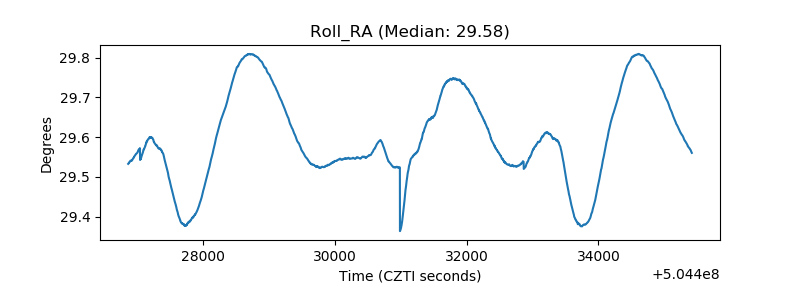 |
| Veto Counter | 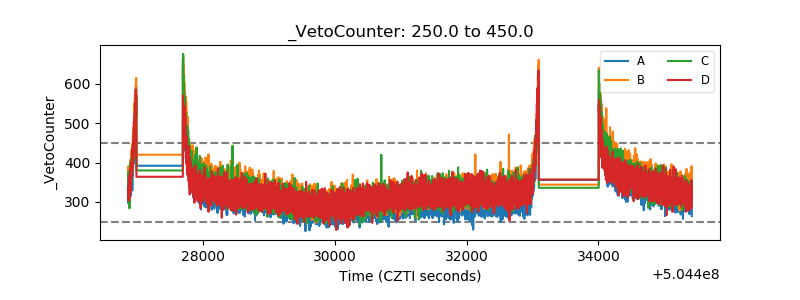 |