| Param | Original file | Final file |
|---|---|---|
| Filename | modeM0/AS1A14_099T01_9000006536_55429cztM0_level2.fits | modeM0/AS1A14_099T01_9000006536_55429cztM0_level2_quad_clean.evt |
| Size (bytes) | 569,499,840 | 92,145,600 |
| Size | 543.1 MB | 87.9 MB |
| Events in quadrant A | 4,324,728 | 626,641 |
| Events in quadrant B | 3,082,270 | 688,317 |
| Events in quadrant C | 3,119,134 | 611,469 |
| Events in quadrant D | 10,032,701 | 394,941 |
| Mode M9 | |||
|---|---|---|---|
| Quadrant | BADHDUFLAG | Total packets | Discarded packets |
| A | 0 | 19 | 0 |
| B | 0 | 19 | 0 |
| C | 0 | 19 | 0 |
| D | 0 | 19 | 0 |
| Mode SS | |||
|---|---|---|---|
| Quadrant | BADHDUFLAG | Total packets | Discarded packets |
| A | 0 | 140 | 0 |
| B | 0 | 140 | 0 |
| C | 0 | 140 | 0 |
| D | 0 | 140 | 0 |
| Mode M0 | |||
|---|---|---|---|
| Quadrant | BADHDUFLAG | Total packets | Discarded packets |
| A | 0 | 17615 | 2 |
| B | 0 | 14326 | 2 |
| C | 0 | 14414 | 2 |
| D | 0 | 34384 | 2 |
| Quadrant | Total seconds | Saturated seconds | Saturation percentage |
|---|---|---|---|
| A | 6717 | 340 | 5.061784% |
| B | 6718 | 145 | 2.158380% |
| C | 6718 | 100 | 1.488538% |
| D | 6718 | 2443 | 36.364990% |
Noise dominated data is calculated using 1-second bins in cleaned event files. If a bin has >2000 counts, and if more than 50% of those come from <1% of pixels, then it is considered to be noise-dominated and hence unusable.
| Quadrant | # 1 sec bins | Bins with >0 counts | Bins with >2000 counts | High rate bins dominated by noise | Noise dominated (total time) | Noise dominated (detector-on time) | Marked lightcurve |
|---|---|---|---|---|---|---|---|
| A | 8657 | 6719 | 206 | 206 | 2.38% | 3.07% | 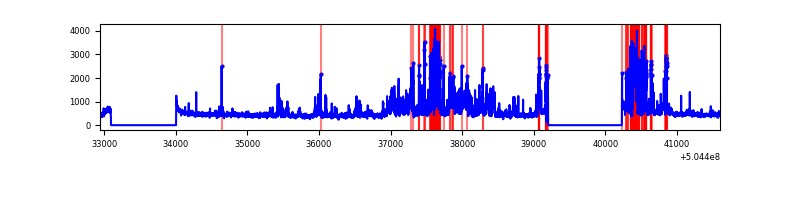 |
| B | 8658 | 6720 | 5 | 5 | 0.06% | 0.07% | 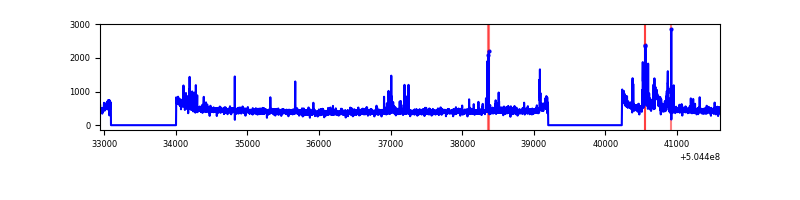 |
| C | 8658 | 6720 | 27 | 27 | 0.31% | 0.40% | 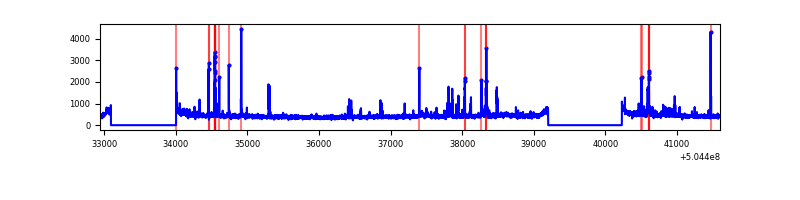 |
| D | 8658 | 6720 | 2002 | 2002 | 23.12% | 29.79% | 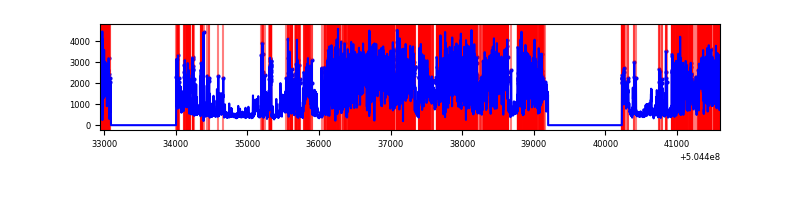 |
Top three noisy pixels from each quadrant. If the there are fewer than three noisy pixels in the level2.evt file, extra rows are filled as -1
| Pixel properties | Quadrant properties | ||||||
|---|---|---|---|---|---|---|---|
| Quadrant | DetID | PixID | Counts | Sigma | Mean | Median | Sigma |
| A | 3 | 78 | 589404 | 3334.89 | 714 | 696 | 176.5 |
| A | 4 | 159 | 547920 | 3099.89 | 714 | 696 | 176.5 |
| A | 0 | 8 | 292033 | 1650.35 | 714 | 696 | 176.5 |
| B | 9 | 251 | 106842 | 683.5 | 718 | 690 | 155.3 |
| B | 10 | 247 | 40733 | 257.83 | 718 | 690 | 155.3 |
| B | 0 | 199 | 38708 | 244.79 | 718 | 690 | 155.3 |
| C | 12 | 252 | 102787 | 533.31 | 702 | 697 | 191.4 |
| C | 10 | 64 | 86593 | 448.71 | 702 | 697 | 191.4 |
| C | 9 | 38 | 49760 | 256.3 | 702 | 697 | 191.4 |
| D | 11 | 129 | 7079283 | 42220.24 | 595 | 567 | 167.7 |
| D | 2 | 249 | 226154 | 1345.49 | 595 | 567 | 167.7 |
| D | 3 | 12 | 174220 | 1035.73 | 595 | 567 | 167.7 |
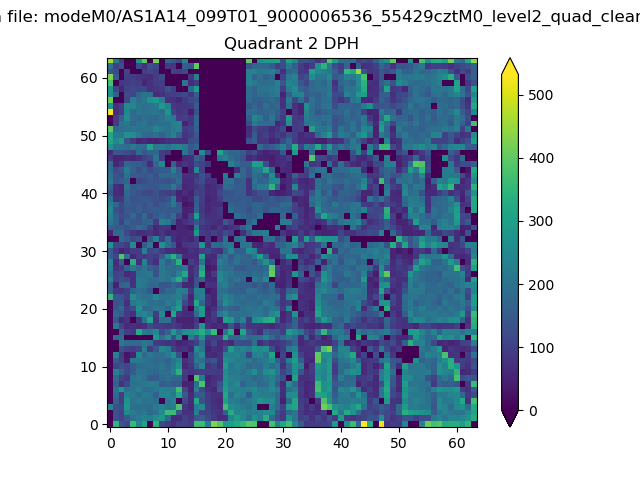
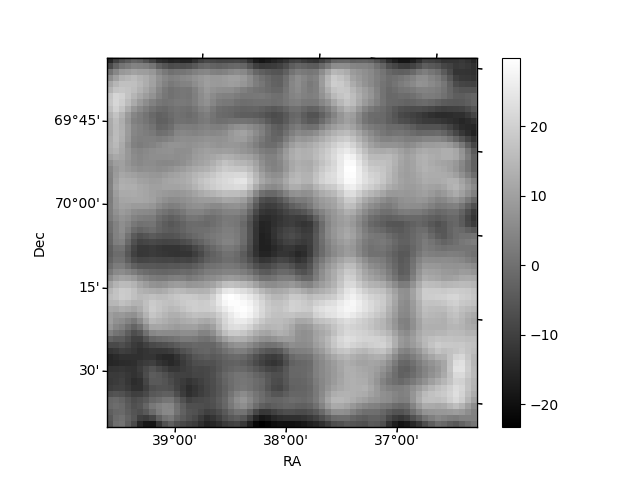
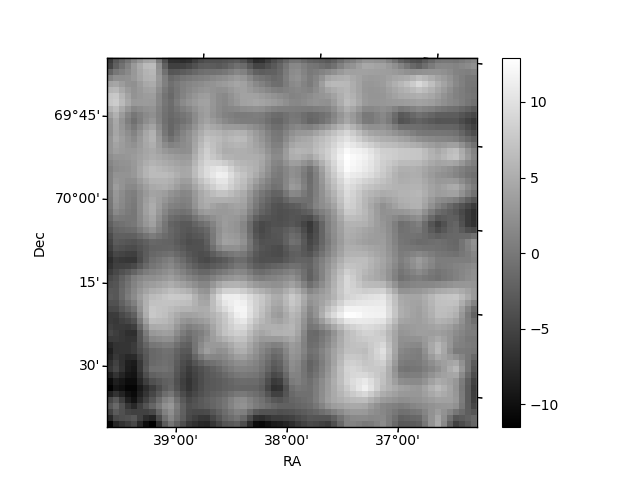
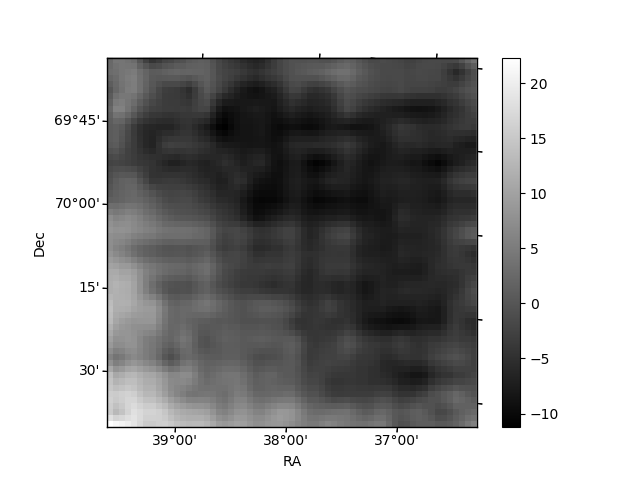
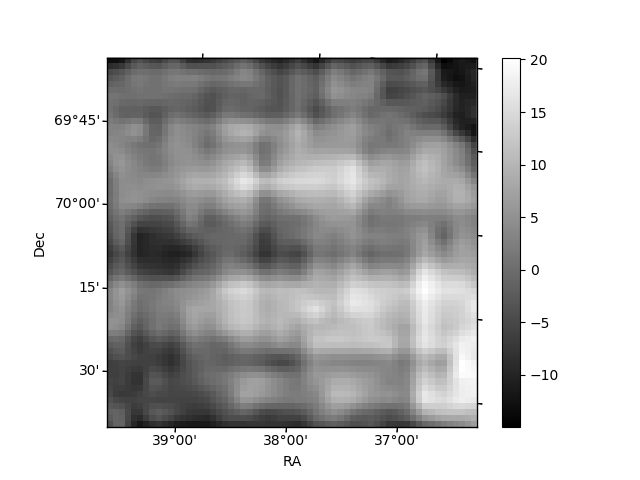
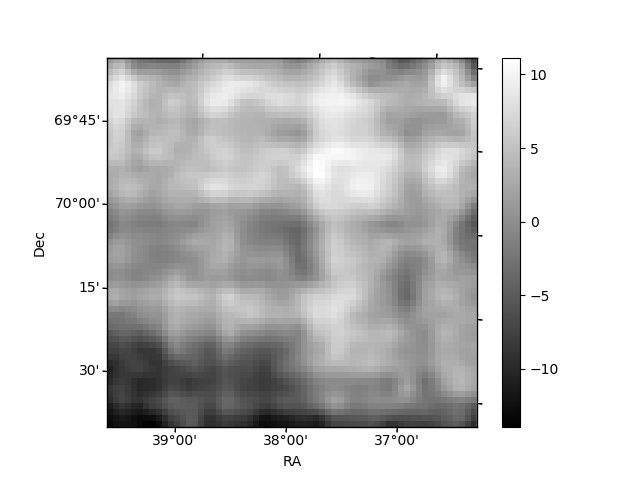
Histogram calculated using DETX and DETY for each event in the final _common_clean file
| Quadrant A | 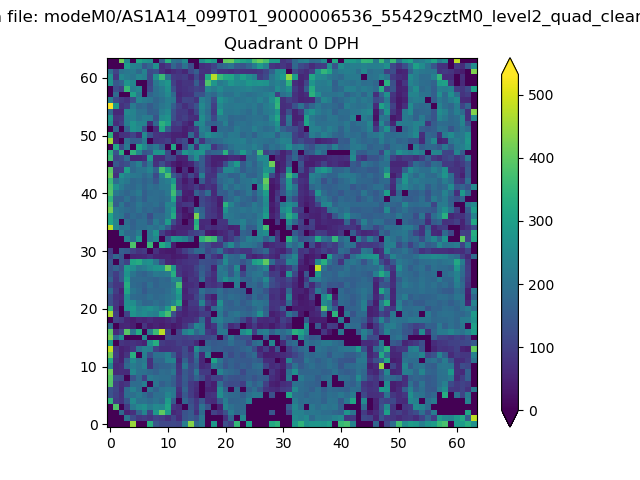 |
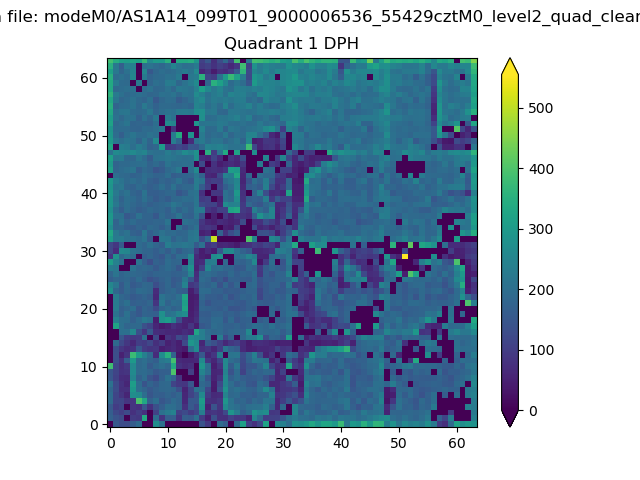 |
Quadrant B |
|---|---|---|---|
| Quadrant D | 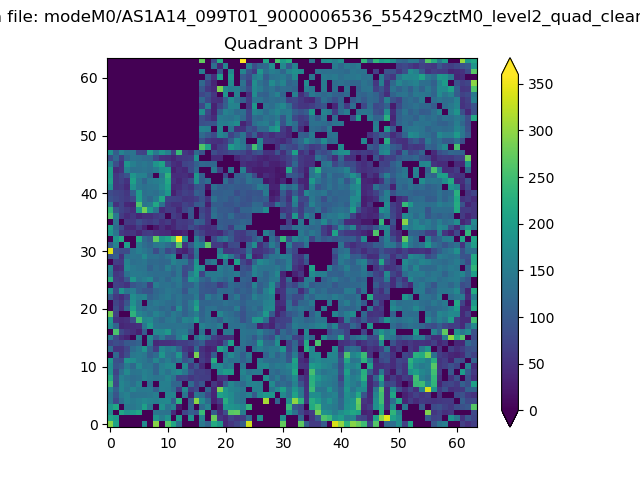 |
 |
Quadrant C |
| Plot type | Count rate plots | Images |
|---|---|---|
| Comparison with Poisson distribution Blue bars denote a histogram of data divided into 1 sec bins. Red curve is a Poisson curve with rate = median count rate of data. |
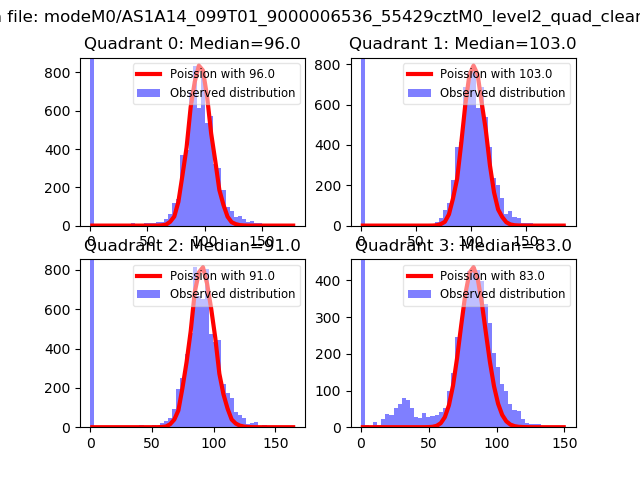 |
 |
| Quadrant-wise count rates Data is divided into 100 sec bins |
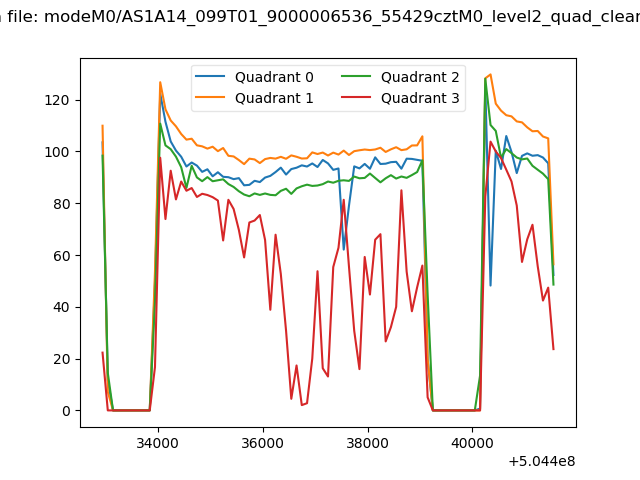 |
|
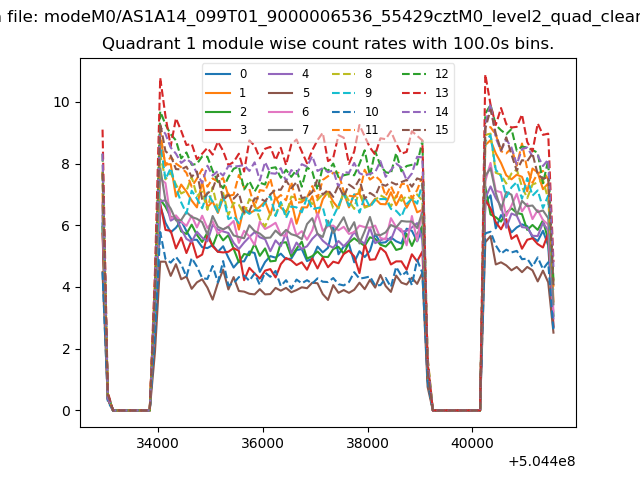
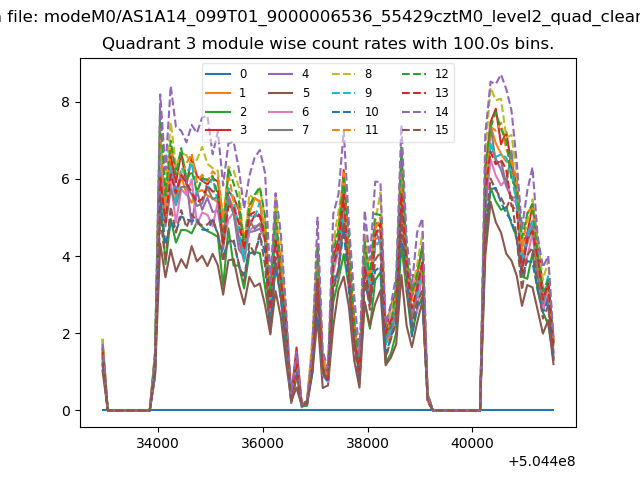
| Module-wise count rates for Quadrant A Data is divided into 100 sec bins |
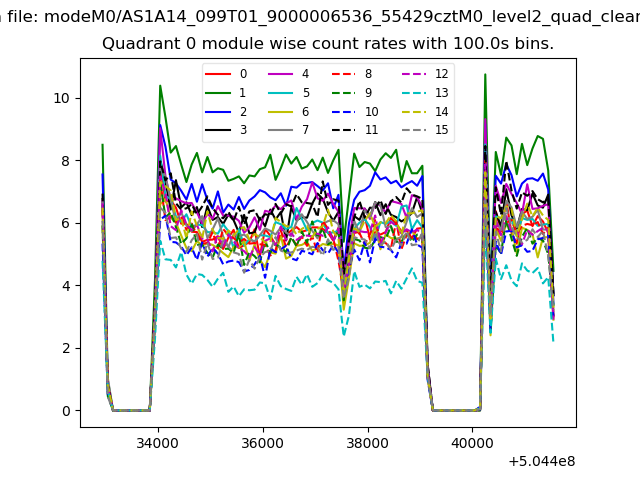 |
 |
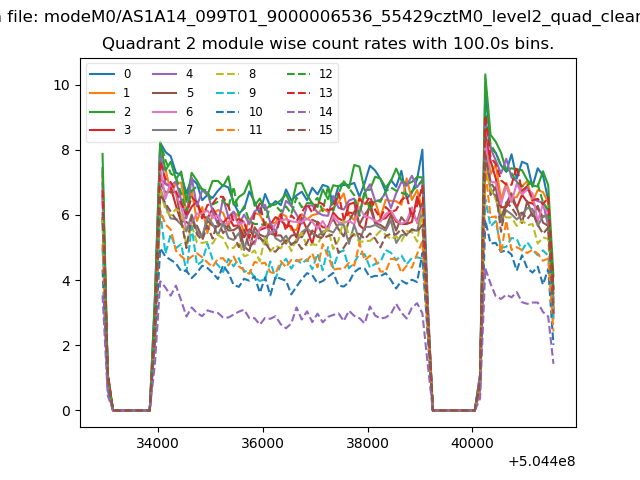
| Module-wise count rates for Quadrant B Data is divided into 100 sec bins |
 |
 |
| Module-wise count rates for Quadrant C Data is divided into 100 sec bins |
 |
 |
| Module-wise count rates for Quadrant D Data is divided into 100 sec bins |
 |
 |
| Parameter | Plot |
|---|---|
| CZT HV Monitor | 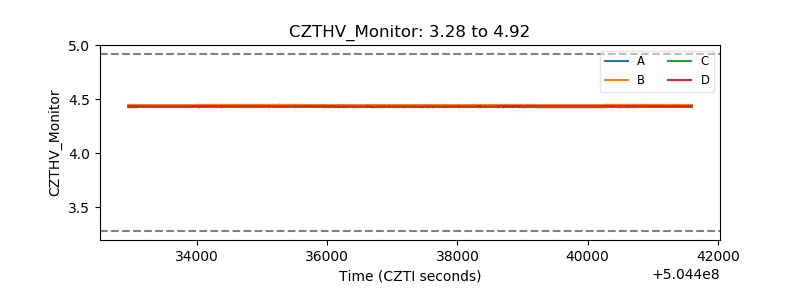 |
| D_VDD | 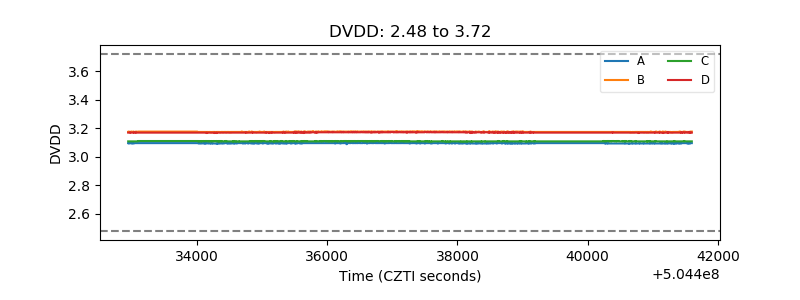 |
| Temperature 1 | 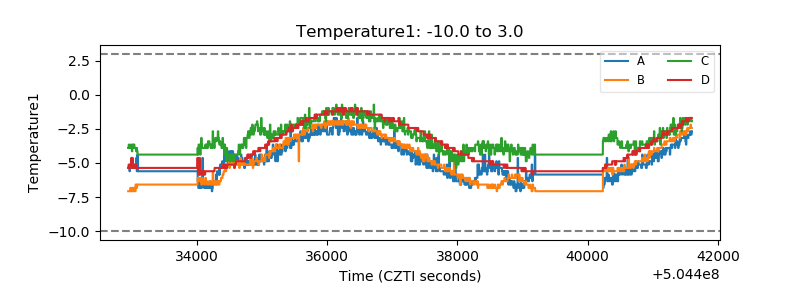 |
| Veto HV Monitor | 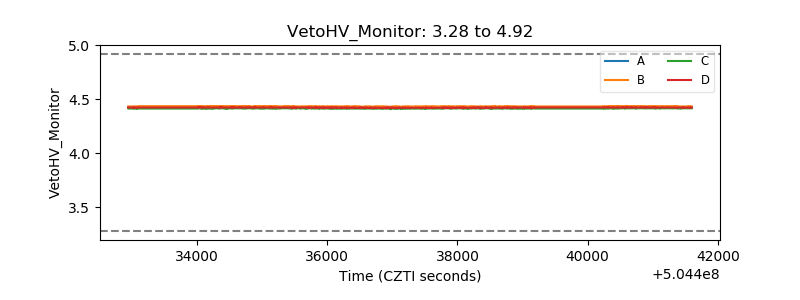 |
| Veto LLD | 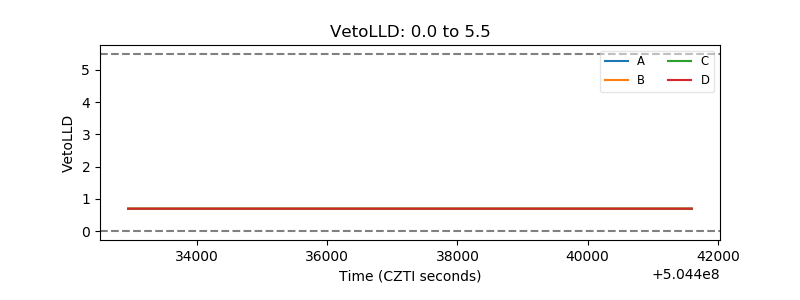 |
| Alpha Counter | 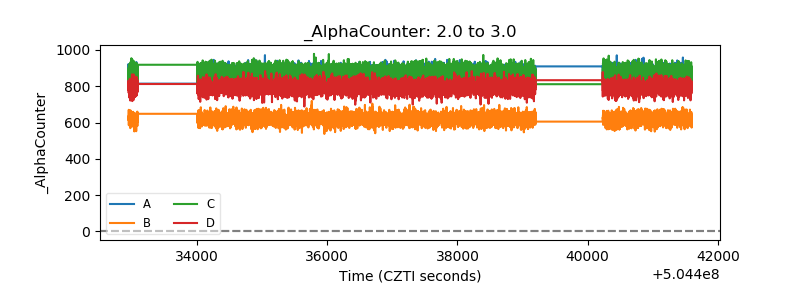 |
| _CPM_Rate | 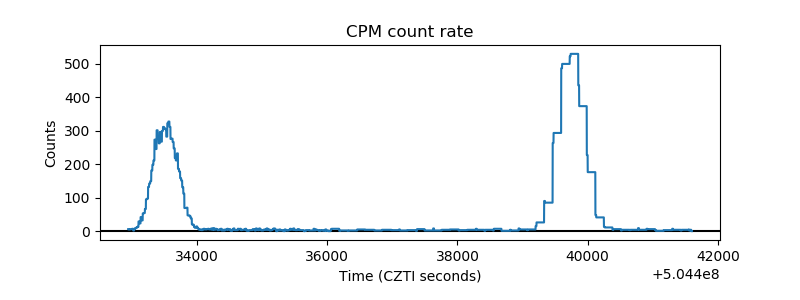 |
| CZT Counter | 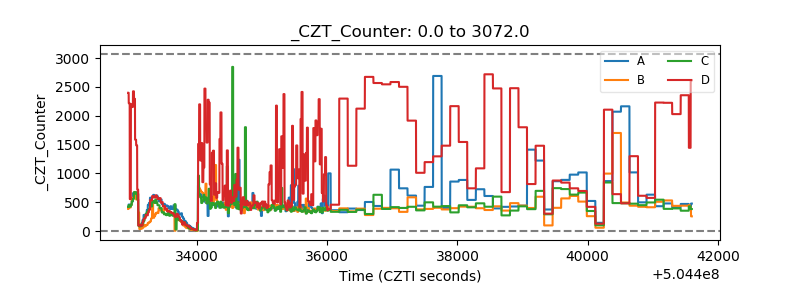 |
| +2.5 Volts monitor |  |
| +5 Volts monitor |  |
| _ROLL_ROT | 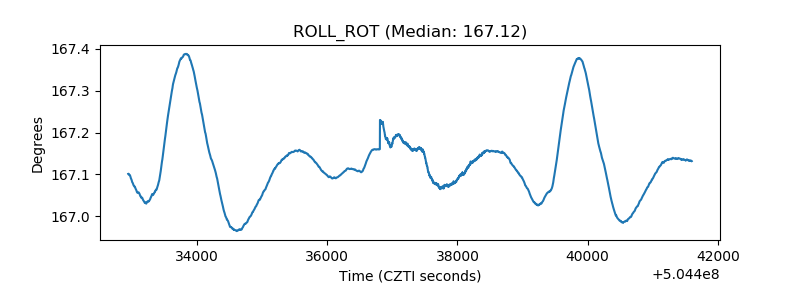 |
| _Roll_DEC | 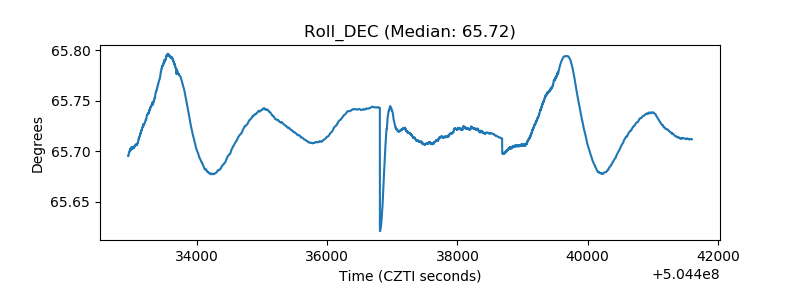 |
| _Roll_RA | 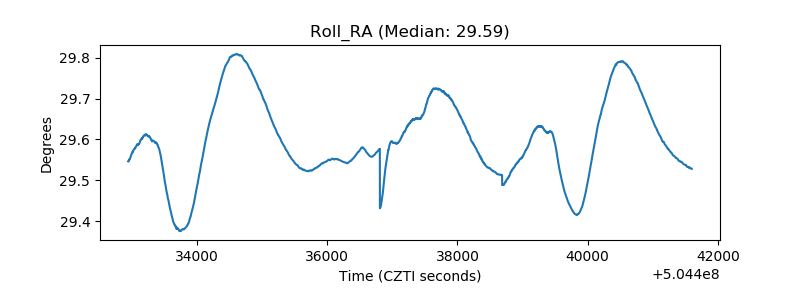 |
| Veto Counter | 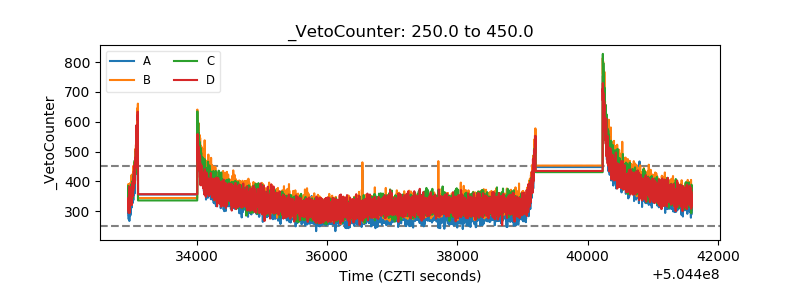 |