| Param | Original file | Final file |
|---|---|---|
| Filename | modeM0/AS1A14_099T01_9000006536_55430cztM0_level2.fits | modeM0/AS1A14_099T01_9000006536_55430cztM0_level2_quad_clean.evt |
| Size (bytes) | 477,976,320 | 85,155,840 |
| Size | 455.8 MB | 81.2 MB |
| Events in quadrant A | 3,103,963 | 582,838 |
| Events in quadrant B | 2,897,638 | 620,432 |
| Events in quadrant C | 2,834,019 | 547,700 |
| Events in quadrant D | 8,390,731 | 408,367 |
| Mode M9 | |||
|---|---|---|---|
| Quadrant | BADHDUFLAG | Total packets | Discarded packets |
| A | 0 | 11 | 0 |
| B | 0 | 11 | 0 |
| C | 0 | 11 | 0 |
| D | 0 | 11 | 0 |
| Mode SS | |||
|---|---|---|---|
| Quadrant | BADHDUFLAG | Total packets | Discarded packets |
| A | 0 | 122 | 0 |
| B | 0 | 122 | 0 |
| C | 0 | 122 | 0 |
| D | 0 | 122 | 0 |
| Mode M0 | |||
|---|---|---|---|
| Quadrant | BADHDUFLAG | Total packets | Discarded packets |
| A | 0 | 13560 | 1 |
| B | 0 | 13182 | 1 |
| C | 0 | 13093 | 1 |
| D | 0 | 29095 | 1 |
| Quadrant | Total seconds | Saturated seconds | Saturation percentage |
|---|---|---|---|
| A | 5998 | 208 | 3.467823% |
| B | 5998 | 188 | 3.134378% |
| C | 5999 | 162 | 2.700450% |
| D | 5999 | 1669 | 27.821304% |
Noise dominated data is calculated using 1-second bins in cleaned event files. If a bin has >2000 counts, and if more than 50% of those come from <1% of pixels, then it is considered to be noise-dominated and hence unusable.
| Quadrant | # 1 sec bins | Bins with >0 counts | Bins with >2000 counts | High rate bins dominated by noise | Noise dominated (total time) | Noise dominated (detector-on time) | Marked lightcurve |
|---|---|---|---|---|---|---|---|
| A | 7098 | 5999 | 101 | 101 | 1.42% | 1.68% | 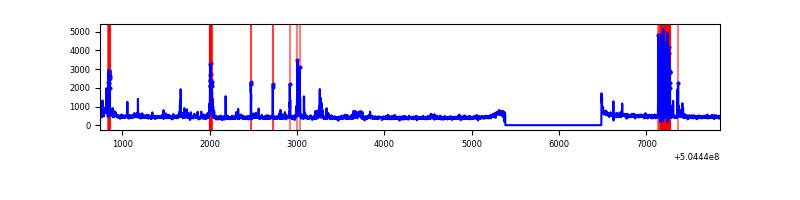 |
| B | 7098 | 5999 | 34 | 34 | 0.48% | 0.57% | 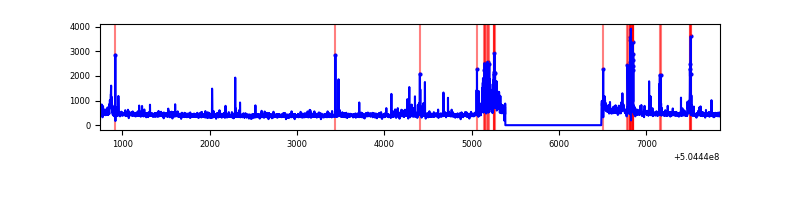 |
| C | 7099 | 6000 | 66 | 66 | 0.93% | 1.10% | 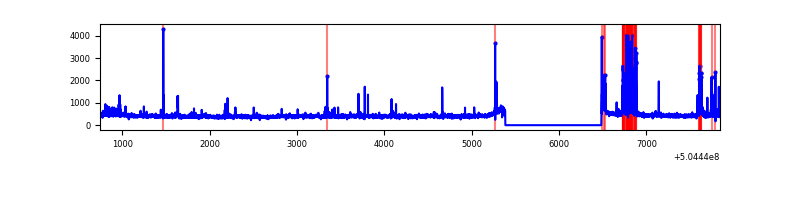 |
| D | 7099 | 6000 | 1397 | 1397 | 19.68% | 23.28% | 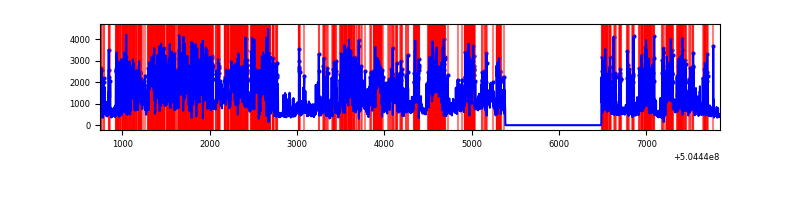 |
Top three noisy pixels from each quadrant. If the there are fewer than three noisy pixels in the level2.evt file, extra rows are filled as -1
| Pixel properties | Quadrant properties | ||||||
|---|---|---|---|---|---|---|---|
| Quadrant | DetID | PixID | Counts | Sigma | Mean | Median | Sigma |
| A | 3 | 78 | 243647 | 1532.69 | 641 | 624 | 158.6 |
| A | 15 | 32 | 233856 | 1470.94 | 641 | 624 | 158.6 |
| A | 4 | 159 | 70314 | 439.52 | 641 | 624 | 158.6 |
| B | 12 | 32 | 145544 | 1062.04 | 631 | 608 | 136.5 |
| B | 5 | 185 | 103241 | 752.06 | 631 | 608 | 136.5 |
| B | 10 | 247 | 46023 | 332.78 | 631 | 608 | 136.5 |
| C | 12 | 250 | 186330 | 1095.75 | 620 | 612 | 169.5 |
| C | 13 | 3 | 118582 | 696.03 | 620 | 612 | 169.5 |
| C | 12 | 252 | 52906 | 308.54 | 620 | 612 | 169.5 |
| D | 11 | 129 | 5664335 | 35635.63 | 562 | 537 | 158.9 |
| D | 8 | 160 | 195477 | 1226.53 | 562 | 537 | 158.9 |
| D | 12 | 128 | 112094 | 701.9 | 562 | 537 | 158.9 |
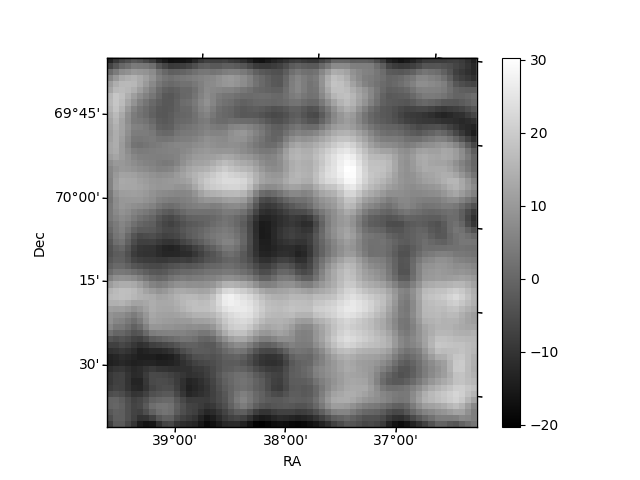
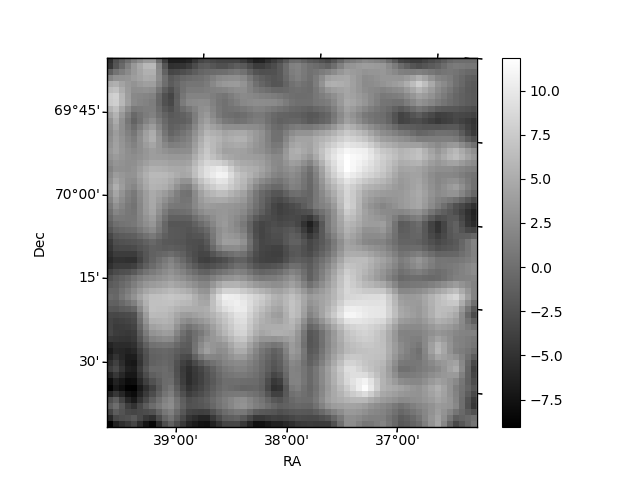
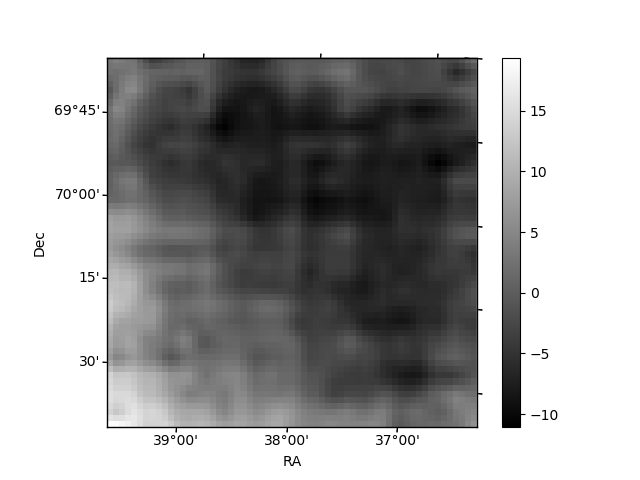
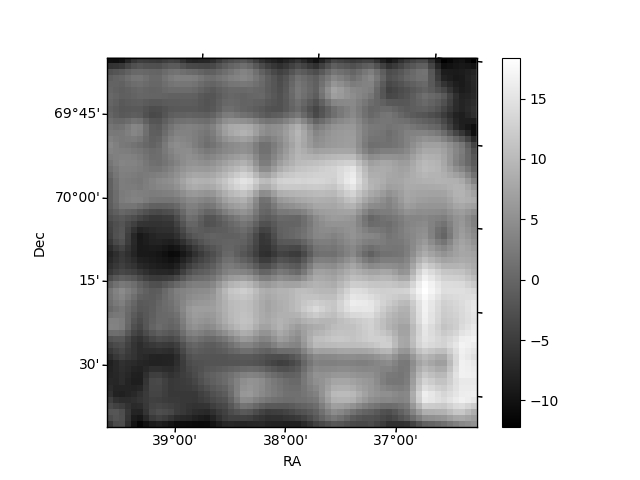
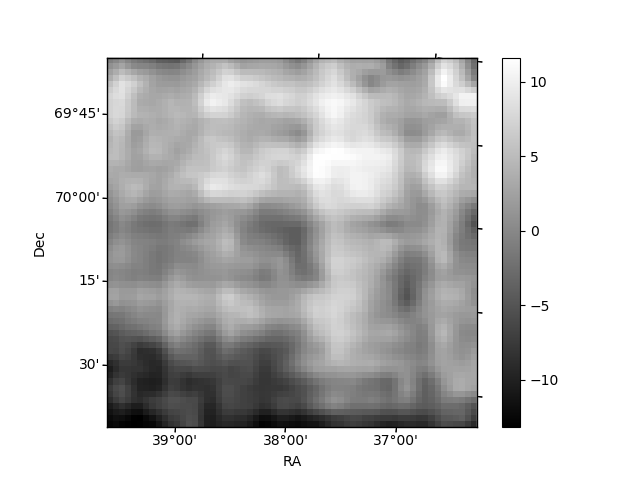
Histogram calculated using DETX and DETY for each event in the final _common_clean file
| Quadrant A | 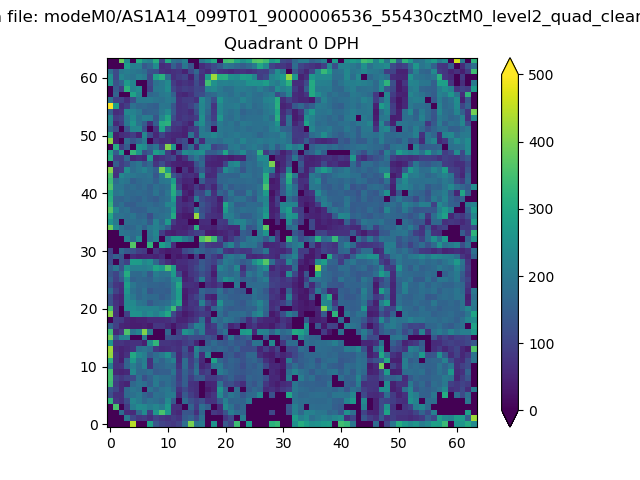 |
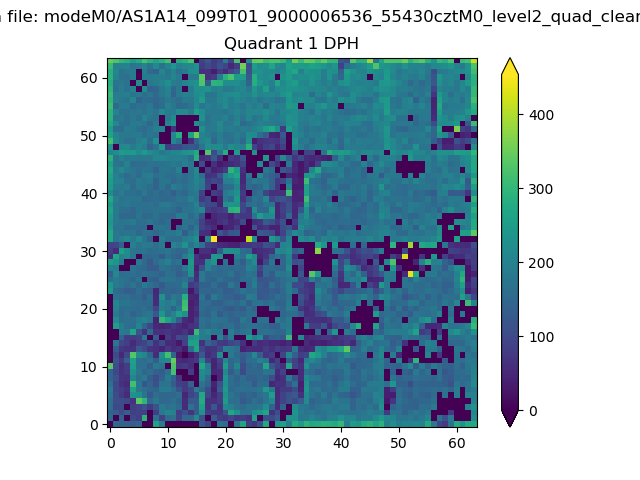 |
Quadrant B |
|---|---|---|---|
| Quadrant D | 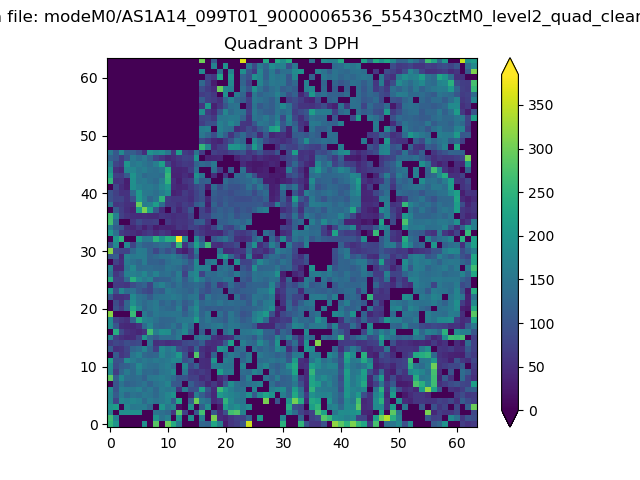 |
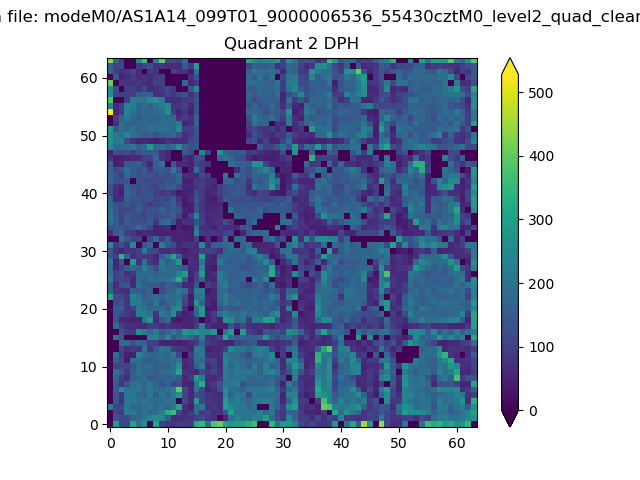 |
Quadrant C |
| Plot type | Count rate plots | Images |
|---|---|---|
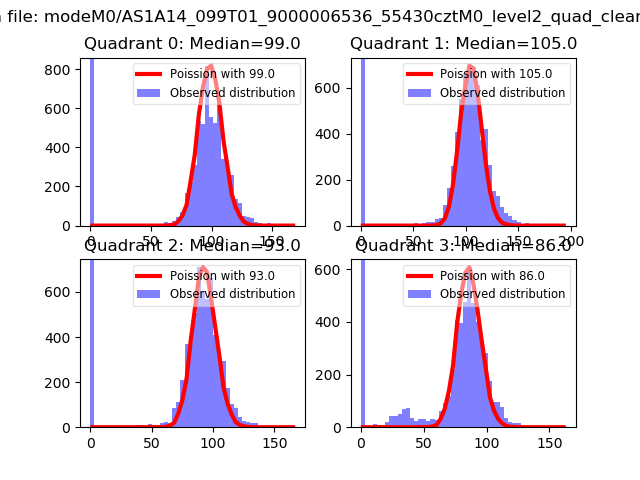
| Comparison with Poisson distribution Blue bars denote a histogram of data divided into 1 sec bins. Red curve is a Poisson curve with rate = median count rate of data. |
 |
 |
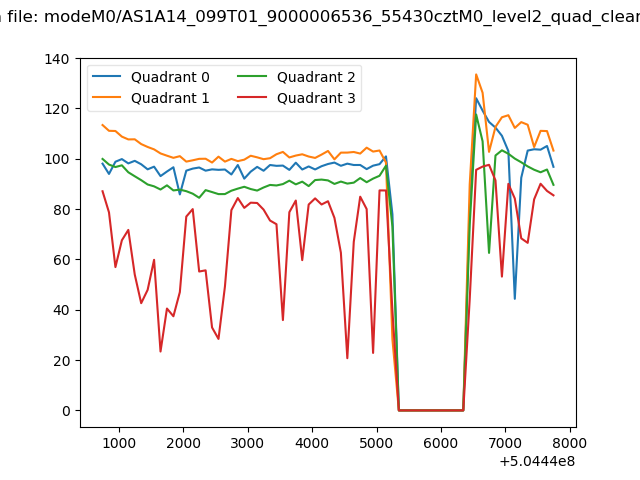
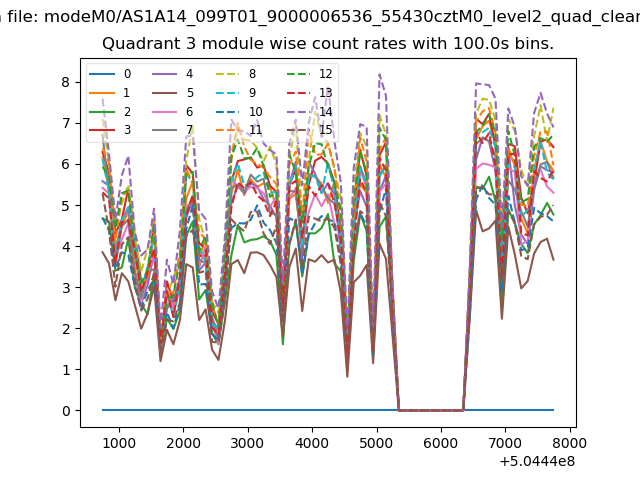
| Quadrant-wise count rates Data is divided into 100 sec bins |
 |
|
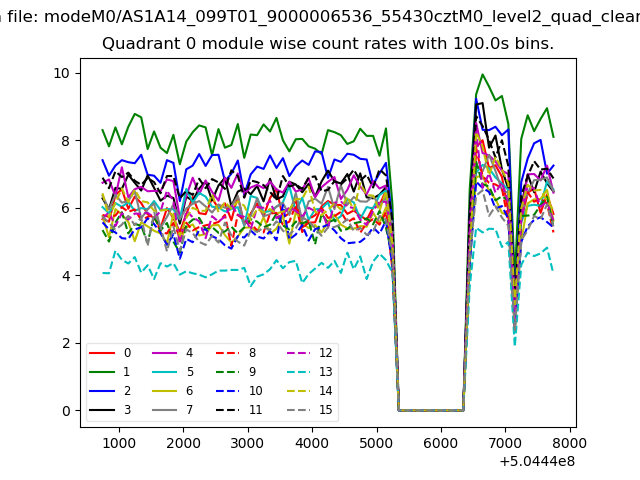
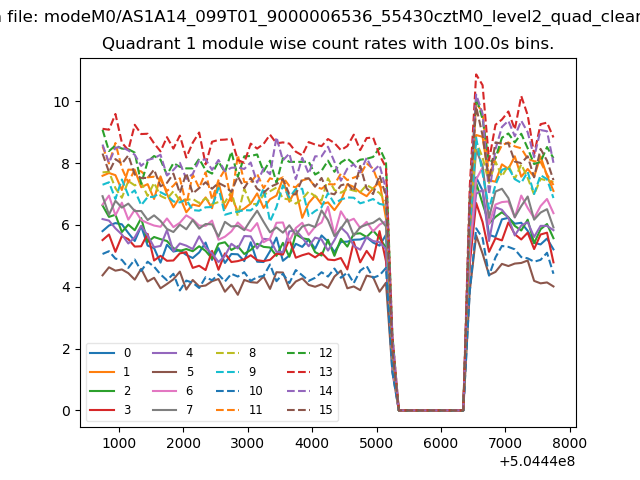
| Module-wise count rates for Quadrant A Data is divided into 100 sec bins |
 |
 |
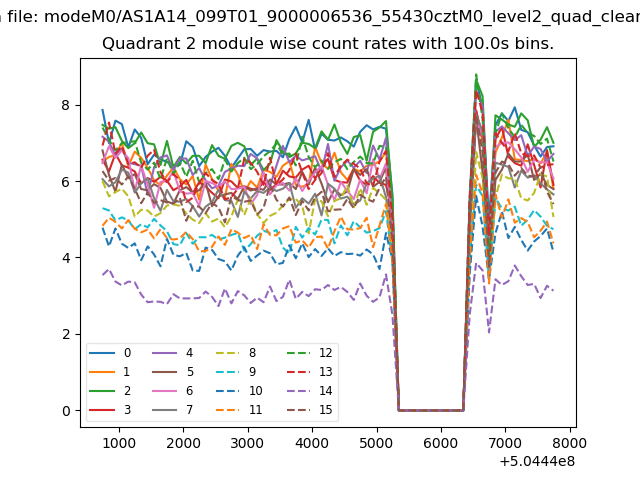
| Module-wise count rates for Quadrant B Data is divided into 100 sec bins |
 |
 |
| Module-wise count rates for Quadrant C Data is divided into 100 sec bins |
 |
 |
| Module-wise count rates for Quadrant D Data is divided into 100 sec bins |
 |
 |
| Parameter | Plot |
|---|---|
| CZT HV Monitor | 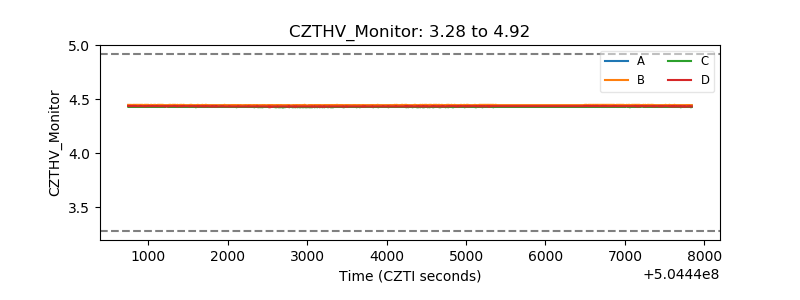 |
| D_VDD | 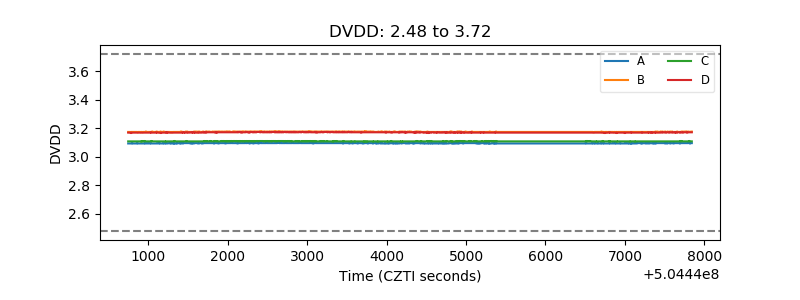 |
| Temperature 1 | 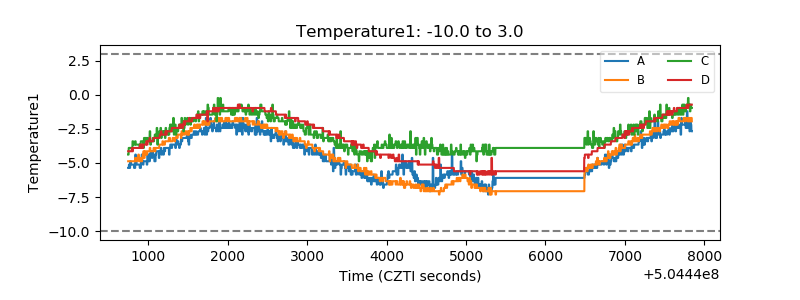 |
| Veto HV Monitor | 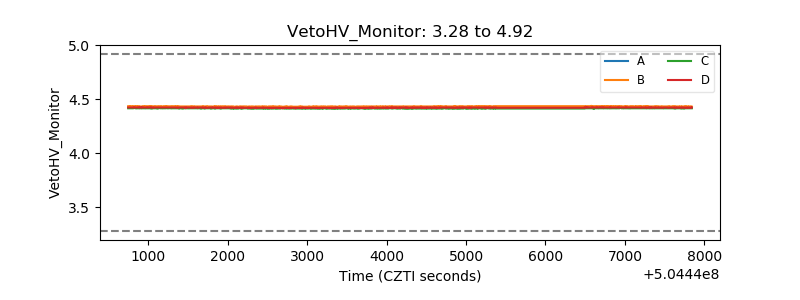 |
| Veto LLD | 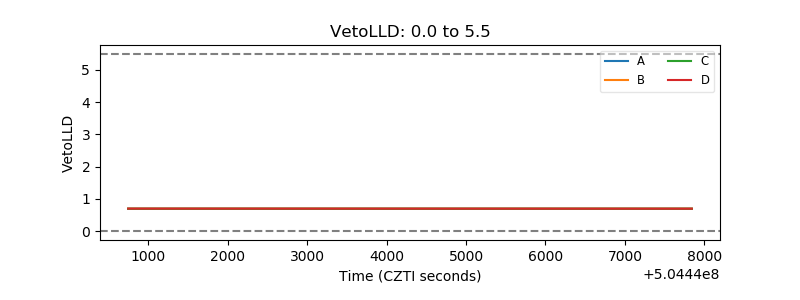 |
| Alpha Counter | 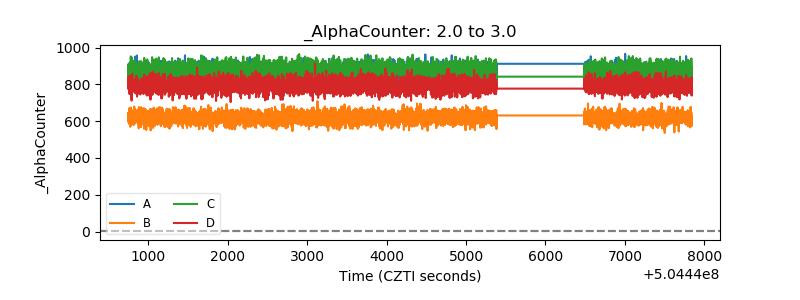 |
| _CPM_Rate | 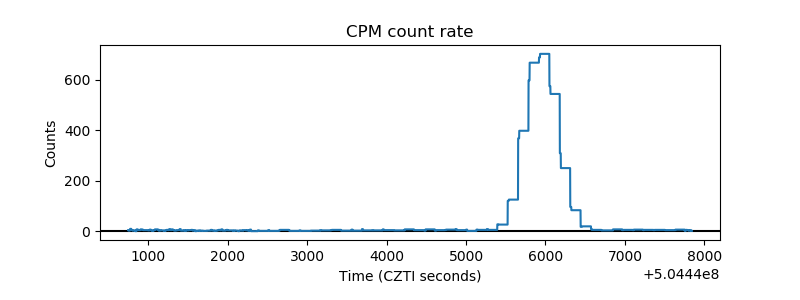 |
| CZT Counter | 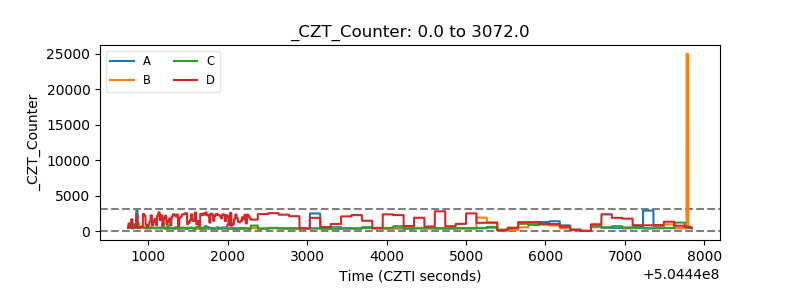 |
| +2.5 Volts monitor | 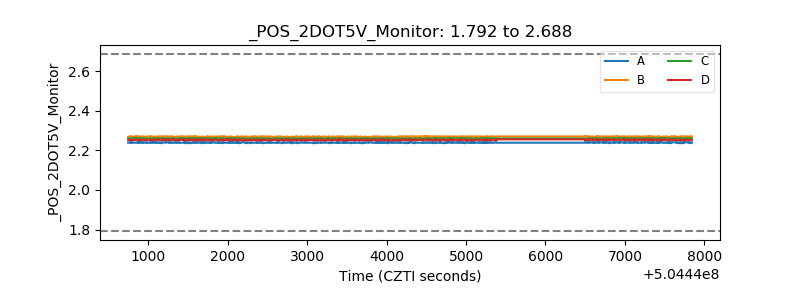 |
| +5 Volts monitor | 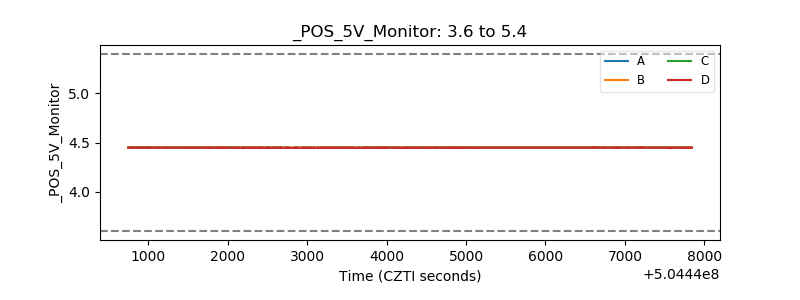 |
| _ROLL_ROT | 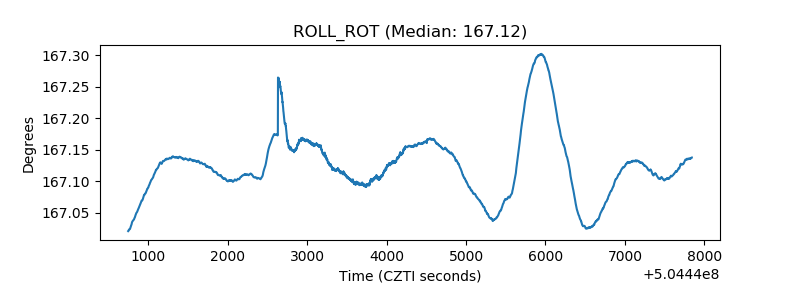 |
| _Roll_DEC | 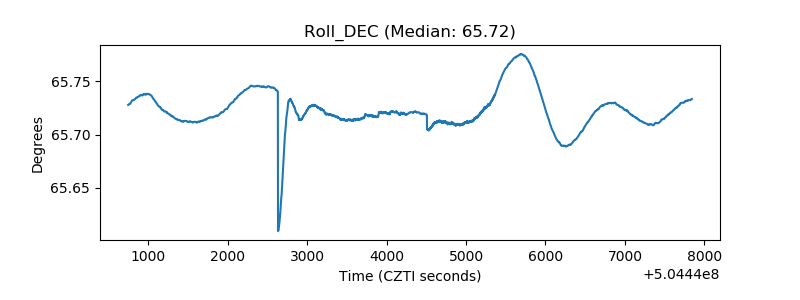 |
| _Roll_RA | 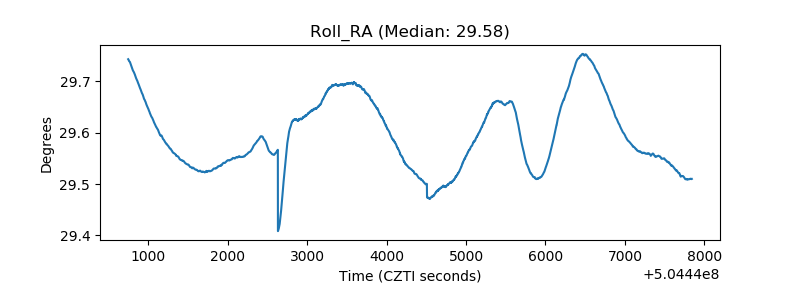 |
| Veto Counter | 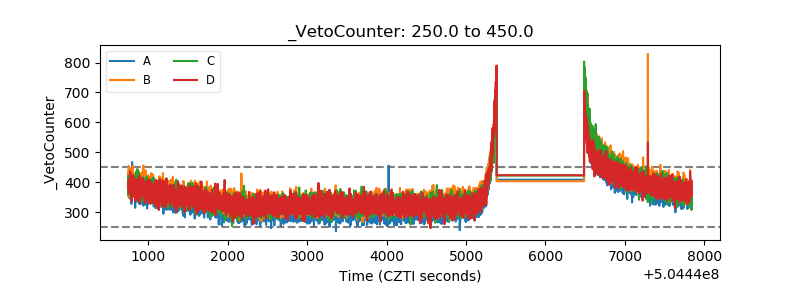 |