| Param | Original file | Final file |
|---|---|---|
| Filename | modeM0/AS1A14_099T01_9000006536_55431cztM0_level2.fits | modeM0/AS1A14_099T01_9000006536_55431cztM0_level2_quad_clean.evt |
| Size (bytes) | 478,647,360 | 94,631,040 |
| Size | 456.5 MB | 90.2 MB |
| Events in quadrant A | 3,056,125 | 639,374 |
| Events in quadrant B | 3,112,332 | 682,759 |
| Events in quadrant C | 3,126,112 | 603,985 |
| Events in quadrant D | 7,927,429 | 494,578 |
| Mode M9 | |||
|---|---|---|---|
| Quadrant | BADHDUFLAG | Total packets | Discarded packets |
| A | 0 | 12 | 0 |
| B | 0 | 12 | 0 |
| C | 0 | 12 | 0 |
| D | 0 | 12 | 0 |
| Mode SS | |||
|---|---|---|---|
| Quadrant | BADHDUFLAG | Total packets | Discarded packets |
| A | 0 | 128 | 0 |
| B | 0 | 128 | 0 |
| C | 0 | 128 | 0 |
| D | 0 | 128 | 0 |
| Mode M0 | |||
|---|---|---|---|
| Quadrant | BADHDUFLAG | Total packets | Discarded packets |
| A | 0 | 13735 | 1 |
| B | 0 | 13951 | 1 |
| C | 0 | 13998 | 1 |
| D | 0 | 27945 | 4 |
| Quadrant | Total seconds | Saturated seconds | Saturation percentage |
|---|---|---|---|
| A | 6377 | 164 | 2.571742% |
| B | 6377 | 146 | 2.289478% |
| C | 6377 | 108 | 1.693586% |
| D | 6376 | 1220 | 19.134253% |
Noise dominated data is calculated using 1-second bins in cleaned event files. If a bin has >2000 counts, and if more than 50% of those come from <1% of pixels, then it is considered to be noise-dominated and hence unusable.
| Quadrant | # 1 sec bins | Bins with >0 counts | Bins with >2000 counts | High rate bins dominated by noise | Noise dominated (total time) | Noise dominated (detector-on time) | Marked lightcurve |
|---|---|---|---|---|---|---|---|
| A | 7527 | 6378 | 64 | 64 | 0.85% | 1.00% | 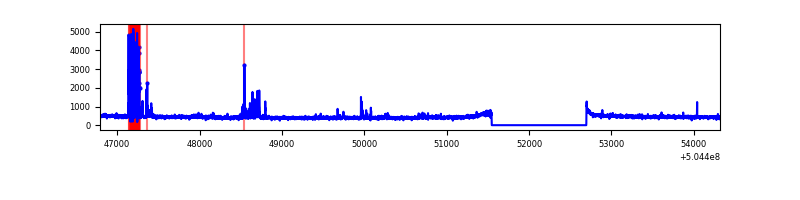 |
| B | 7527 | 6378 | 36 | 36 | 0.48% | 0.56% | 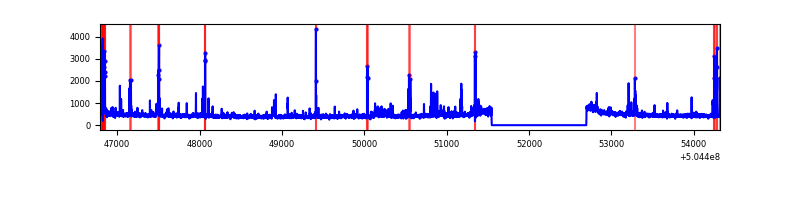 |
| C | 7527 | 6378 | 49 | 49 | 0.65% | 0.77% | 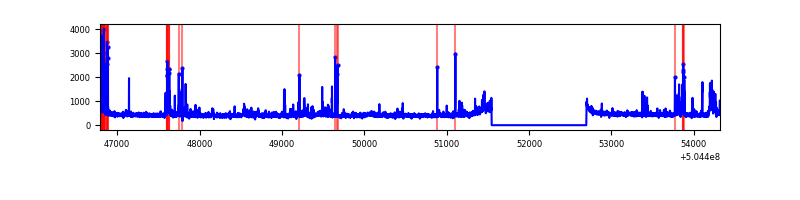 |
| D | 7526 | 6377 | 1104 | 1104 | 14.67% | 17.31% | 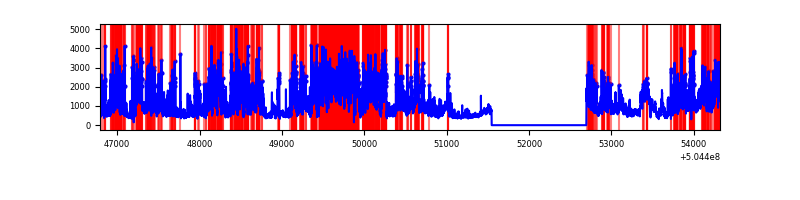 |
Top three noisy pixels from each quadrant. If the there are fewer than three noisy pixels in the level2.evt file, extra rows are filled as -1
| Pixel properties | Quadrant properties | ||||||
|---|---|---|---|---|---|---|---|
| Quadrant | DetID | PixID | Counts | Sigma | Mean | Median | Sigma |
| A | 15 | 32 | 234004 | 1368.79 | 692 | 677 | 170.5 |
| A | 0 | 8 | 54728 | 317.09 | 692 | 677 | 170.5 |
| A | 7 | 173 | 18138 | 102.43 | 692 | 677 | 170.5 |
| B | 5 | 185 | 172391 | 1187.49 | 681 | 658 | 144.6 |
| B | 9 | 254 | 69309 | 474.7 | 681 | 658 | 144.6 |
| B | 10 | 247 | 42973 | 292.6 | 681 | 658 | 144.6 |
| C | 13 | 3 | 181289 | 980.51 | 673 | 664 | 184.2 |
| C | 12 | 250 | 109178 | 589.06 | 673 | 664 | 184.2 |
| C | 9 | 237 | 64476 | 346.4 | 673 | 664 | 184.2 |
| D | 11 | 129 | 4765677 | 26566.74 | 638 | 608 | 179.4 |
| D | 8 | 160 | 172910 | 960.64 | 638 | 608 | 179.4 |
| D | 8 | 48 | 140370 | 779.22 | 638 | 608 | 179.4 |
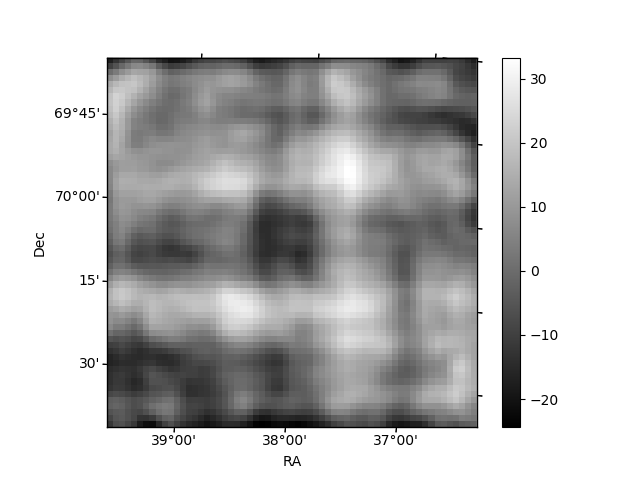
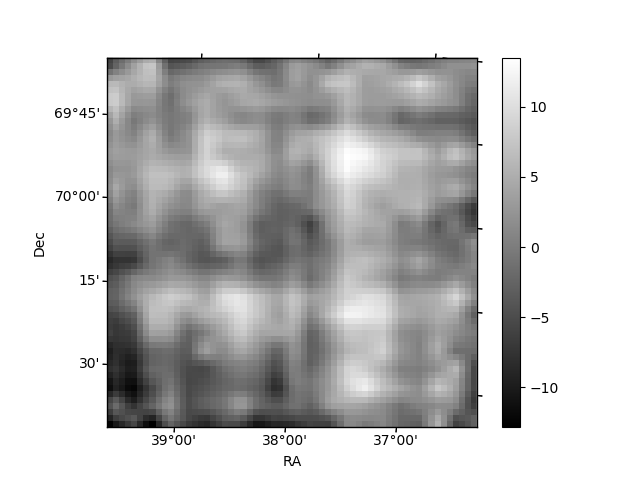
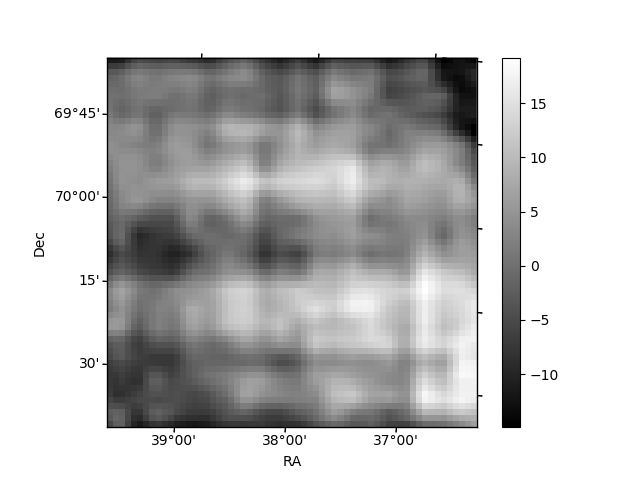
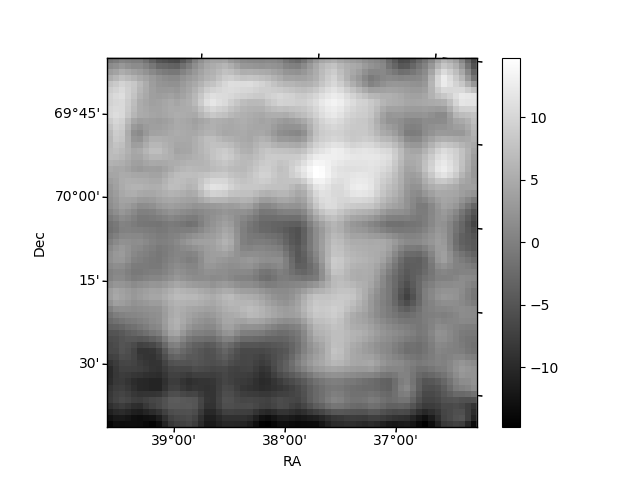
Histogram calculated using DETX and DETY for each event in the final _common_clean file
| Quadrant A | 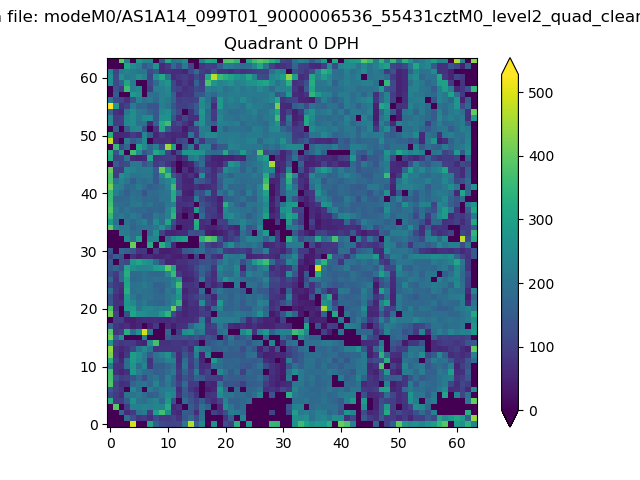 |
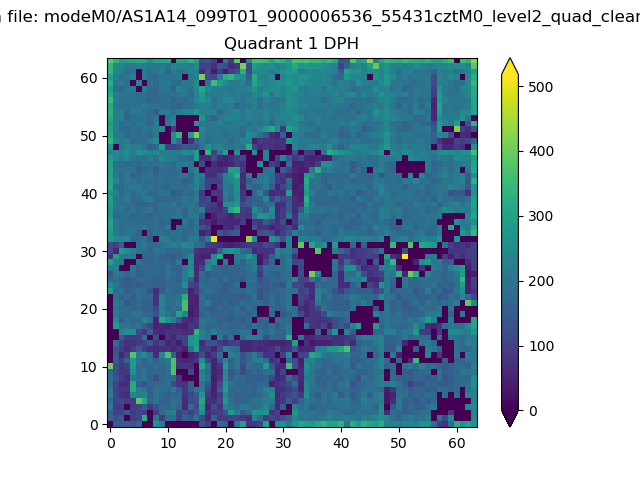 |
Quadrant B |
|---|---|---|---|
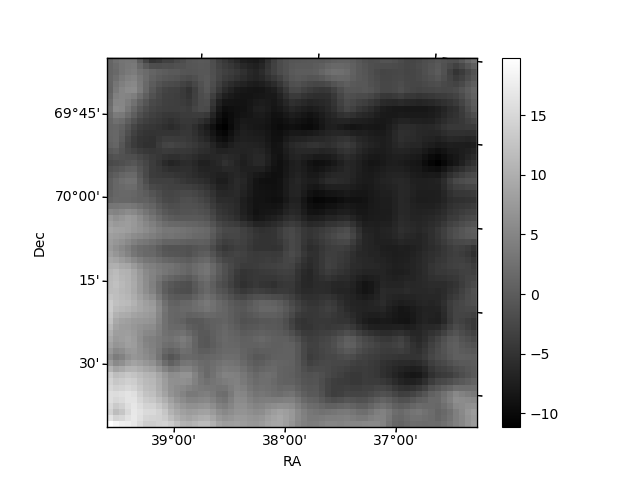
| Quadrant D | 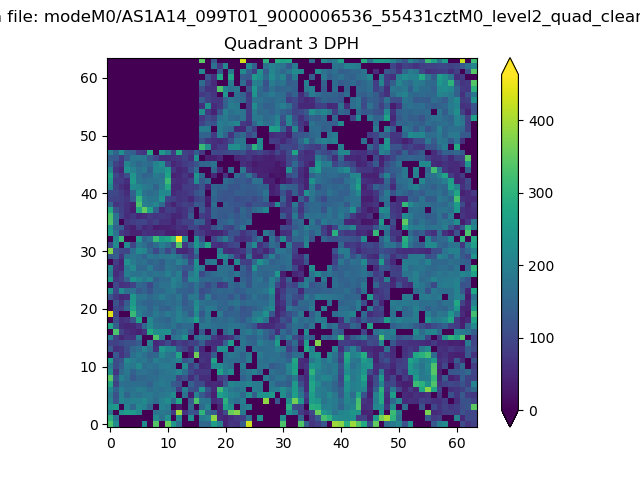 |
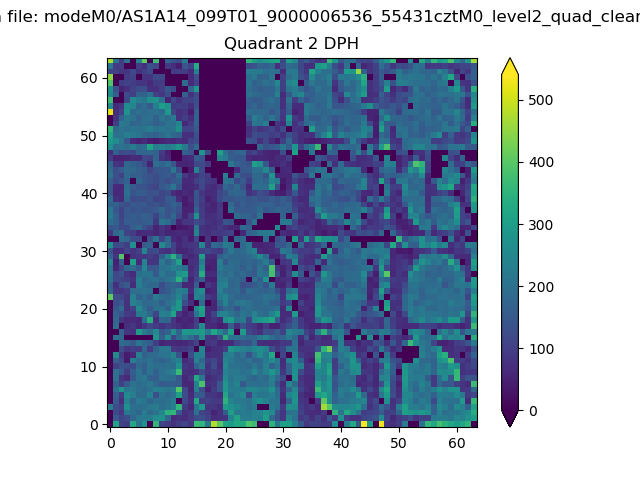 |
Quadrant C |
| Plot type | Count rate plots | Images |
|---|---|---|
| Comparison with Poisson distribution Blue bars denote a histogram of data divided into 1 sec bins. Red curve is a Poisson curve with rate = median count rate of data. |
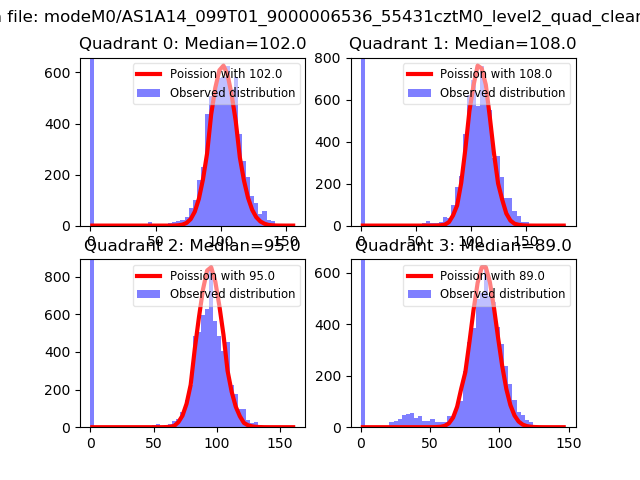 |
 |
| Quadrant-wise count rates Data is divided into 100 sec bins |
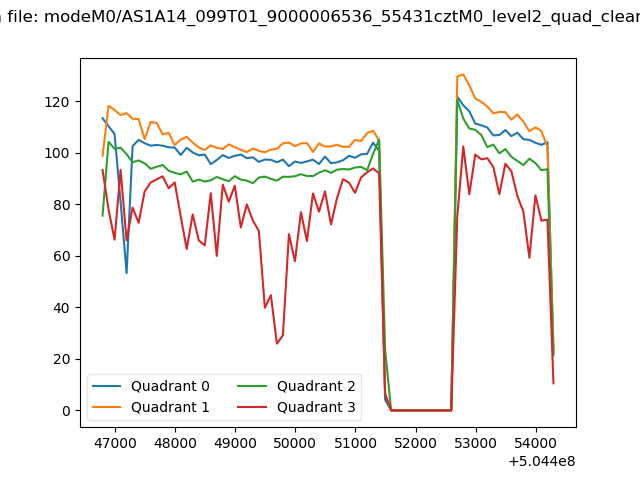 |
|
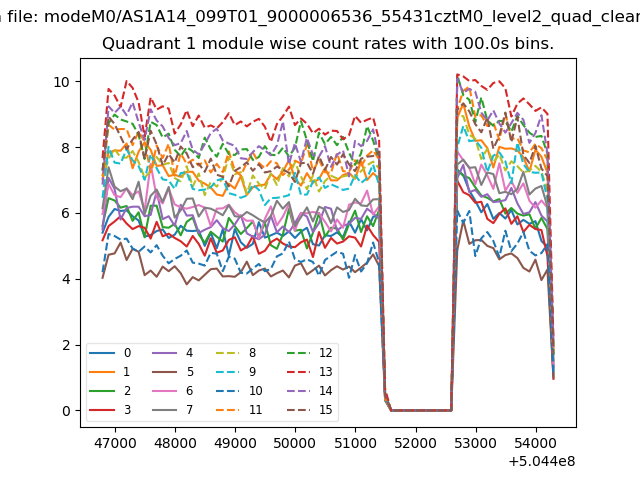
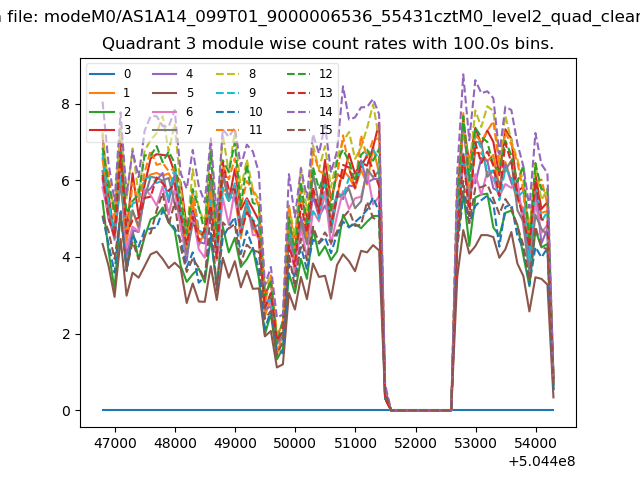
| Module-wise count rates for Quadrant A Data is divided into 100 sec bins |
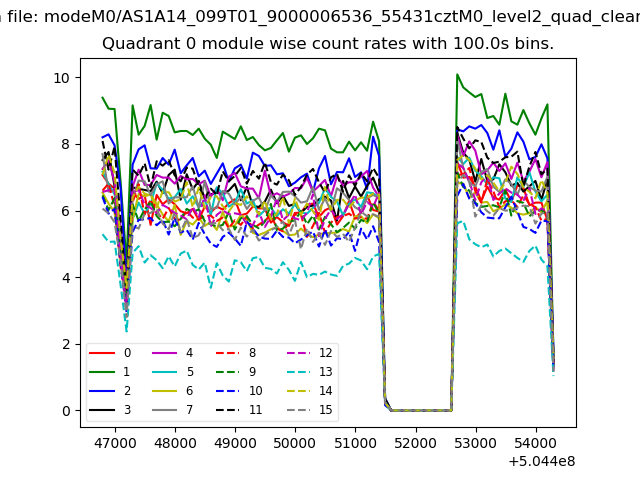 |
 |
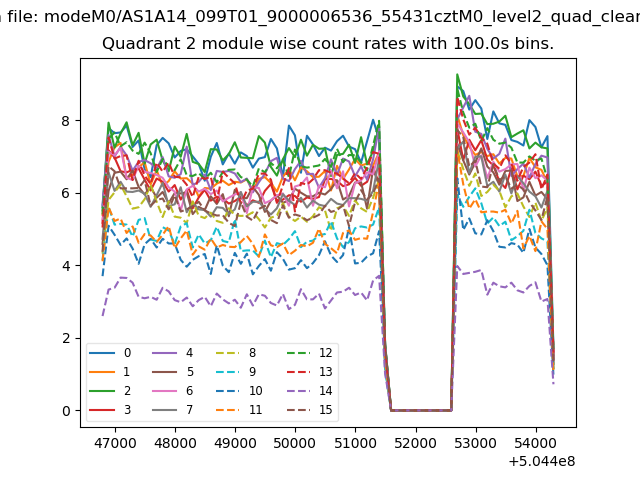
| Module-wise count rates for Quadrant B Data is divided into 100 sec bins |
 |
 |
| Module-wise count rates for Quadrant C Data is divided into 100 sec bins |
 |
 |
| Module-wise count rates for Quadrant D Data is divided into 100 sec bins |
 |
 |
| Parameter | Plot |
|---|---|
| CZT HV Monitor | 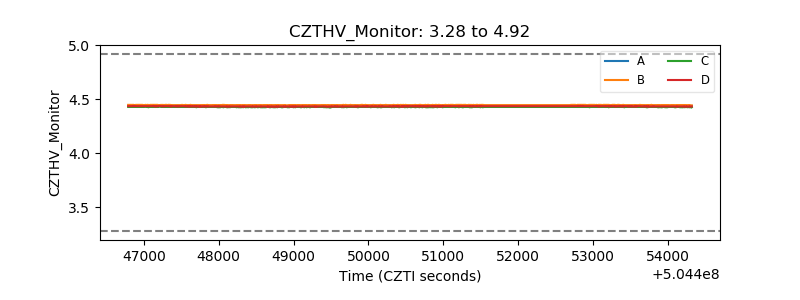 |
| D_VDD | 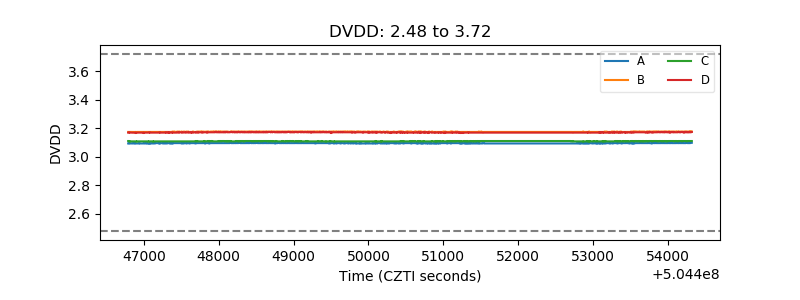 |
| Temperature 1 | 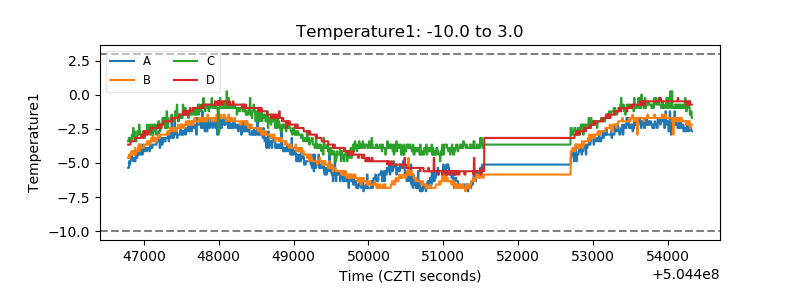 |
| Veto HV Monitor | 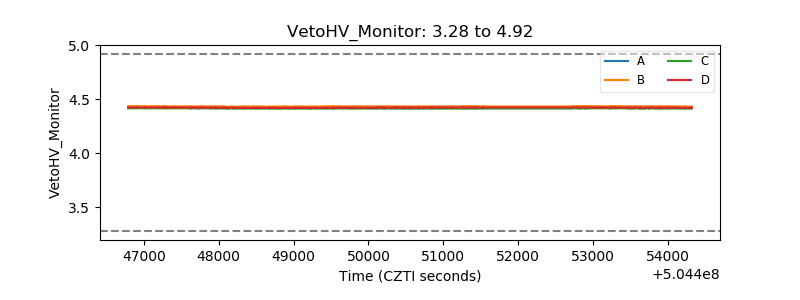 |
| Veto LLD | 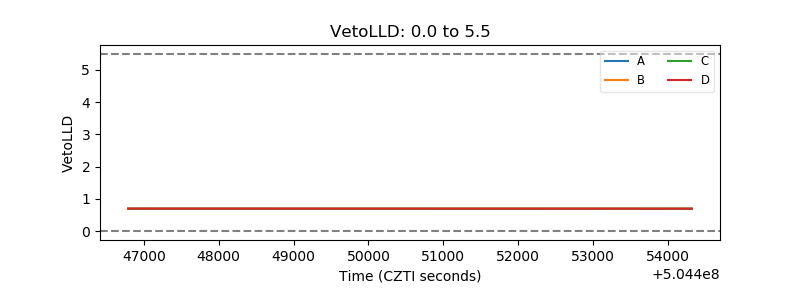 |
| Alpha Counter | 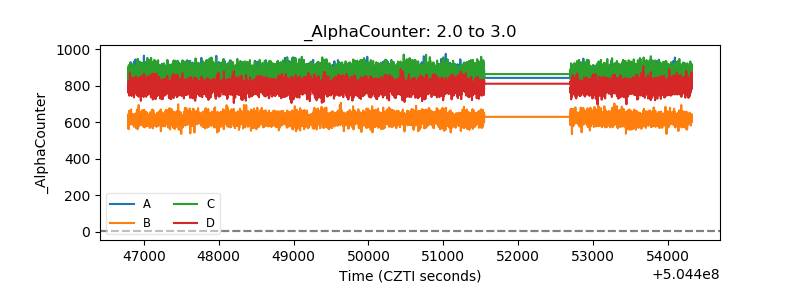 |
| _CPM_Rate | 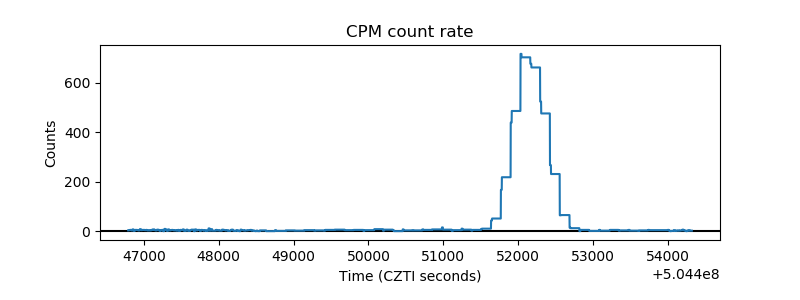 |
| CZT Counter | 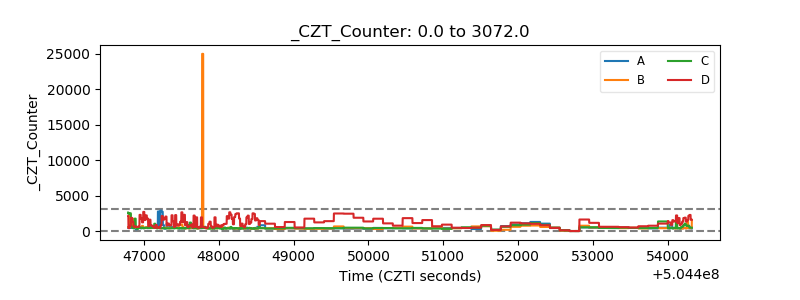 |
| +2.5 Volts monitor | 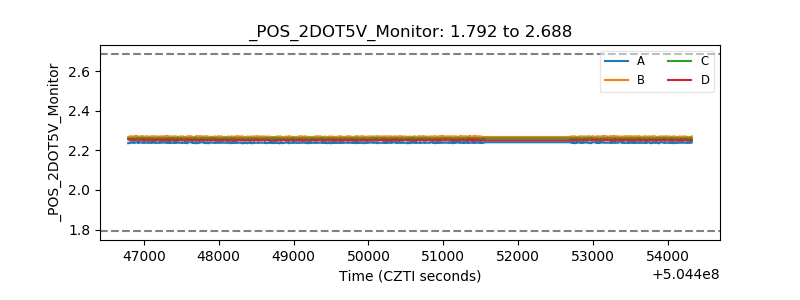 |
| +5 Volts monitor | 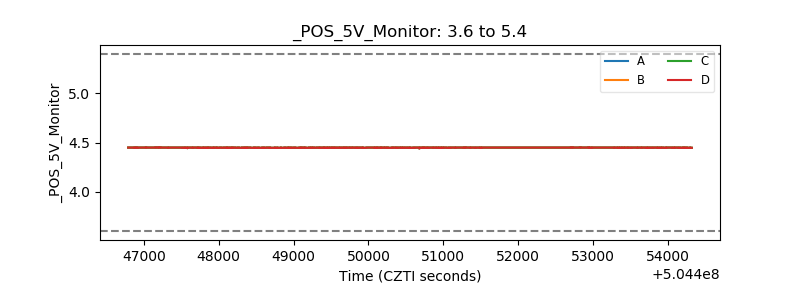 |
| _ROLL_ROT | 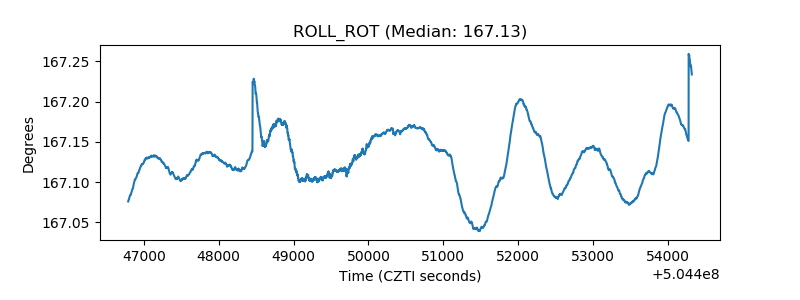 |
| _Roll_DEC | 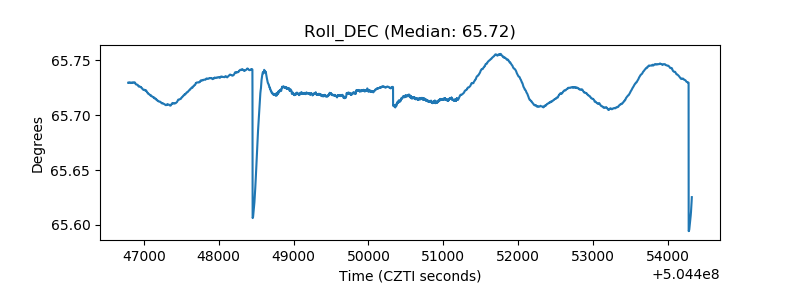 |
| _Roll_RA | 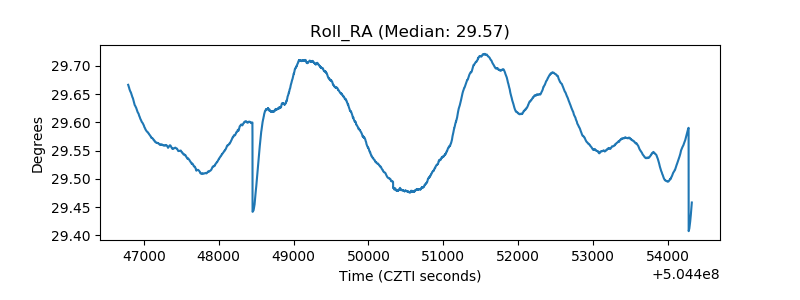 |
| Veto Counter | 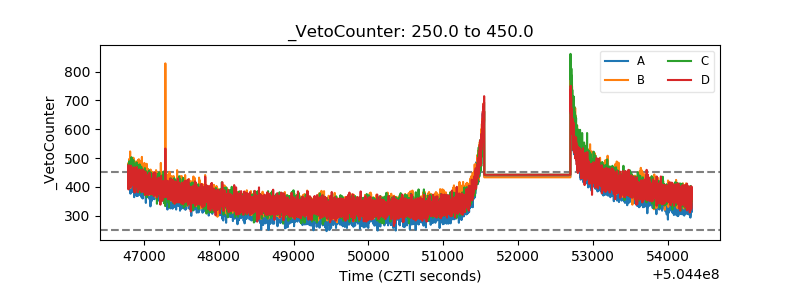 |