| Param | Original file | Final file |
|---|---|---|
| Filename | modeM0/AS1A14_099T01_9000006536_55432cztM0_level2.fits | modeM0/AS1A14_099T01_9000006536_55432cztM0_level2_quad_clean.evt |
| Size (bytes) | 507,758,400 | 93,608,640 |
| Size | 484.2 MB | 89.3 MB |
| Events in quadrant A | 2,806,788 | 642,766 |
| Events in quadrant B | 3,232,221 | 681,910 |
| Events in quadrant C | 2,976,638 | 604,011 |
| Events in quadrant D | 9,285,028 | 461,645 |
| Mode M9 | |||
|---|---|---|---|
| Quadrant | BADHDUFLAG | Total packets | Discarded packets |
| A | 0 | 12 | 0 |
| B | 0 | 12 | 0 |
| C | 0 | 12 | 0 |
| D | 0 | 12 | 0 |
| Mode SS | |||
|---|---|---|---|
| Quadrant | BADHDUFLAG | Total packets | Discarded packets |
| A | 0 | 128 | 0 |
| B | 0 | 128 | 0 |
| C | 0 | 128 | 0 |
| D | 0 | 128 | 0 |
| Mode M0 | |||
|---|---|---|---|
| Quadrant | BADHDUFLAG | Total packets | Discarded packets |
| A | 0 | 13084 | 2 |
| B | 0 | 14141 | 1 |
| C | 0 | 13591 | 1 |
| D | 0 | 31981 | 1 |
| Quadrant | Total seconds | Saturated seconds | Saturation percentage |
|---|---|---|---|
| A | 6369 | 92 | 1.444497% |
| B | 6370 | 130 | 2.040816% |
| C | 6370 | 74 | 1.161695% |
| D | 6370 | 1605 | 25.196232% |
Noise dominated data is calculated using 1-second bins in cleaned event files. If a bin has >2000 counts, and if more than 50% of those come from <1% of pixels, then it is considered to be noise-dominated and hence unusable.
| Quadrant | # 1 sec bins | Bins with >0 counts | Bins with >2000 counts | High rate bins dominated by noise | Noise dominated (total time) | Noise dominated (detector-on time) | Marked lightcurve |
|---|---|---|---|---|---|---|---|
| A | 7514 | 6370 | 1 | 1 | 0.01% | 0.02% | 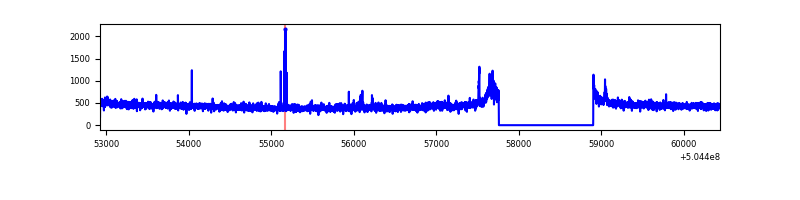 |
| B | 7515 | 6371 | 28 | 28 | 0.37% | 0.44% | 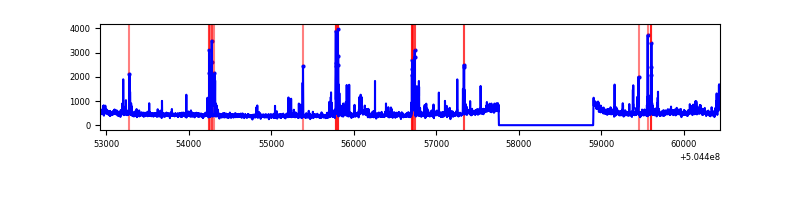 |
| C | 7515 | 6371 | 8 | 8 | 0.11% | 0.13% | 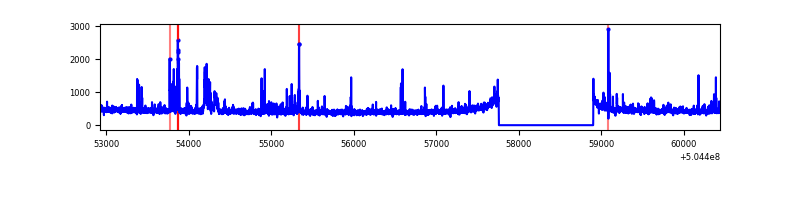 |
| D | 7515 | 6371 | 1522 | 1522 | 20.25% | 23.89% | 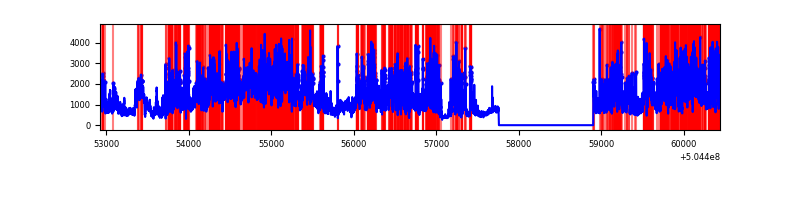 |
Top three noisy pixels from each quadrant. If the there are fewer than three noisy pixels in the level2.evt file, extra rows are filled as -1
| Pixel properties | Quadrant properties | ||||||
|---|---|---|---|---|---|---|---|
| Quadrant | DetID | PixID | Counts | Sigma | Mean | Median | Sigma |
| A | 12 | 115 | 41883 | 240.12 | 693 | 676 | 171.6 |
| A | 4 | 3 | 26170 | 148.56 | 693 | 676 | 171.6 |
| A | 14 | 235 | 20491 | 115.47 | 693 | 676 | 171.6 |
| B | 5 | 185 | 116305 | 803.86 | 679 | 655 | 143.9 |
| B | 9 | 254 | 111664 | 771.6 | 679 | 655 | 143.9 |
| B | 7 | 252 | 106029 | 732.44 | 679 | 655 | 143.9 |
| C | 13 | 3 | 108649 | 582.41 | 675 | 669 | 185.4 |
| C | 9 | 237 | 74284 | 397.06 | 675 | 669 | 185.4 |
| C | 12 | 252 | 56201 | 299.52 | 675 | 669 | 185.4 |
| D | 11 | 129 | 5945783 | 33628.06 | 624 | 595 | 176.8 |
| D | 8 | 48 | 318709 | 1799.36 | 624 | 595 | 176.8 |
| D | 8 | 160 | 162735 | 917.12 | 624 | 595 | 176.8 |
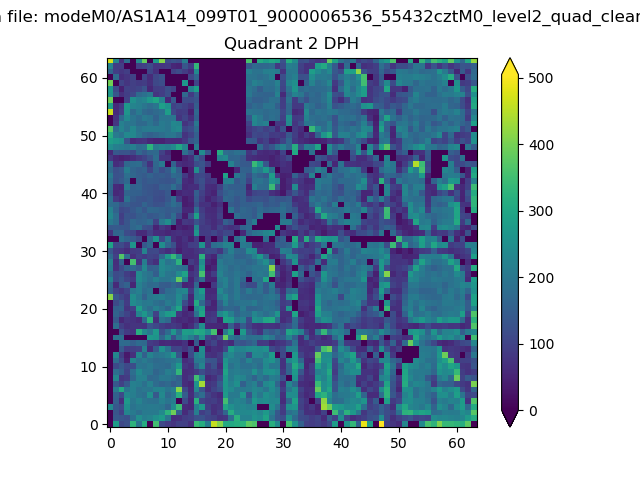
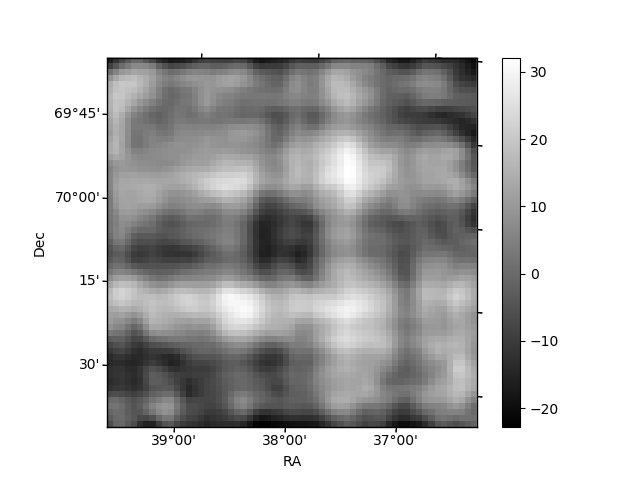
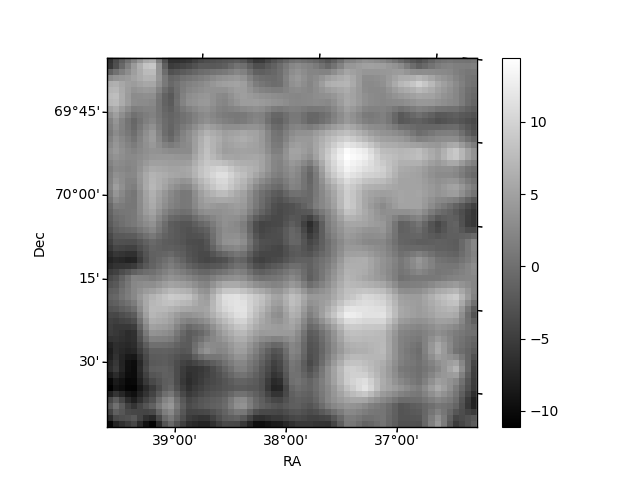
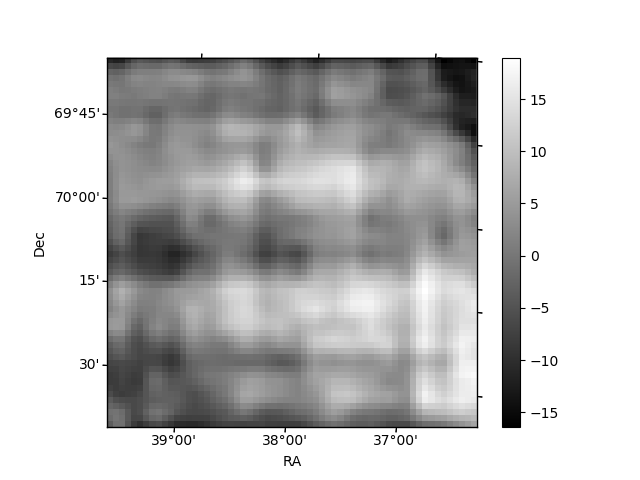
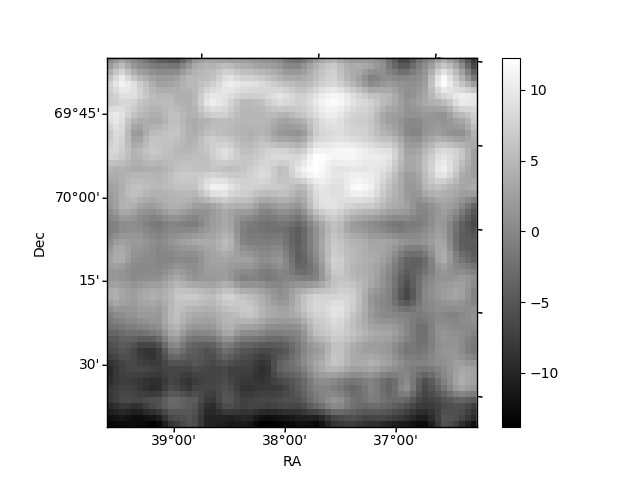
Histogram calculated using DETX and DETY for each event in the final _common_clean file
| Quadrant A | 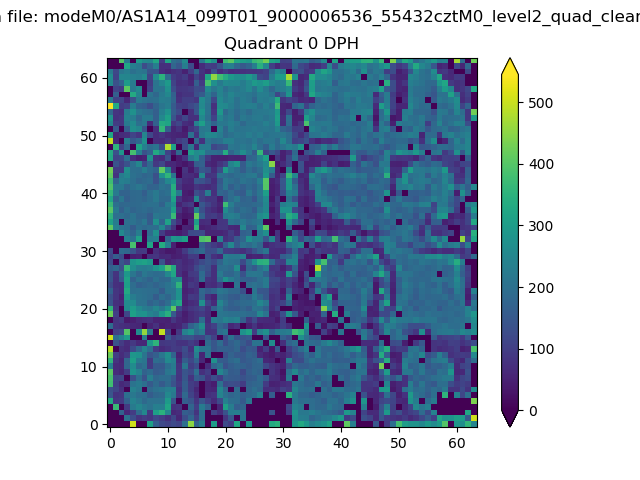 |
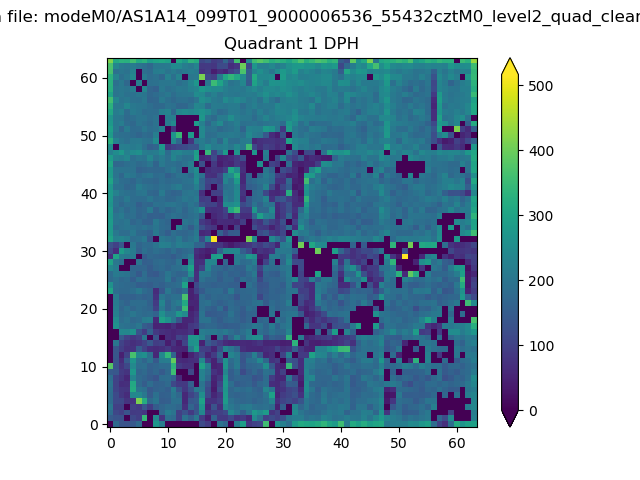 |
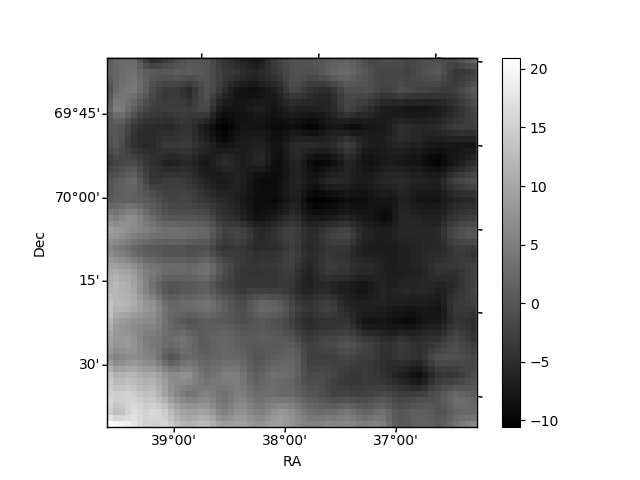
Quadrant B |
|---|---|---|---|
| Quadrant D | 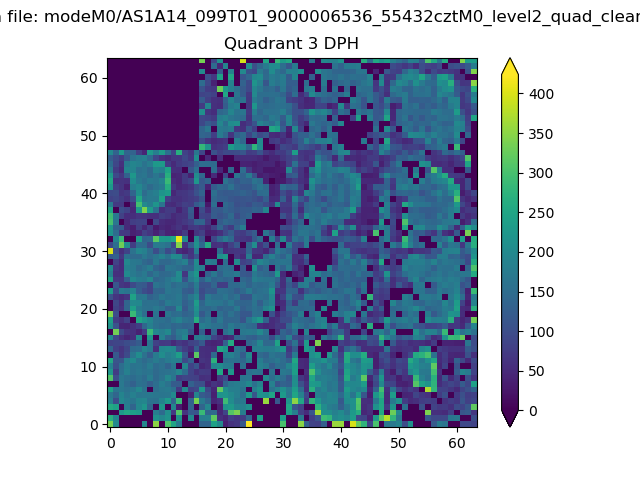 |
 |
Quadrant C |
| Plot type | Count rate plots | Images |
|---|---|---|
| Comparison with Poisson distribution Blue bars denote a histogram of data divided into 1 sec bins. Red curve is a Poisson curve with rate = median count rate of data. |
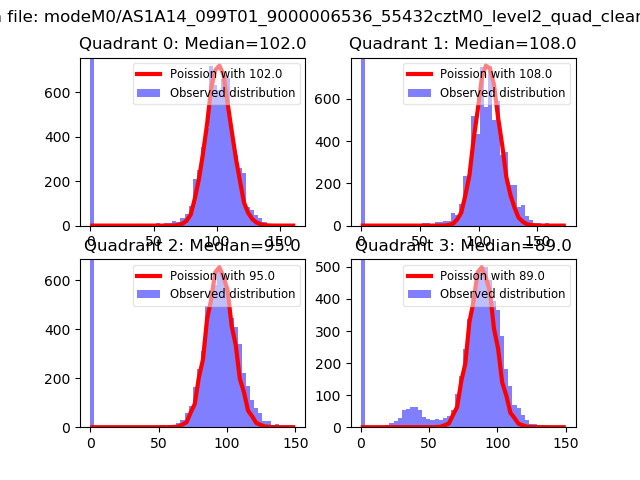 |
 |
| Quadrant-wise count rates Data is divided into 100 sec bins |
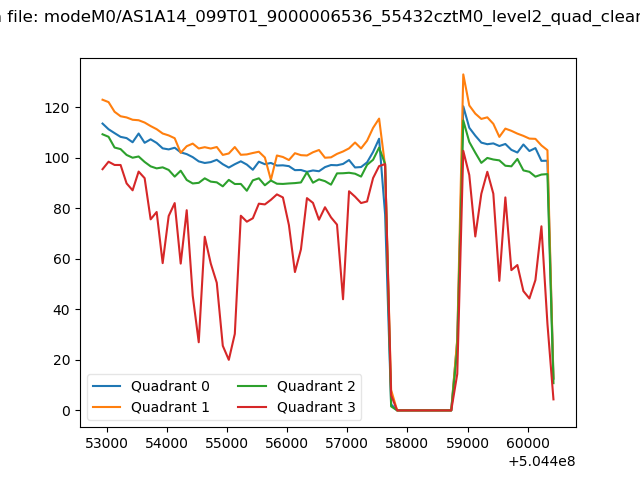 |
|
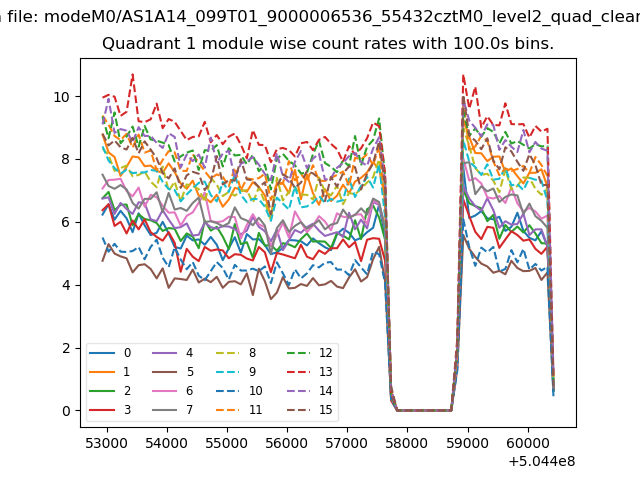
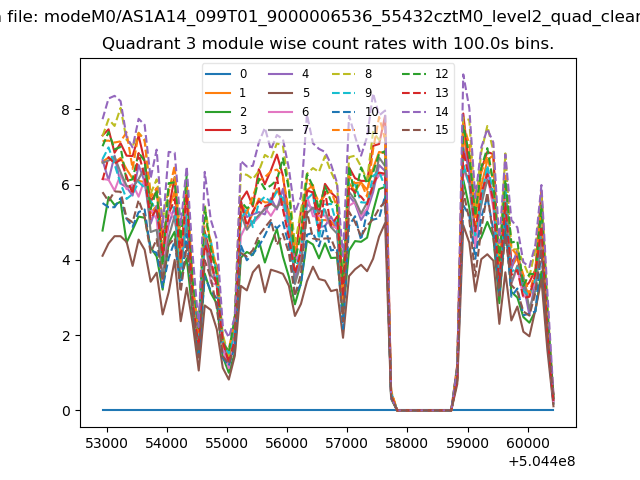
| Module-wise count rates for Quadrant A Data is divided into 100 sec bins |
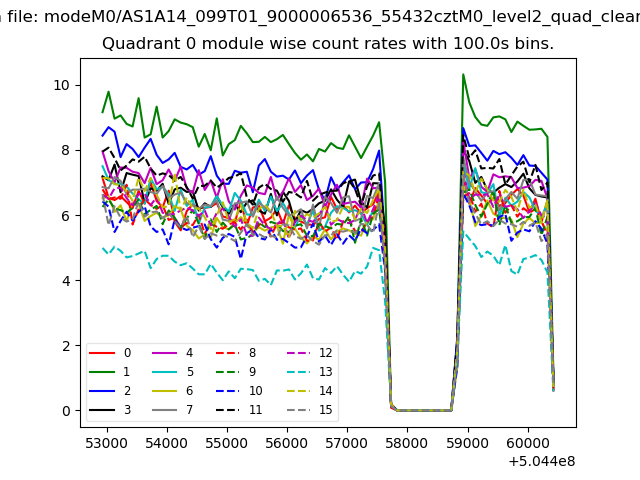 |
 |
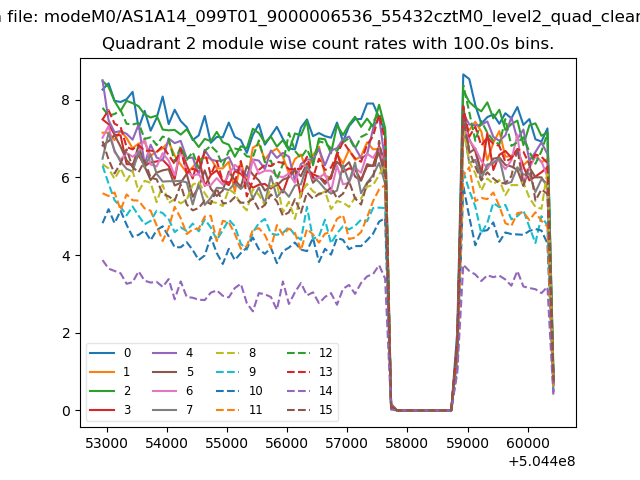
| Module-wise count rates for Quadrant B Data is divided into 100 sec bins |
 |
 |
| Module-wise count rates for Quadrant C Data is divided into 100 sec bins |
 |
 |
| Module-wise count rates for Quadrant D Data is divided into 100 sec bins |
 |
 |
| Parameter | Plot |
|---|---|
| CZT HV Monitor | 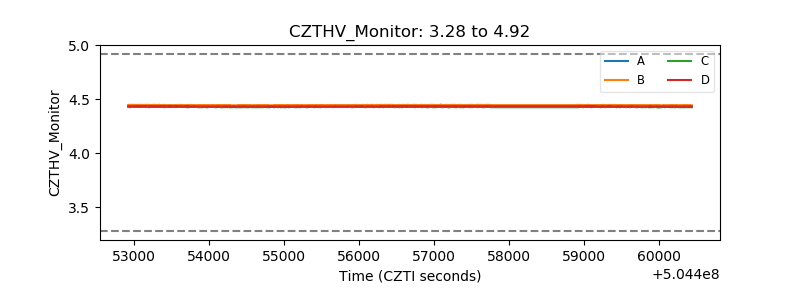 |
| D_VDD | 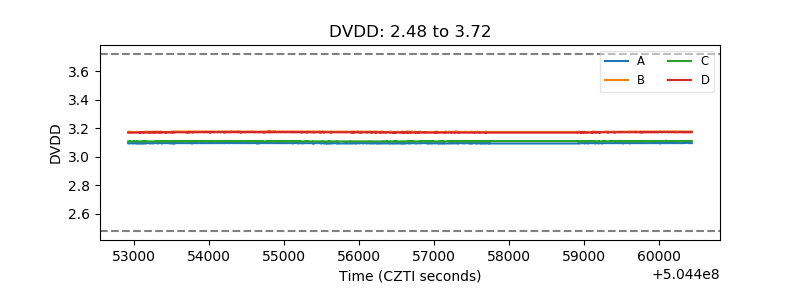 |
| Temperature 1 | 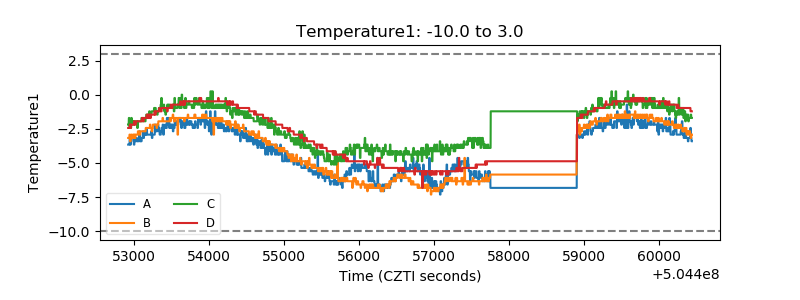 |
| Veto HV Monitor | 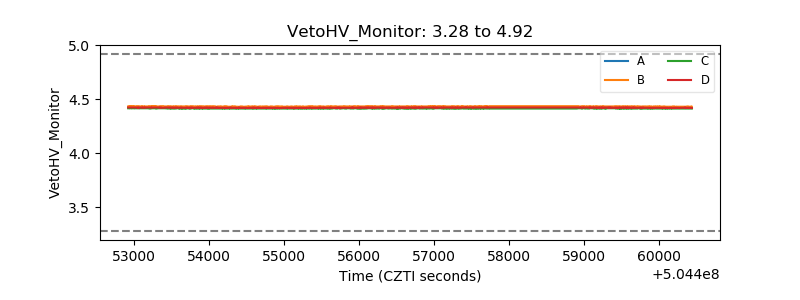 |
| Veto LLD | 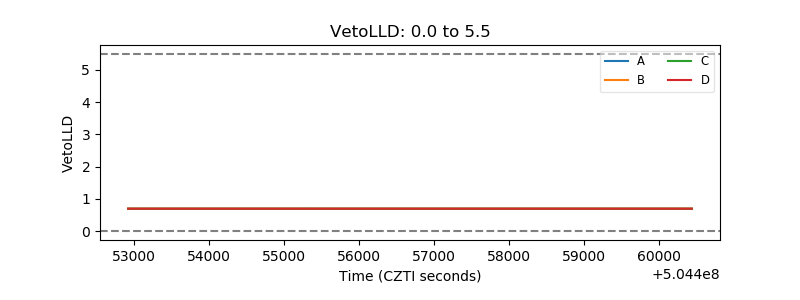 |
| Alpha Counter | 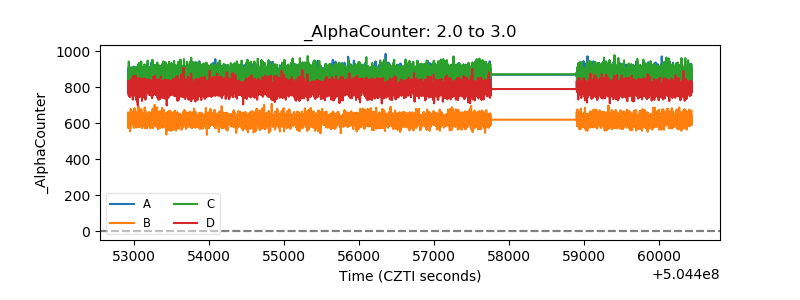 |
| _CPM_Rate | 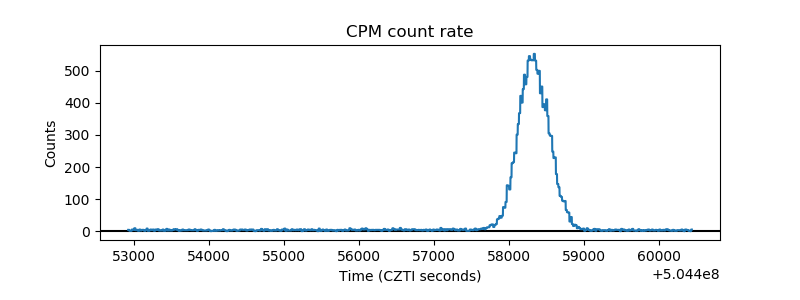 |
| CZT Counter | 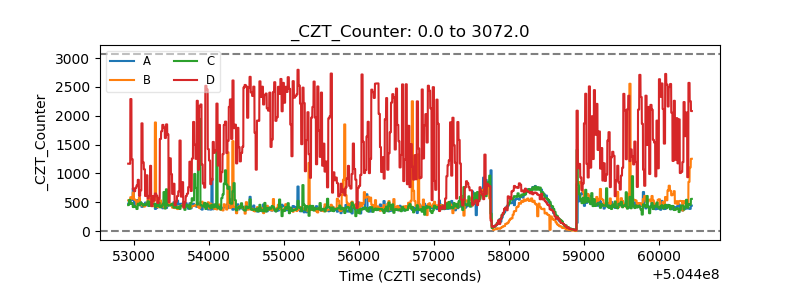 |
| +2.5 Volts monitor |  |
| +5 Volts monitor |  |
| _ROLL_ROT | 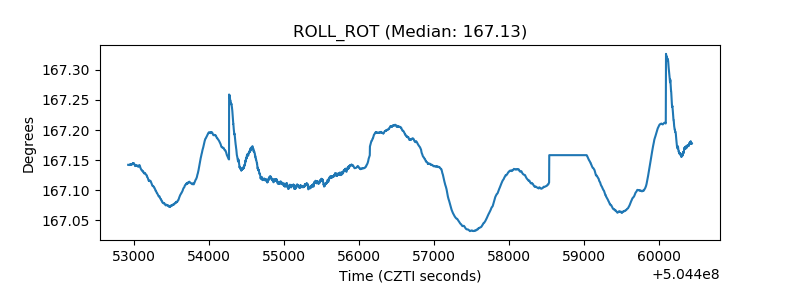 |
| _Roll_DEC | 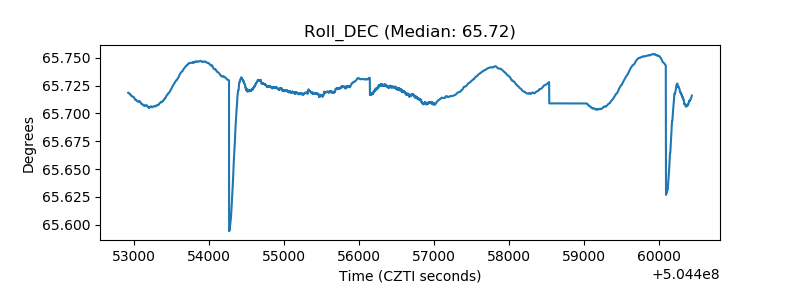 |
| _Roll_RA | 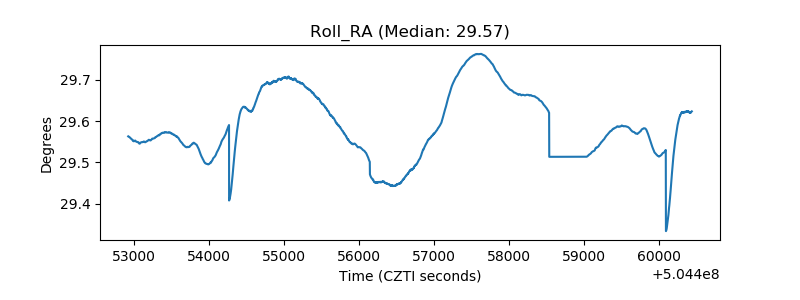 |
| Veto Counter | 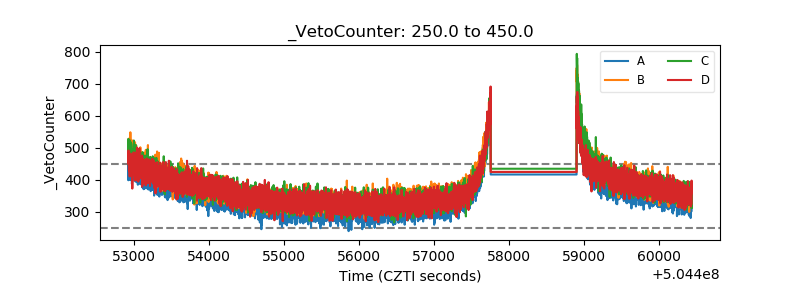 |