| Param | Original file | Final file |
|---|---|---|
| Filename | modeM0/AS1A14_099T01_9000006536_55433cztM0_level2.fits | modeM0/AS1A14_099T01_9000006536_55433cztM0_level2_quad_clean.evt |
| Size (bytes) | 521,303,040 | 85,530,240 |
| Size | 497.2 MB | 81.6 MB |
| Events in quadrant A | 2,981,502 | 582,198 |
| Events in quadrant B | 3,909,906 | 609,284 |
| Events in quadrant C | 2,885,260 | 538,113 |
| Events in quadrant D | 9,011,363 | 403,566 |
| Mode M9 | |||
|---|---|---|---|
| Quadrant | BADHDUFLAG | Total packets | Discarded packets |
| A | 0 | 11 | 0 |
| B | 0 | 11 | 0 |
| C | 0 | 11 | 0 |
| D | 0 | 11 | 0 |
| Mode SS | |||
|---|---|---|---|
| Quadrant | BADHDUFLAG | Total packets | Discarded packets |
| A | 0 | 132 | 0 |
| B | 0 | 132 | 0 |
| C | 0 | 132 | 0 |
| D | 0 | 132 | 0 |
| Mode M0 | |||
|---|---|---|---|
| Quadrant | BADHDUFLAG | Total packets | Discarded packets |
| A | 0 | 13687 | 1 |
| B | 0 | 16150 | 1 |
| C | 0 | 13560 | 1 |
| D | 0 | 31297 | 1 |
| Quadrant | Total seconds | Saturated seconds | Saturation percentage |
|---|---|---|---|
| A | 6545 | 50 | 0.763942% |
| B | 6546 | 305 | 4.659334% |
| C | 6546 | 44 | 0.672166% |
| D | 6545 | 1832 | 27.990833% |
Noise dominated data is calculated using 1-second bins in cleaned event files. If a bin has >2000 counts, and if more than 50% of those come from <1% of pixels, then it is considered to be noise-dominated and hence unusable.
| Quadrant | # 1 sec bins | Bins with >0 counts | Bins with >2000 counts | High rate bins dominated by noise | Noise dominated (total time) | Noise dominated (detector-on time) | Marked lightcurve |
|---|---|---|---|---|---|---|---|
| A | 7878 | 6820 | 7 | 7 | 0.09% | 0.10% | 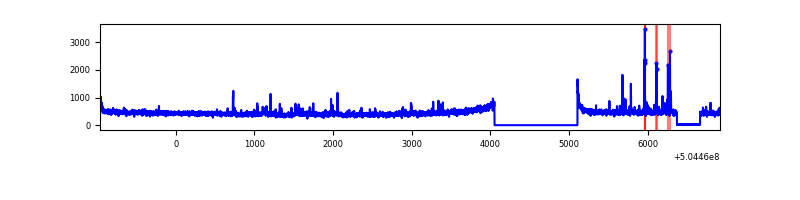 |
| B | 7879 | 6821 | 191 | 191 | 2.42% | 2.80% | 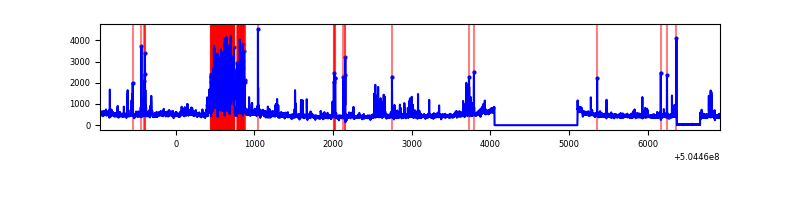 |
| C | 7879 | 6821 | 2 | 2 | 0.03% | 0.03% | 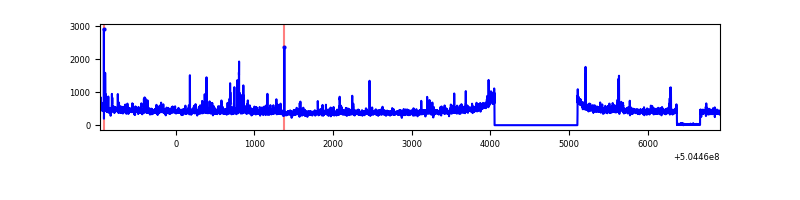 |
| D | 7878 | 6796 | 1560 | 1560 | 19.80% | 22.95% | 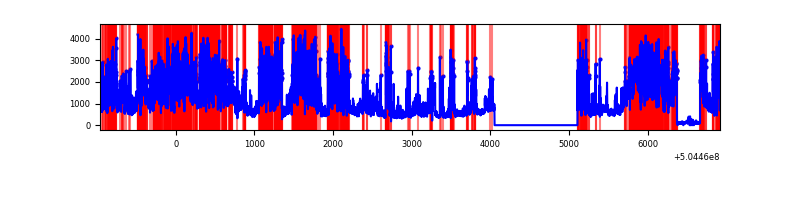 |
Top three noisy pixels from each quadrant. If the there are fewer than three noisy pixels in the level2.evt file, extra rows are filled as -1
| Pixel properties | Quadrant properties | ||||||
|---|---|---|---|---|---|---|---|
| Quadrant | DetID | PixID | Counts | Sigma | Mean | Median | Sigma |
| A | 3 | 78 | 129400 | 743.08 | 698 | 680 | 173.2 |
| A | 4 | 159 | 38987 | 221.14 | 698 | 680 | 173.2 |
| A | 4 | 3 | 32260 | 182.31 | 698 | 680 | 173.2 |
| B | 10 | 247 | 600366 | 4152.82 | 679 | 655 | 144.4 |
| B | 5 | 172 | 287241 | 1984.52 | 679 | 655 | 144.4 |
| B | 5 | 185 | 117811 | 811.27 | 679 | 655 | 144.4 |
| C | 12 | 252 | 57971 | 305.35 | 686 | 681 | 187.6 |
| C | 14 | 254 | 47700 | 250.61 | 686 | 681 | 187.6 |
| C | 15 | 147 | 24808 | 128.6 | 686 | 681 | 187.6 |
| D | 11 | 129 | 6146522 | 35856.31 | 608 | 580 | 171.4 |
| D | 8 | 160 | 149567 | 869.21 | 608 | 580 | 171.4 |
| D | 8 | 48 | 104197 | 604.52 | 608 | 580 | 171.4 |
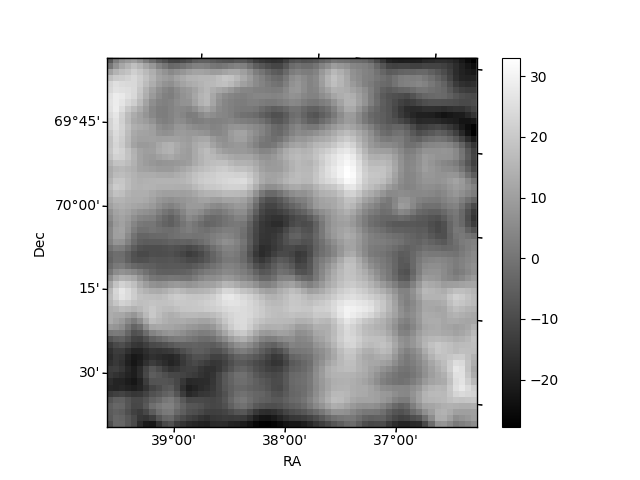
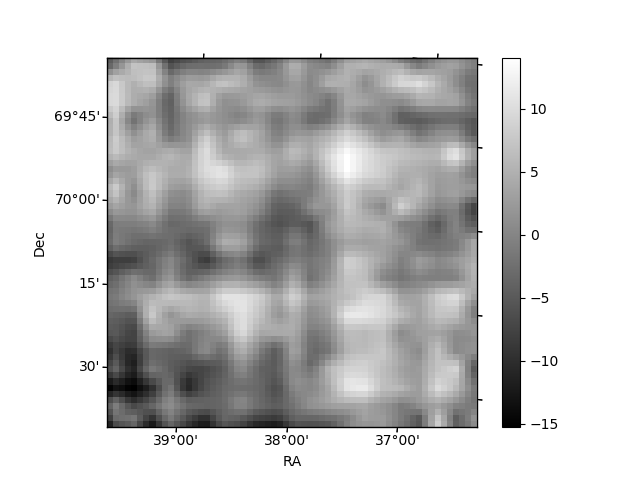
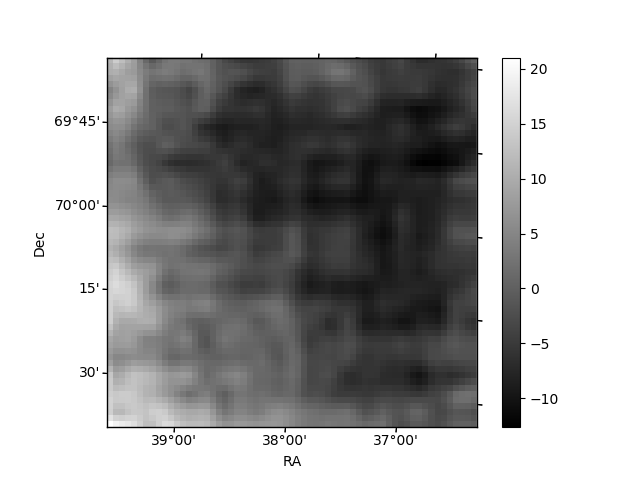
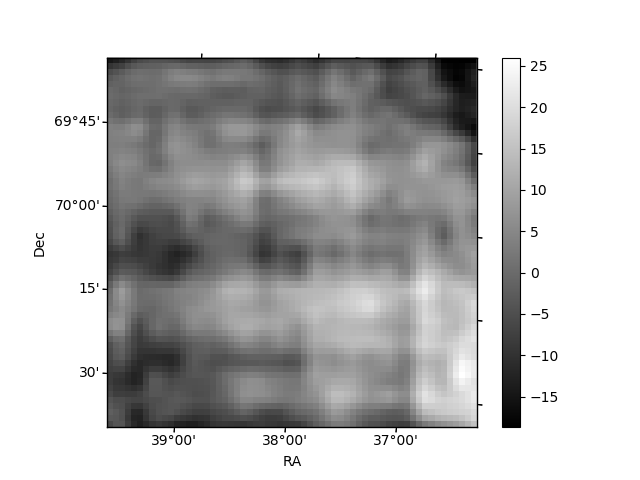
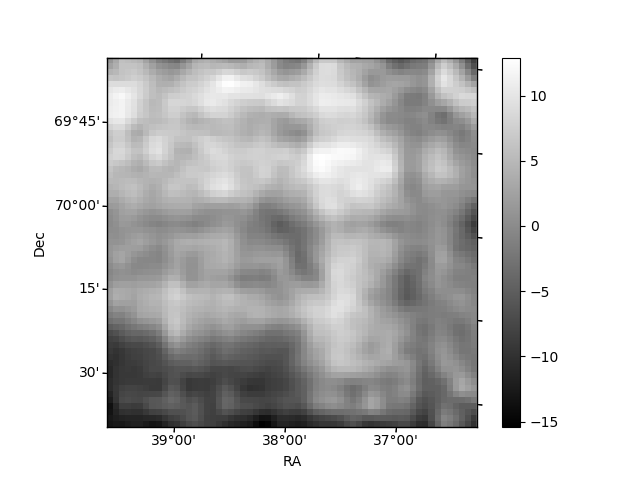
Histogram calculated using DETX and DETY for each event in the final _common_clean file
| Quadrant A | 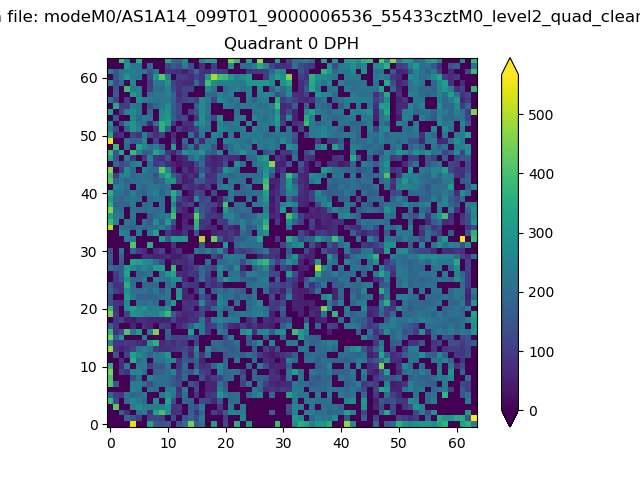 |
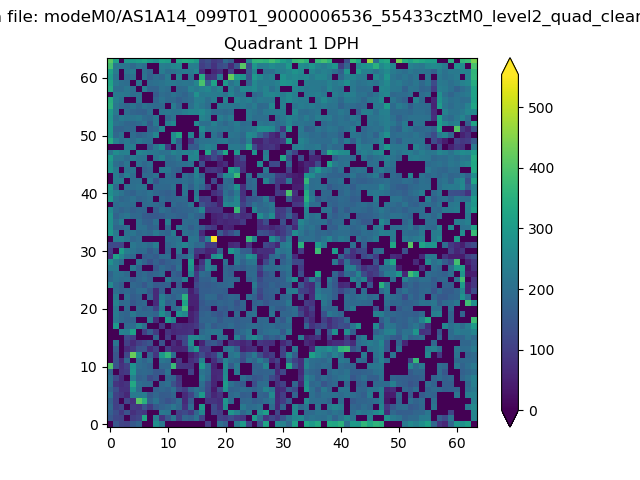 |
Quadrant B |
|---|---|---|---|
| Quadrant D | 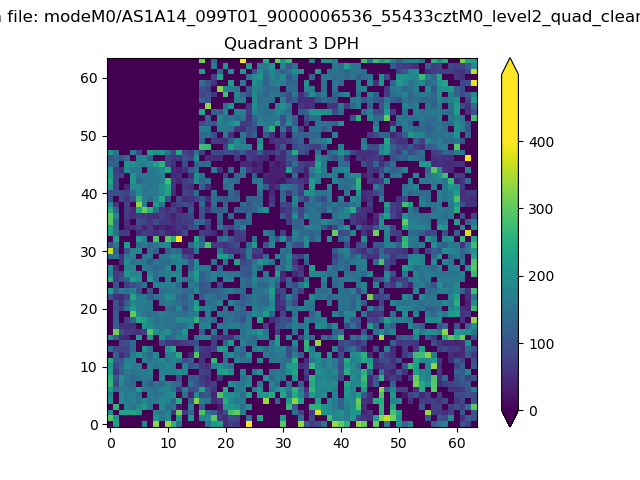 |
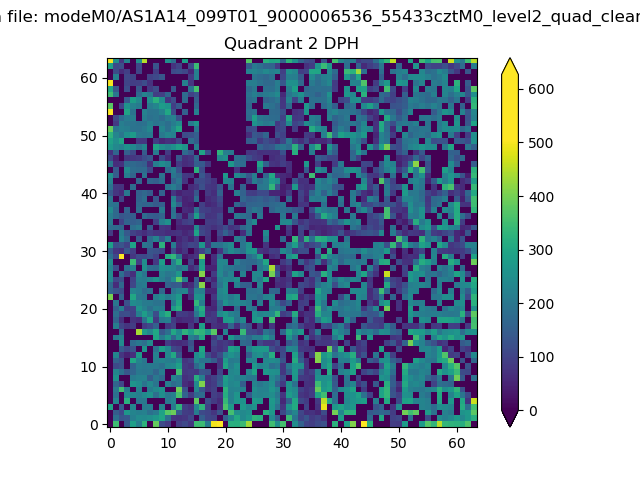 |
Quadrant C |
| Plot type | Count rate plots | Images |
|---|---|---|
| Comparison with Poisson distribution Blue bars denote a histogram of data divided into 1 sec bins. Red curve is a Poisson curve with rate = median count rate of data. |
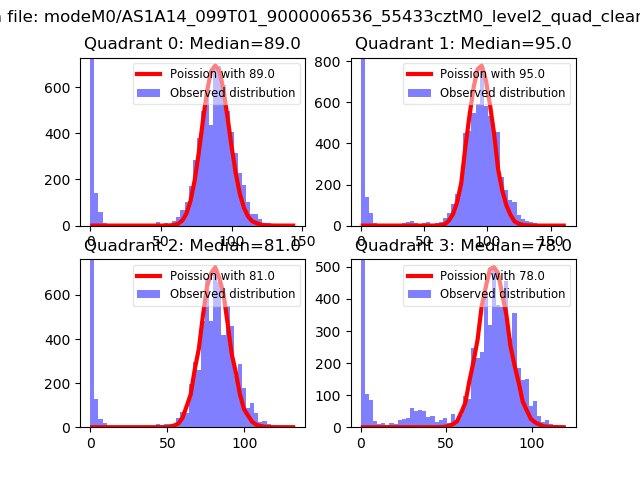 |
 |
| Quadrant-wise count rates Data is divided into 100 sec bins |
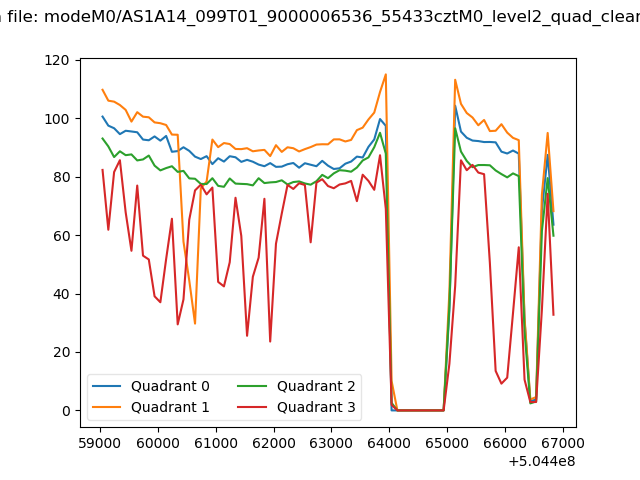 |
|
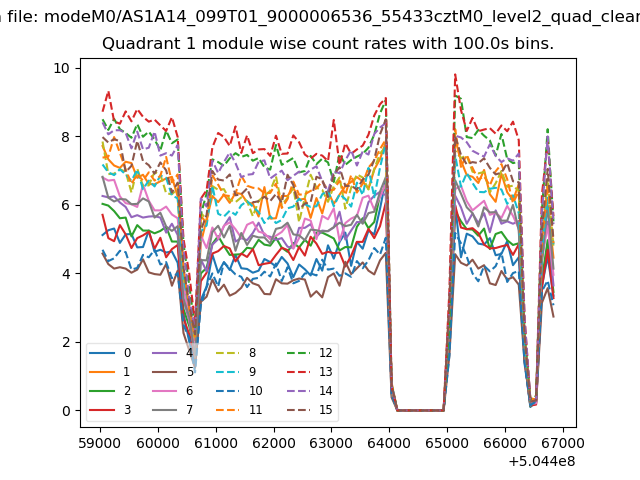
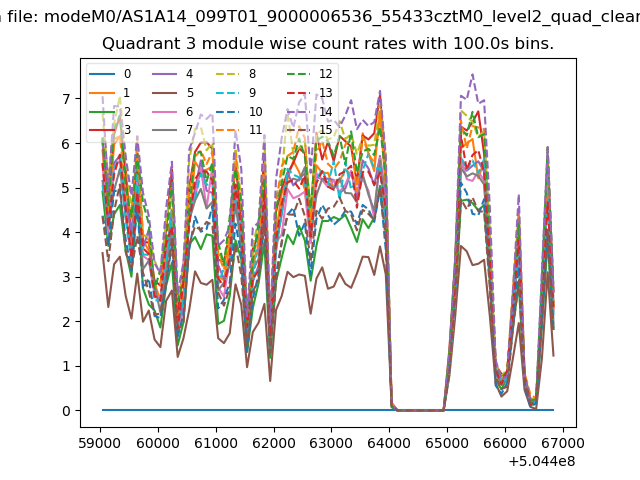
| Module-wise count rates for Quadrant A Data is divided into 100 sec bins |
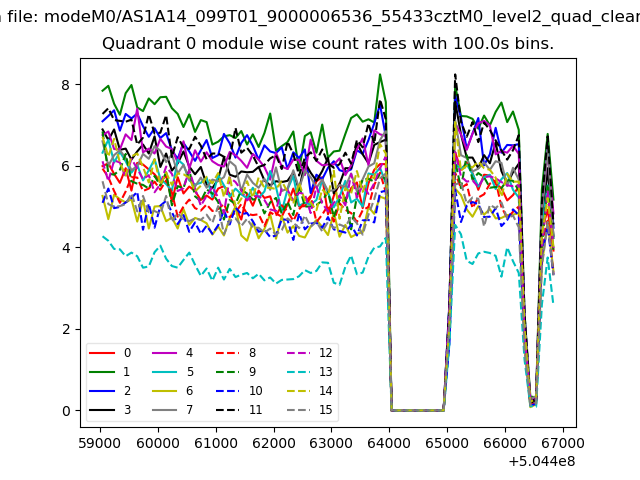 |
 |
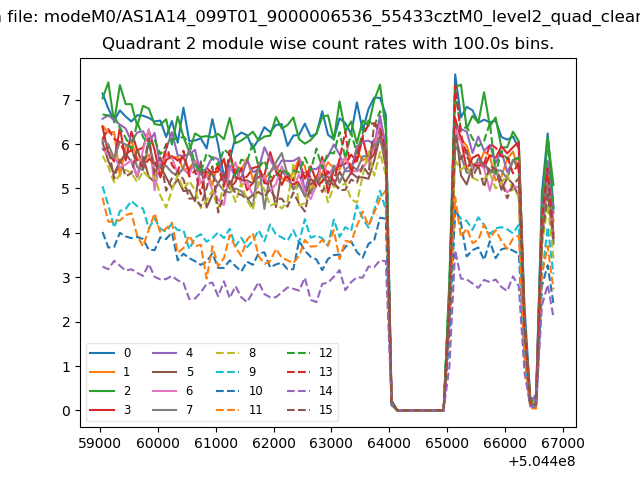
| Module-wise count rates for Quadrant B Data is divided into 100 sec bins |
 |
 |
| Module-wise count rates for Quadrant C Data is divided into 100 sec bins |
 |
 |
| Module-wise count rates for Quadrant D Data is divided into 100 sec bins |
 |
 |
| Parameter | Plot |
|---|---|
| CZT HV Monitor | 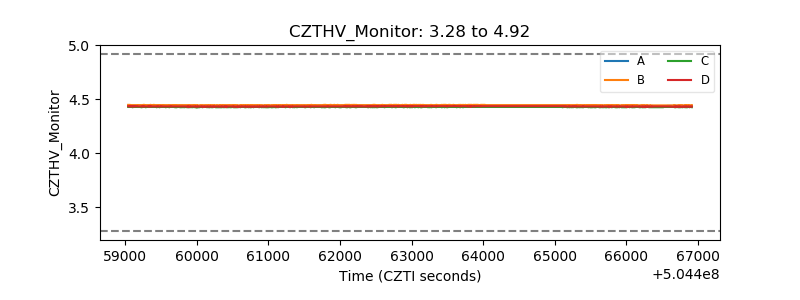 |
| D_VDD | 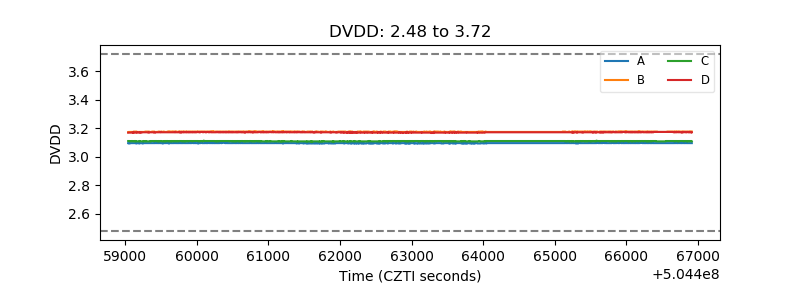 |
| Temperature 1 | 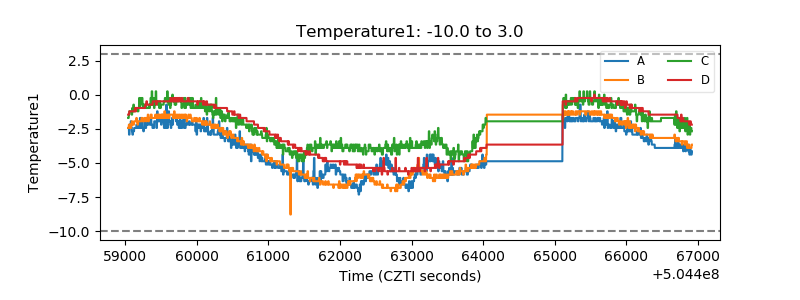 |
| Veto HV Monitor | 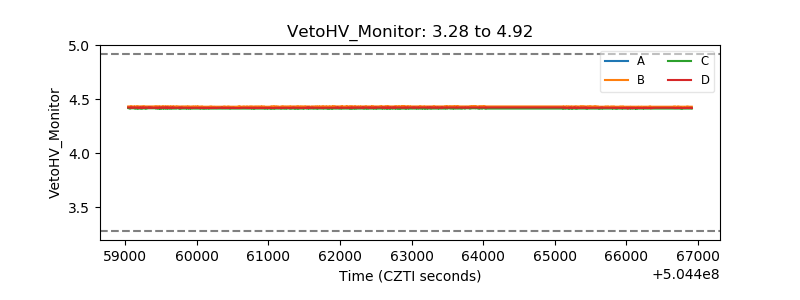 |
| Veto LLD | 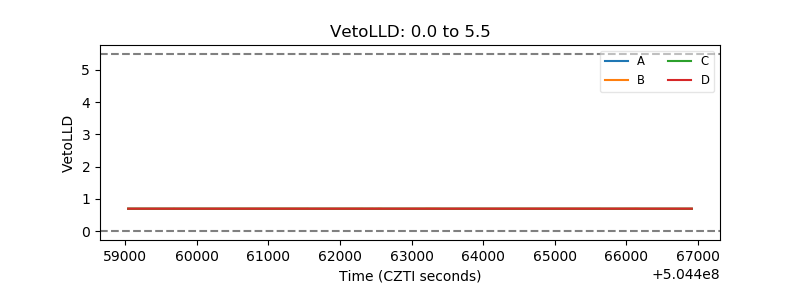 |
| Alpha Counter | 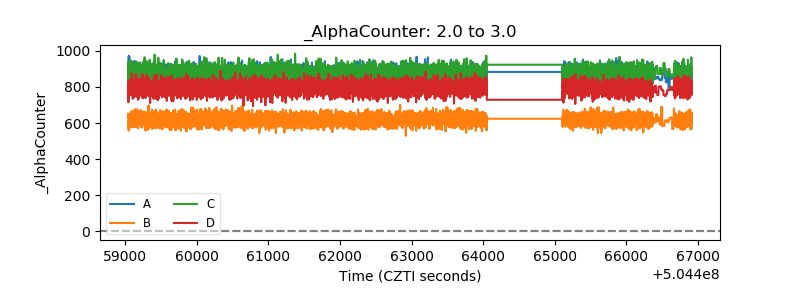 |
| _CPM_Rate | 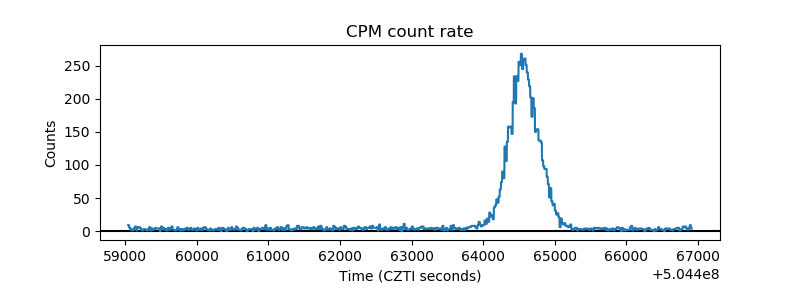 |
| CZT Counter | 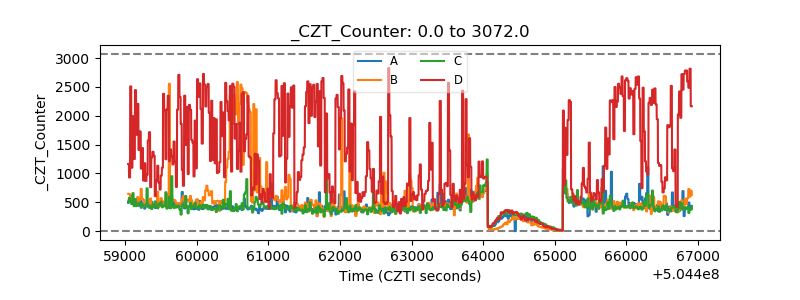 |
| +2.5 Volts monitor |  |
| +5 Volts monitor | 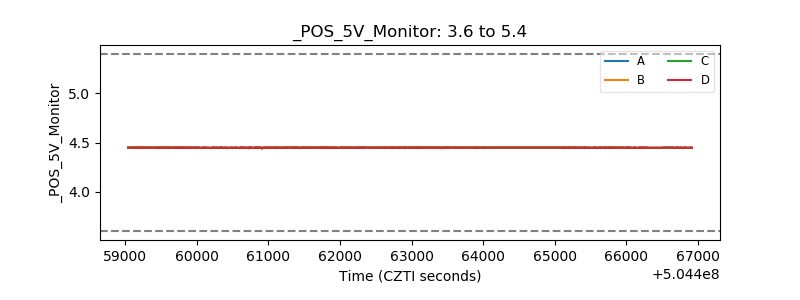 |
| _ROLL_ROT | 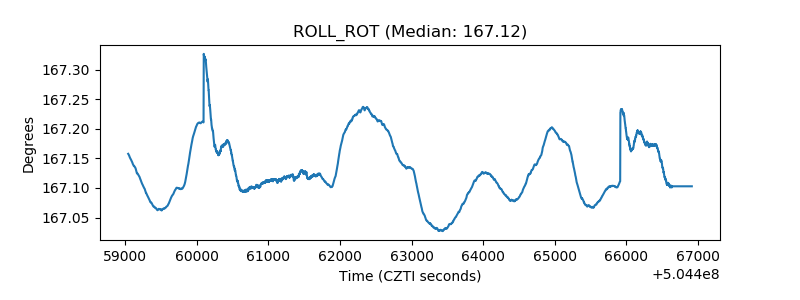 |
| _Roll_DEC | 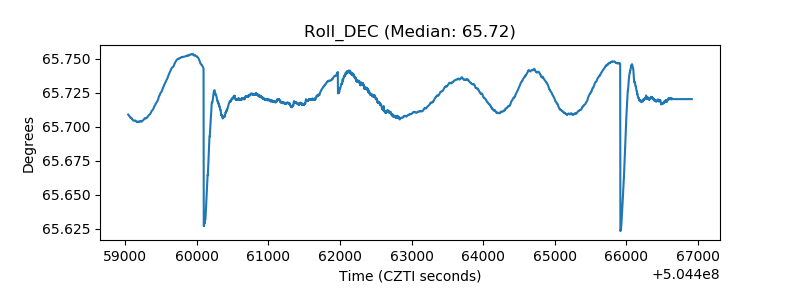 |
| _Roll_RA | 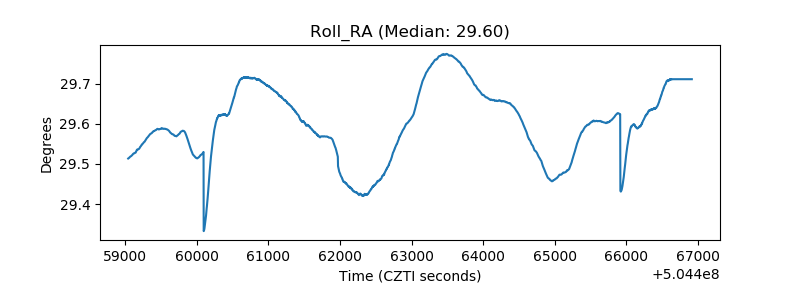 |
| Veto Counter | 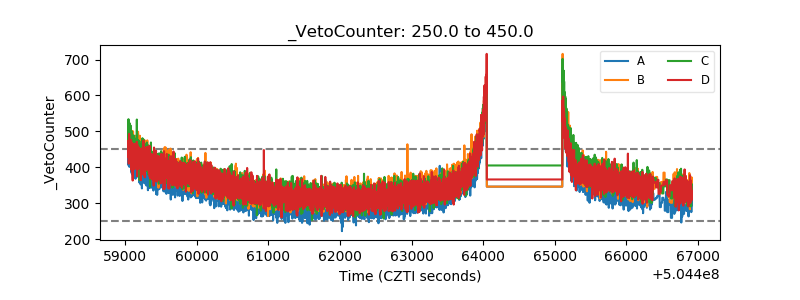 |